Compound Trading Chat Room Stock Trading Plan and Watch List Wednesday April 18, 2018: $DCAR, $CALA, EIA, OIL, $WTI, $USOIL, GOLD $GLD, Crypto, $BTC, $SPY, $NFLX – SP500, $SPY, $BTC, Bitcoin, Gold, $GLD, $GDX, OIL, $WTI, $USOIL, Volatility, $VIX , Silver, $SLV, US Dollar Index, $DXY … more.
Welcome to the morning Wall Street trading day session at Compound Trading!
Notices:
April Sale On Now! 10 Promo Codes Per Select Items Only! Ends Apr 30 or if Promo Code limit for a specific item has been reached (10). If there is no sale price beside item listed it is sold out. Click here for available Promo Codes. https://compoundtrading.com/overview-features/ … #trading #stockmarket
April Sale On Now! 10 Promo Codes Per Select Items Only! Ends Apr 30 or if Promo Code limit for a specific item has been reached (10). If there is no sale price beside item listed it is sold out. Click here for available Promo Codes. https://t.co/TFgZFPzOBt #trading #stockmarket
— Melonopoly (@curtmelonopoly) April 16, 2018
Details to our next Trading Boot Camp in May! We’re over 70% booked so don’t wait. 30% off on this session! And what a location! #tradecoaching #learntotrade
https://twitter.com/CompoundTrading/status/982706326454358017
Notes in red text below are new comments entered specifically today (or recently important).
Live Trading Room Link:
http://compoundtrading1.clickmeeting.com/livetrading
Real-time Alerts for Oil, Gold, Swing Trading, Day Trading, Bitcoin are now available by following specific alert Twitter feeds.
Disclaimer / disclosure: Every subscriber must read this disclaimer.
Reporting and Next Gen Algorithms:
BE SURE to get in to each private Discord server specific to your subscription as many of the updates as we go forward will be posted in there. This includes the SWING TRADING platform also.
IF YOU NEED A LINK / INVITE email or DM us!
Connect with us on Discord.
https://twitter.com/CompoundTrading/status/880670140454637569
Recent Blog / Video / Social Posts:
#BitcoinTrading 101: A Beginner’s Guide to Getting Started $BTCUSD $XBTUSD $BTC https://compoundtrading.com/bitcointrading-101-beginners-guide-getting-started-btcusd-xbtusd-btc/ …
https://twitter.com/CompoundTrading/status/927397024315662336
How to Use EPIC Oil Algorithm: $USOIL, $WTI, $CL_F, $USO, $UCO, $SCO, $UWT, $DWT, #OIL, #OOTT: http://youtu.be/hawVV31G9bg?a via @YouTube
https://twitter.com/CompoundTrading/status/889148655785177088
How to Use ROSIE Gold Algorithm: #GOLD, $GLD, $XAUUSD, $GDX, $GDXJ, $NUGT, $DUST, $JNUG, $JDST
https://twitter.com/CompoundTrading/status/889147527278333952
Recent Chart / Trade Set-Ups:
See You Tube for other recent video posts.
$FB Facebook Long Set-Up Testing Buy Sell Trigger
Twitter Trading Plan $TWTR (Part two)
Twitter Trading Plan $TWTR (Part two)
#SwingTrading Midday Review – Compound Trading: $LTBR, $ANF, $MOMO, $APTO, $USOIL, $WTI, $BA, $NFLX
No Crystal Ball? Watch this… EPIC Oil Algorithm #EIA $USOIL $WTI #OIL $USO $CL_F #OOTT #Algo
#SwingTrading Midday Review: $NFLX $BTCUSD $SPY $VCEL $COT $DXY #GOLD $GLD $SLV $USOIL $WTI
Recent Educational Videos:
Want to learn how to trade stocks for consistent profit? Raw trading footage video library. https://www.youtube.com/channel/UCxmgJ3CfWHRBFFMpoHumZ8w … … #freedomtraders
Visit the Trading Educational and Analysis Play List at this Link on our YouTube Channel
Trading Plan (Buy, Hold, Sell) Watch Lists. Morning Momentum / Gap / News / PR / IPO / SEC Filings / Earnings Stocks on Watch:
Stocks making the biggest moves premarket: $MS, $TXT, $IBM, $UAL, $CSX, $LUV, $AMZN & more –
Time to look at metals and crypto very closely… in prep for a short term retrace in our broad market bull move inflection that should peak soon and retrace for a rest. Crypto up or down has high ROE ROI #commodities #crypto #trading #algorithm #models $STUDY
Well that worked well… very profitable – after chart review I am bias some retrace is soon, I am short term trimming all positions here. We had over twenty long side alerted positions in this move. 100% winners. Timestamped. $STUDY #boomtown #premarket #trading #stockmarket https://t.co/HGHmFnnXsN
— Melonopoly (@curtmelonopoly) April 18, 2018
Market Observation:
As of 7:45 AM: US Dollar $DXY trading 89.52, Oil FX $USOIL ($WTI) trading 67.43, Gold $GLD trading 1350.31, Silver $SLV trading 16.98, $SPY trading 270.19, Bitcoin $BTC.X $BTCUSD $XBTUSD trading 8100.00 , and $VIX trading 15.1.
Recent Momentum Stocks to Watch:
News:
$DCAR DropCar Reports Q1 B2B automotive volumes rose 163% year over year.
$MDGS Medigus and HC Marbella International Hospital Announce First MUSE™ Procedure for GERD Treatment in Spain
$RIGL FDA approves Tavalisse.
$CYTR CytRx Presents Statistically Significant Breakthrough Data for Its Albumin Binding Ultra High Potency LADR™ Drug Candidates at the American Association for Cancer Research 2018 Annual Meeting
$IDXG: Interpace Diagnostics Enters Agreement with One of the Largest, Integrated Health Systems in the US
Recent SEC Filings:
Recent IPO’s:
Earnings:
#earnings scheduled for the week
$NFLX $BAC $GE $LRCX $GS $UNH $IBM $JNJ $CLF $MTB $ABT $MS $ISRG $PGR $CMA $PG $AA $BX $AXP $ASML $MLNX $HON $UAL $FRED $NUE $SLB $PIR$DGX $URI $GSM $CE $CSX $GWW $WM $SEAC $NTRS $PNFP $KEY $WTC $USB $OMC $SKX $TXT $ETFC
http://eps.sh/cal
#earnings scheduled for the week$NFLX $BAC $GE $LRCX $GS $UNH $IBM $JNJ $CLF $MTB $ABT $MS $ISRG $PGR $CMA $PG $AA $BX $AXP $ASML $MLNX $HON $UAL $FRED $NUE $SLB $PIR$DGX $URI $GSM $CE $CSX $GWW $WM $SEAC $NTRS $PNFP $KEY $WTC $USB $OMC $SKX $TXT $ETFChttps://t.co/r57QUKKDXL https://t.co/9agjWeri4f
— Melonopoly (@curtmelonopoly) April 16, 2018
Trade Set-up Alerts – Recent / Current Holds, Open and Closed Trades:
April 12 – Special Swing Report – $FB Facebook Long Set-Up Testing Buy Sell Trigger #swingtrading (Public Edition)
$FB Facebook long side trade from 153.40 Mar 28 buy side trigger now testing buy sell trigger 167.51. See chart notes. #swingtrading https://www.tradingview.com/chart/FB/968SzV2E-Facebook-New-Buy-Sell-Trigger-Here-Now-See-Chart-Notes/

April 11 – Swing Trading in Review. $DIS, $C, $TSLA, $FB, $SPY, $GDX, $CELG https://compoundtrading.com/swing-trading-review-dis-c-tsla-fb-spy-gdx-celg/ …
https://twitter.com/CompoundTrading/status/983045524839452672
Charts and Chart Set-ups on Watch:
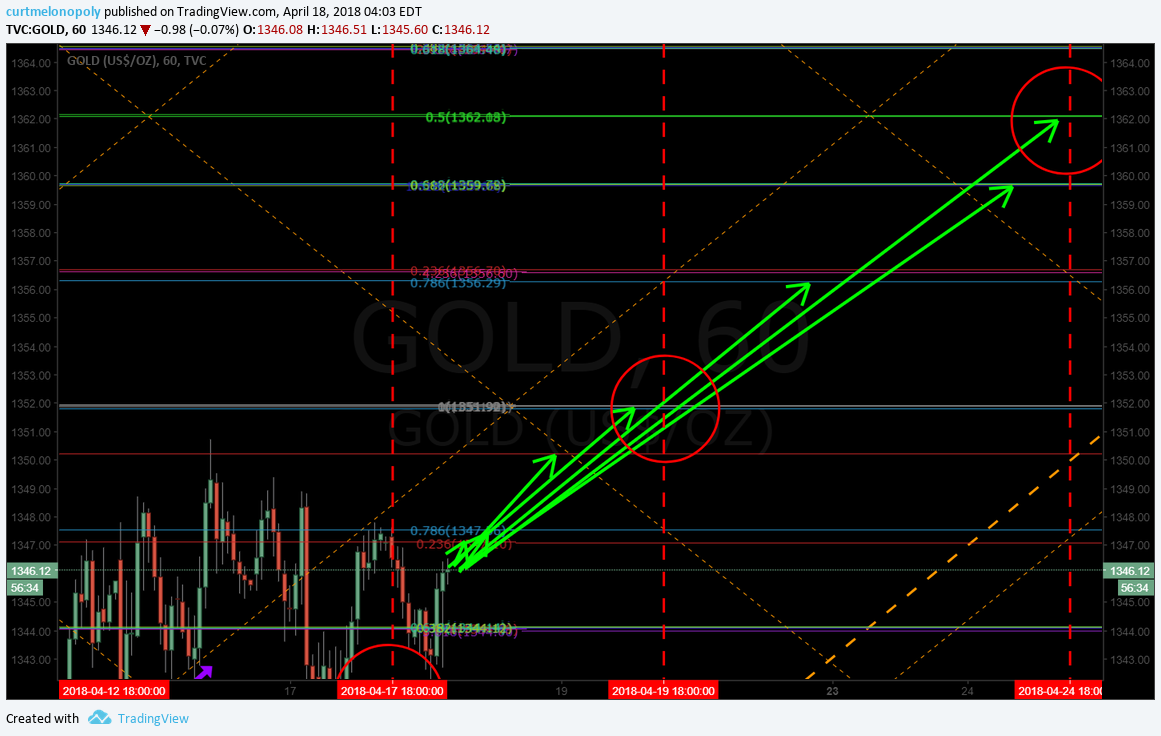
Gold bulls continue to press the upper resistance points on daily chart model. #Gold $GLD $GC_F $XAUUSD $NUGT $DUST

$GDX Gold miner trading near mid quad resistance test and perfectly on way to price target. $NUGT $DUST $JNUG $JDST

$FEYE trade went as prescribed in last report – bias long to upside price target 22.32 June 27.

April 12 – Bullish indicator – price didn’t drop in to target this time. Not absolute indication of turn, but is a signal. $BTC

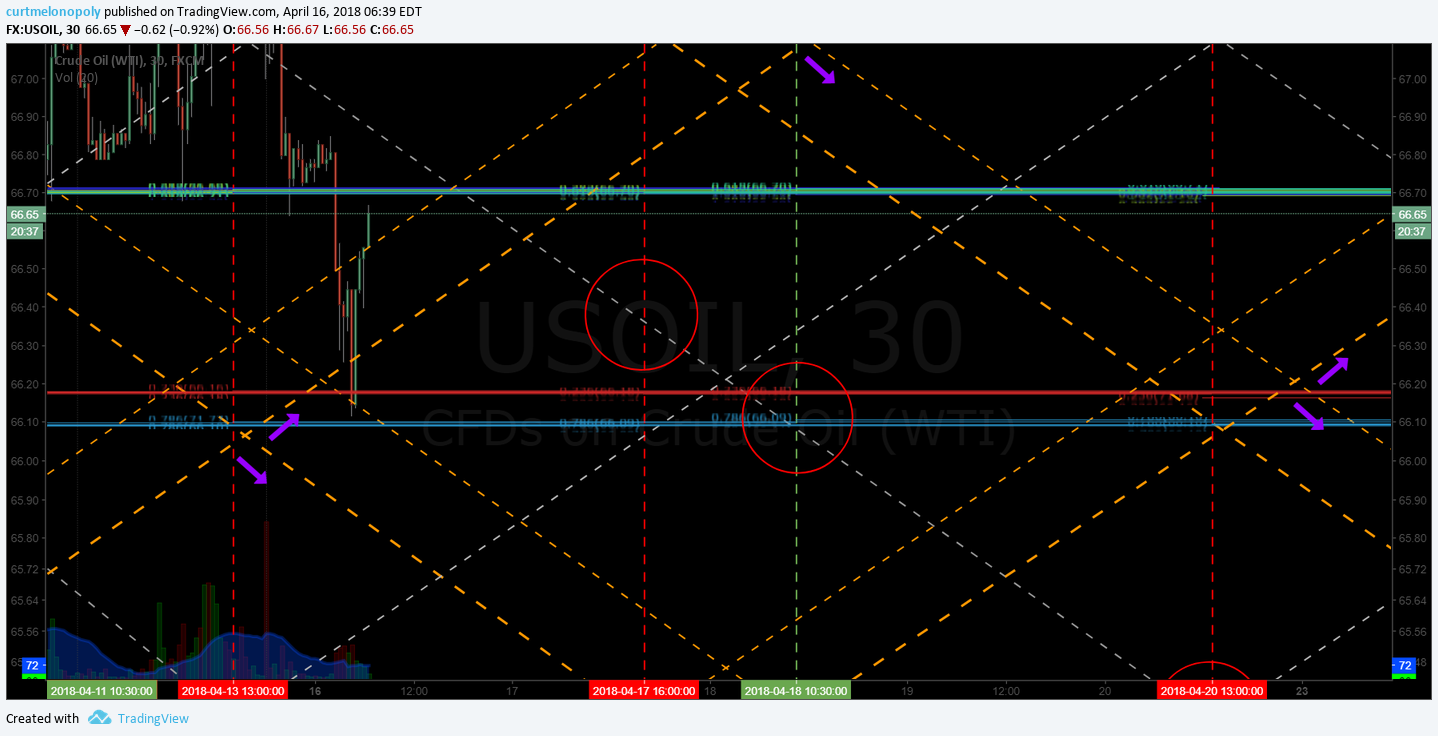
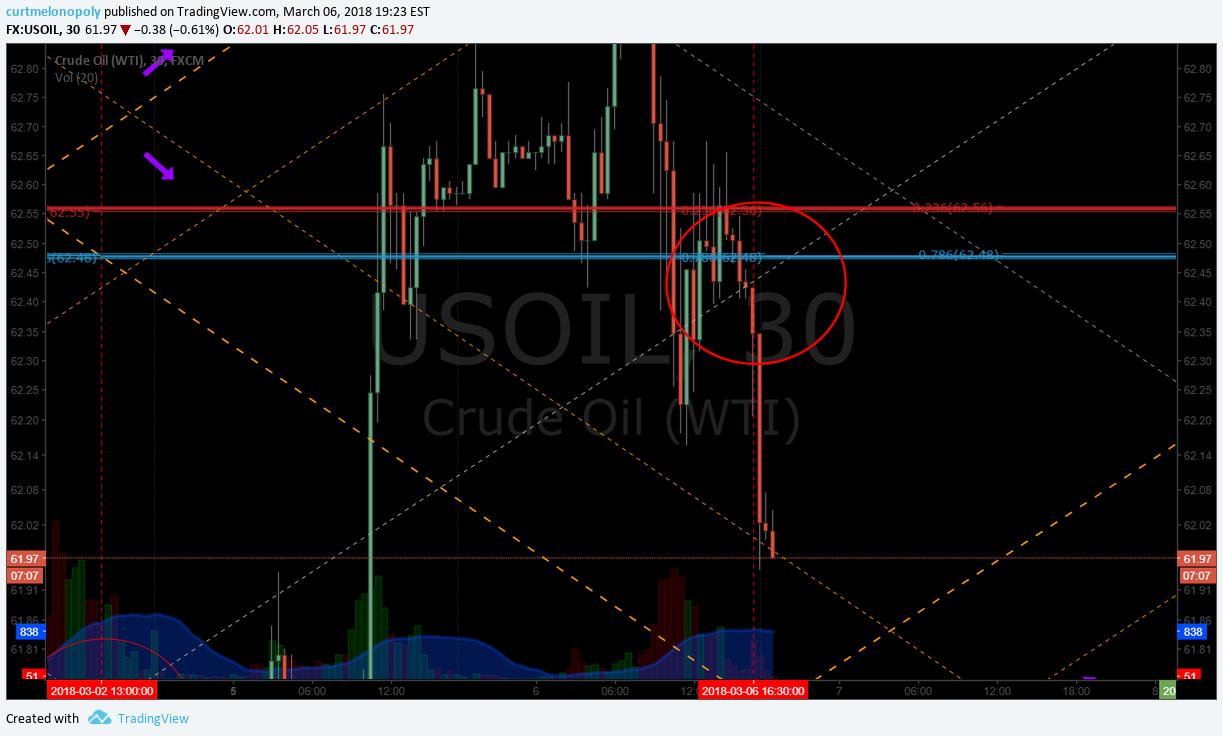
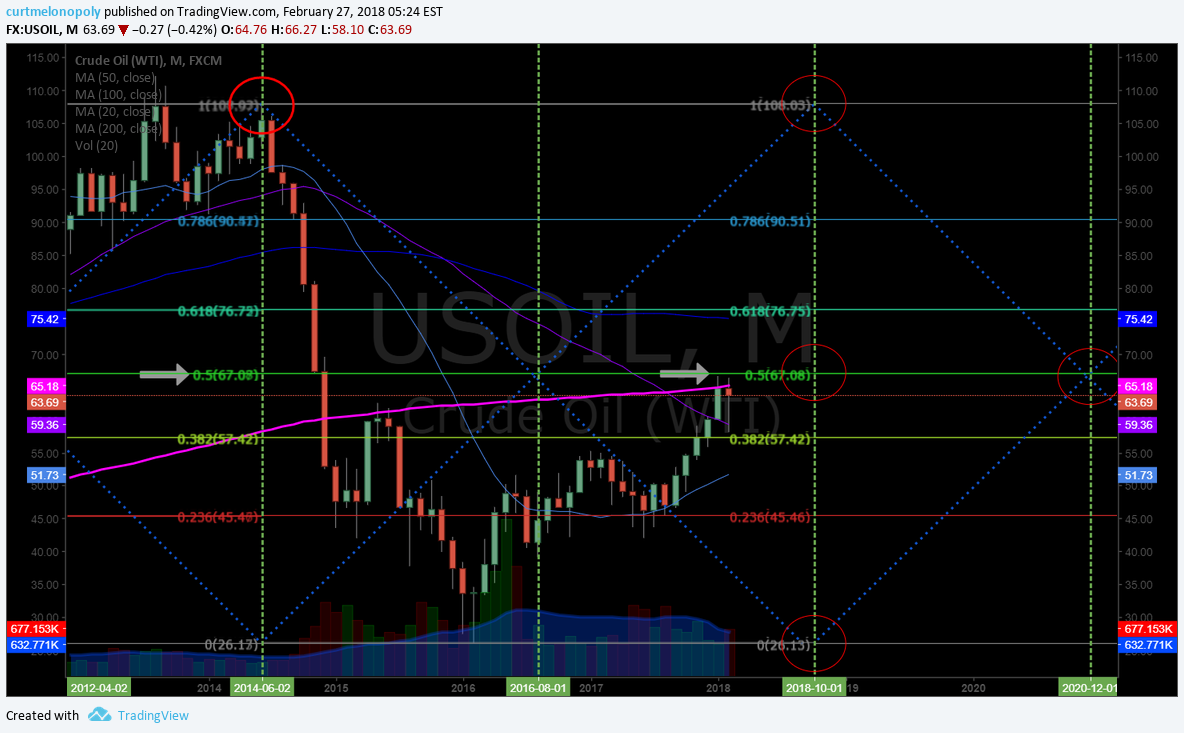
April 11 – Oil monthly. Near previous highs. Bias trim long to no hold and wait. $USOIL $WTI $CL_F #OIL #OOTT $USO $UWT $DWT

$CELG 86s to 91s off alert, buy sell trigger now. Chart Notes. https://www.tradingview.com/chart/CELG/gdKoFxEq-CELG-86s-to-91s-off-alert-buy-sell-trigger-now-Chart-Notes/ …
$CELG 86s to 91s off alert, buy sell trigger now. Chart Notes. https://t.co/5AWSJCxqA5 pic.twitter.com/9SaQX01K5U
— Swing Trading (@swingtrading_ct) April 8, 2018
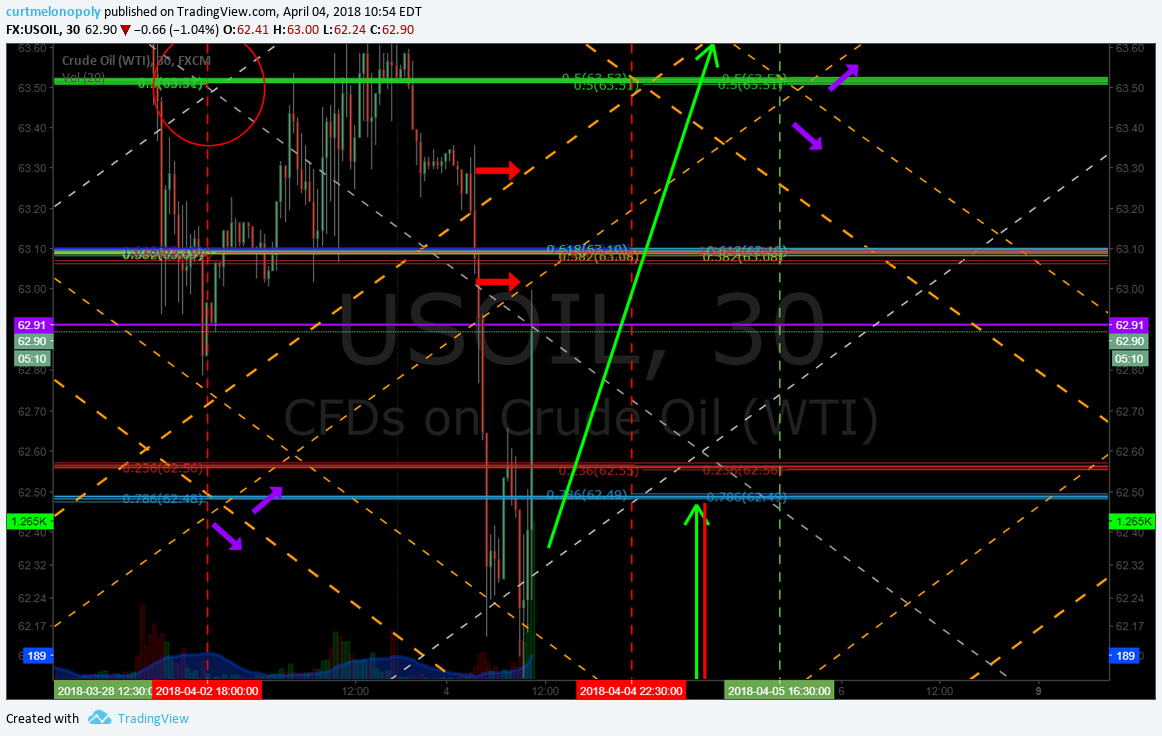
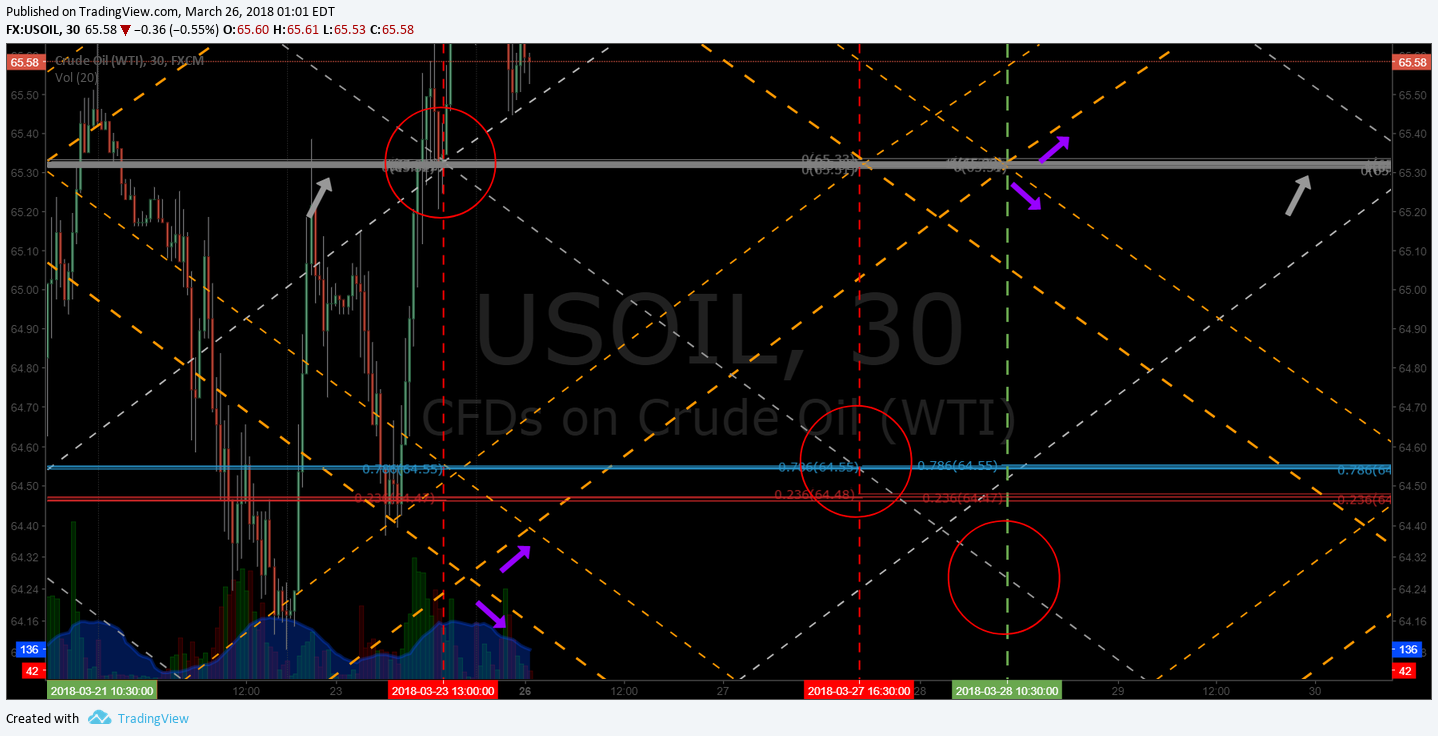
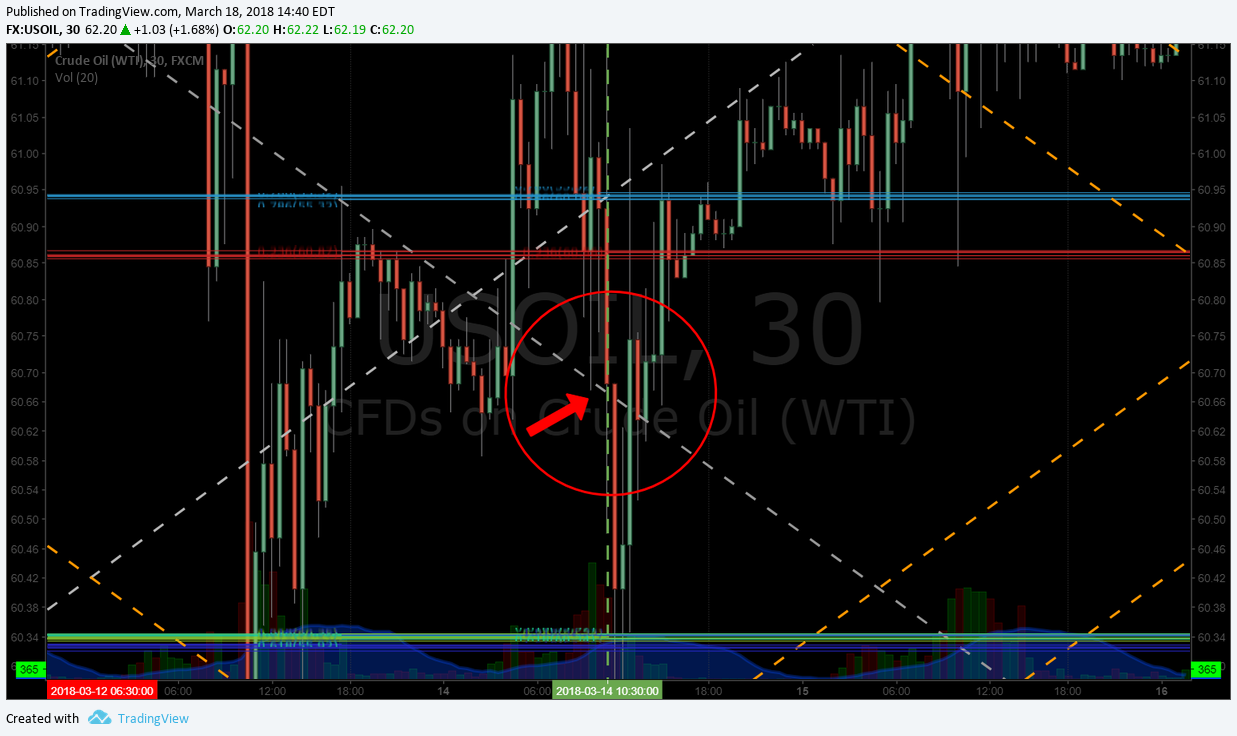
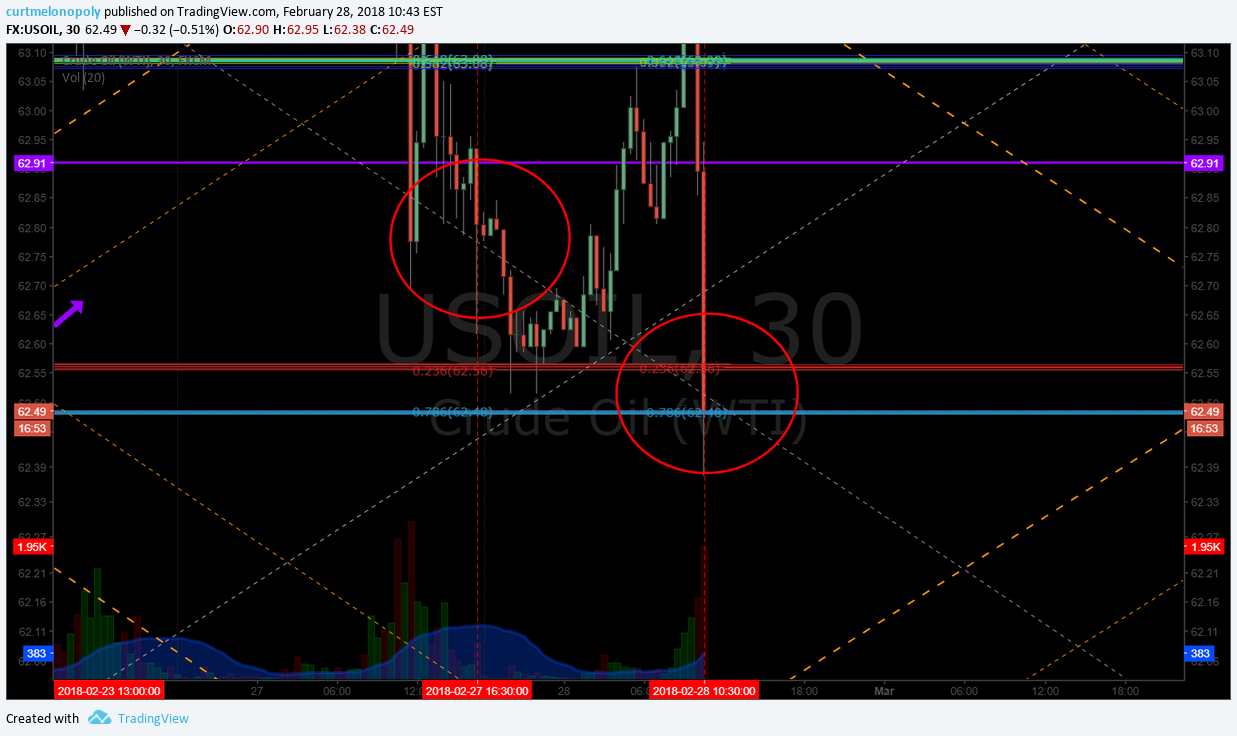
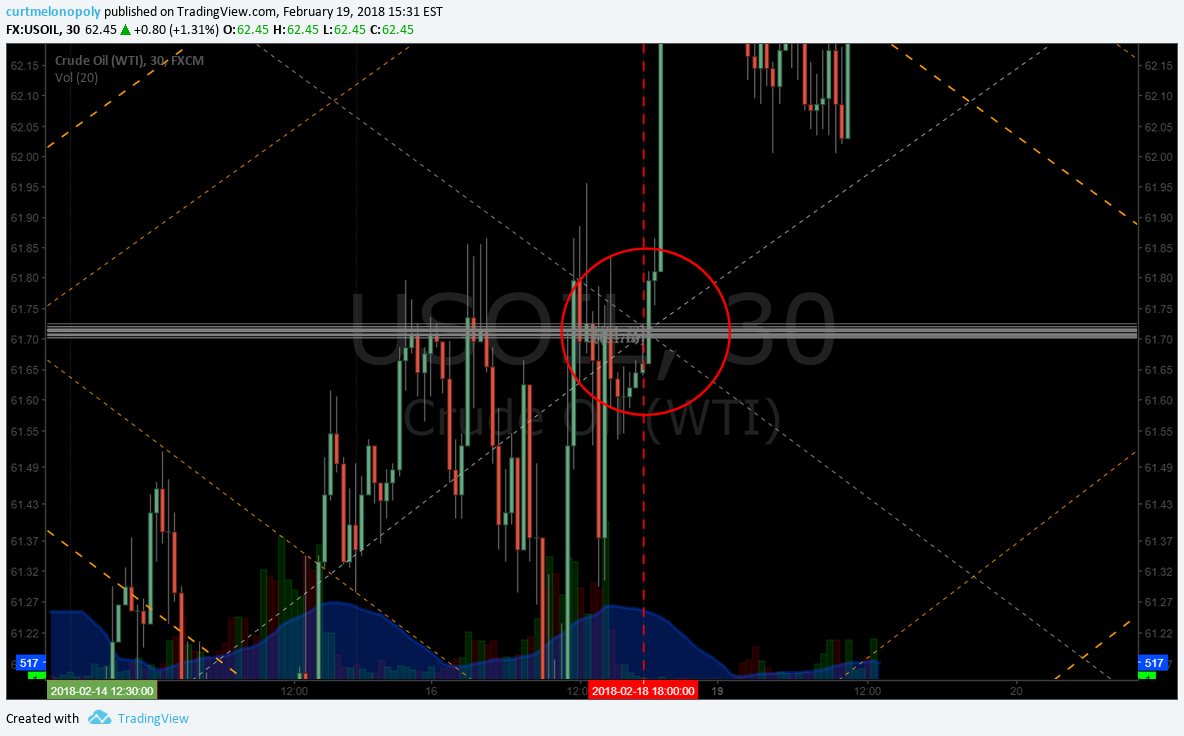
Oil Resistance One of Most Predictable Trades in Markets. See chart notes. $USOIL $WTI $CL_F #OIL #OOTT $USO $UWT $DWT https://www.tradingview.com/chart/USOIL/LFoaIZEq-Oil-Resistance-One-of-Most-Predictable-Trades-See-chart-notes/ …
https://twitter.com/EPICtheAlgo/status/982760354815053824
$MXIM under 55.94 short side looks great. MACD turn. See Chart notes. #swingtrading https://www.tradingview.com/chart/MXIM/l2JjyH3X-MXIM-under-55-94-short-side-looks-great-MACD-turn-Chart-notes/ …
$MXIM under 55.94 short side looks great. MACD turn. See Chart notes. #swingtrading https://t.co/nNQfOV6rMr pic.twitter.com/4241zYTpX0
— Swing Trading (@swingtrading_ct) April 8, 2018
Litecoin will have to bounce near here if chart structure to remain in place. $LTC
If it doesn’t bounce near up channel support (yellow diagonal line) it could run another trading quad area down very easily.
See chart notes.
https://www.tradingview.com/chart/LTCUSD/NAsEtGUs-Litecoin-likely-bounce-near-here-for-chart-structure-Chart-notes/ …
Litecoin will have to bounce near here if chart structure to remain in place. $LTC
If it doesn't bounce near up channel support (yellow diagonal line) it could run another trading quad area down very easily.
See chart notes.https://t.co/SMEVswx4ha pic.twitter.com/EHM5S9DmcC
— Crypto the BTC Algo (@CryptotheAlgo) April 7, 2018
$TSLA also blasting here from yesterday’s alert🔥 In it to win it. #swingtrading
$TSLA also blasting here from yesterday's alert🔥 In it to win it. #swingtrading pic.twitter.com/JEefAyUROL
— Melonopoly (@curtmelonopoly) April 5, 2018
$DIS swing trade set-up from swing trading report yesterday blasting here🔥 Nice set-up. In it to win it. #swingtrading https://twitter.com/SwingAlerts_CT/status/981914928528416768/photo/1pic.twitter.com/muDQaThxP2
$DIS swing trade set-up from swing trading report yesterday blasting here🔥 Nice set-up. In it to win it. #swingtrading https://t.co/muDQaThxP2 pic.twitter.com/UXpvTgLpuo
— Melonopoly (@curtmelonopoly) April 5, 2018
Trade in $C Citi on fire🔥In it to win it. #swingtrading
Trade in $C Citi on fire🔥In it to win it. #swingtrading pic.twitter.com/0HKG0jH9sb
— Melonopoly (@curtmelonopoly) April 5, 2018
Market Outlook, Market News and Social Bits From Around the Internet:
#5things
-CIA director met Kim
-Inflation misses
-#Oil rally
-#Markets mixed
-BOC decision
https://www.bloomberg.com/news/articles/2018-04-18/five-things-you-need-to-know-to-start-your-day
Economic Data Scheduled For Wednesday
Economic Data Scheduled For Wednesday pic.twitter.com/R8Kl705PSe
— Benzinga (@Benzinga) April 18, 2018
If you are new to our trading service you should review recent blog posts, the Compound Trading YouTube Channel and at minimum our algorithm Twitter feeds because they do tell a story in terms of the market and how the inflections of the market determine our day to day trading. You will notice the algorithmic modelling has been undeniably accurate with many time-frames (intra-day, weeks and months out) so I myself have learned to respect their math (they have taken me from a 60% hit rate to 80%+ in my trading – all publicly posted live trades).
Momentum Stocks (Market Open and Intra-Day):
I do trade morning momo stocks, but I do avoid much of the day trading risk (preferring to daytrade only what is structurally set-up also on the swing trade side and to my advantage in the algorithmic model charting). I often avoid the first 30 minutes (gap and go) and trade momentum stocks or structured (per explanation in previous sentence) stocks later in day after a wash-out looking for a snap-back trade that can possibly also become a strong swing or longer term trade that I can leg in to. Just prior to open and shortly after open I post momentum stocks to the trade chat room (and Twitter and Stocktwits if I have time).
Some of my Favorite Intra-day Trading Set-Ups:
(1) Momentum Stock Wash-Outs for Snap Back, (2) Bad News Wash-outs on Stocks with High Institutional Ownership, (3) Getting on the Right Side of a Trend Change and scaling in my position and (4) Our Algorithm Charting Model Set-Ups.
The momentum stocks (from previous days and morning trade) I continue to watch through the day for indicators that allow a trade.
Morning Stock Watch-Lists for my Favorite Set-Ups:
(1) Pre-Market Gainers Watch-List: $DCAR 30%, $CALA 11%, $TLGT $RIGL $TXT $RUSL $EBAY $CPST $GOGL $ACRX $VTVT $ISRG $UWT $SBGL $ZSAN $USLV $MBT $YNDX $KTOS $CATB $FSLR $RIO $VMW $MS
(2) Pre-market Decliners Watch-List : $IBM $LRCX $DWT $AMAT $ASML $STM $ROKU $BTI $DGAZ $MU $MO
(3) Other Watch-List:
(4) Regular Algo Charting Watch-List: Gold $GC_F $GLD, Miners $GDX ($NUGT, $DUST, $JDST, $JNUG), Silver $SLV $SI_F ($USLV, $DSLV), Crude Oil FX: $USOIL $WTI ($UWT, $DWT, $USO, $UCO, $CL_F, $UWT, $DWT), Natural Gas $NG_F ($UGAZ, $DGAZ), S & P 500 $SPY $ES_F ($SPXL, $SPXS), US Dollar Index $DXY ($UUP), Volatility $VIX ($TVIX, $UVXY), $BTCUSD Bitcoin.
(5) Recent Upgrades: $NCLH $DLTR $TEL $WBT $ZAYO $TRNO $FSLR $MTB $TEX $RARE
$EBAY Ebay Double-Upgraded, Long-Term FCF Seen Up 60%: Morgan Stanley
UnitedHealth Group $UNH PT Raised to $310 at Leerink Partners
(6) Recent Downgrades: $LTXB $JNPR $TEAM $WRI $GRUB $Z $HCSG $ELY $MO $AVXS
OTR Global Out Negative Facebook $FB
Stay tuned in Stock Chat Room for more pre-market stocks on watch.
Study:
For new readers, a review of our unlocked posts on our blog would help you get in to the story we are following with the securities listed in this newsletter.
Free scanners to find momentum stocks that you can easily review charts of for indicators that bring probability of your trade being successful up considerably. These are not useful for first 30 minute market open gap and go type plays (you need a good momentum scanner, level 2, and best to have hot-keys for the first 30 mins of gap and go trading)… but are very useful for intra day scalping and swing trading (start with trending stocks and then look at indicators intra for simple set-ups – study scan study scan study scan).
http://finviz.com/
https://finance.yahoo.com/screener/predefined/ec5bebb9-b7b2-4474-9e5c-3e258b61cbe6
http://www.highshortinterest.com/
http://www.gurufocus.com/short-stocks.php
http://www.3xetf.com/all/
http://www.etf.com/channels/gold-etfs
GL!
Curtis
Algorithm Twitter feeds can be found here: $BTC (@CryptotheAlgo) $WTI (@EPICtheAlgo), $VIX (@VexatiousVIX), $SPY (@FREEDOMtheAlgo), $GLD (@ROSIEtheAlgo), $SLV (@SuperNovaAlgo), $DXY (@DXYUSD_Index). Our Swing Trading Twitter feed is found here: https://twitter.com/swingtrading_ct. Our lead trader Twitter feed is here @curtmelonopoly and lead tech developer @hundalSHS.
Article Topics: Premarket, Watchlist, Stocks, Trading, Plan, $DCAR, $CALA, EIA, OIL, $WTI, $USOIL, GOLD $GLD, Crypto, $BTC, $SPY, $NFLX