Skip to content

Compound Trading Group

  • About
  • White Paper
  • Returns
  • News
    • NOTICE of Online Information Meetings
  • Order
    • Terms
  • About
  • White Paper
  • Returns
  • News
    • NOTICE of Online Information Meetings
  • Order
    • Terms

Tag Archives: Gold

  1.   »  
  2. Tag Archives: Gold

Tag: Gold

Trade Set-Ups $SPY, Gold, $GC_F, $GDX, Bitcoin, $GOOGL, $EVLV, $HEAR, $CHEK, $MARA, $PRTA, $ZDGE

Trade Set-Ups $SPY, Gold, $GC_F, $GDX, Bitcoin, $GOOGL, $EVLV, $HEAR, $CHEK, $MARA, $PRTA, $ZDGE

April 25, 2018April 25, 2018 Curt MelonopolySwing Newsletters, Swing Trading$CHEK, $EVLV, $GC_F, $GDX, $GOOGL, $HEAR, $MARA, $PRTA, $ZDGE, BITCOIN, Gold, Trading Set-Ups $SPY

Trading Set-Ups Report and Video for $SPY, Gold, $GC_F, $GDX, Bitcoin, $GOOGL, $EVLV, $HEAR, $CHEK, $MARA, $PRTA, $ZDGE

What’s New!

April Sale On Now! 10 Promo Codes Per Select Items Only! Sale items end April 30, 2018 or if the Promo Code limit for the specific item has been reached (10). If there is no sale price beside the item listed the maximum promo codes have been used. Click here for available Promo Codes.

Interested in free swing trading setups? Click here to sign up for the Complimentary Swing Trading Report Mailing List.

Information about our next trade coaching event May 4, 5, 6 can be found here Trade Coaching Boot Camp.

Now available for serious traders – Legacy All Access Membership.

24 Hour Crypto Trading Desk opens May 2018 along with our Coding Algorithm Models for Machine Trading. Formal announcements to follow.

The Mid Day Trade Set-Ups Video:

Mid Day chart trading set-ups April 24 (summary).

You may or may not know, but the market sold off fairly heavy yesterday. Below is a summary of the mid day video review of the chart set-ups we are following. Also there are links below of other recent videos.

$SPY – Dumped April 2, modeled in advance, we entered in drop, trimmed at resistance and added over all the way up. 262.67 267.99 major buy sell pivots. Trade resting per my alert last week. 262.27 April 27 bearish target in play. Other targets listed on video.

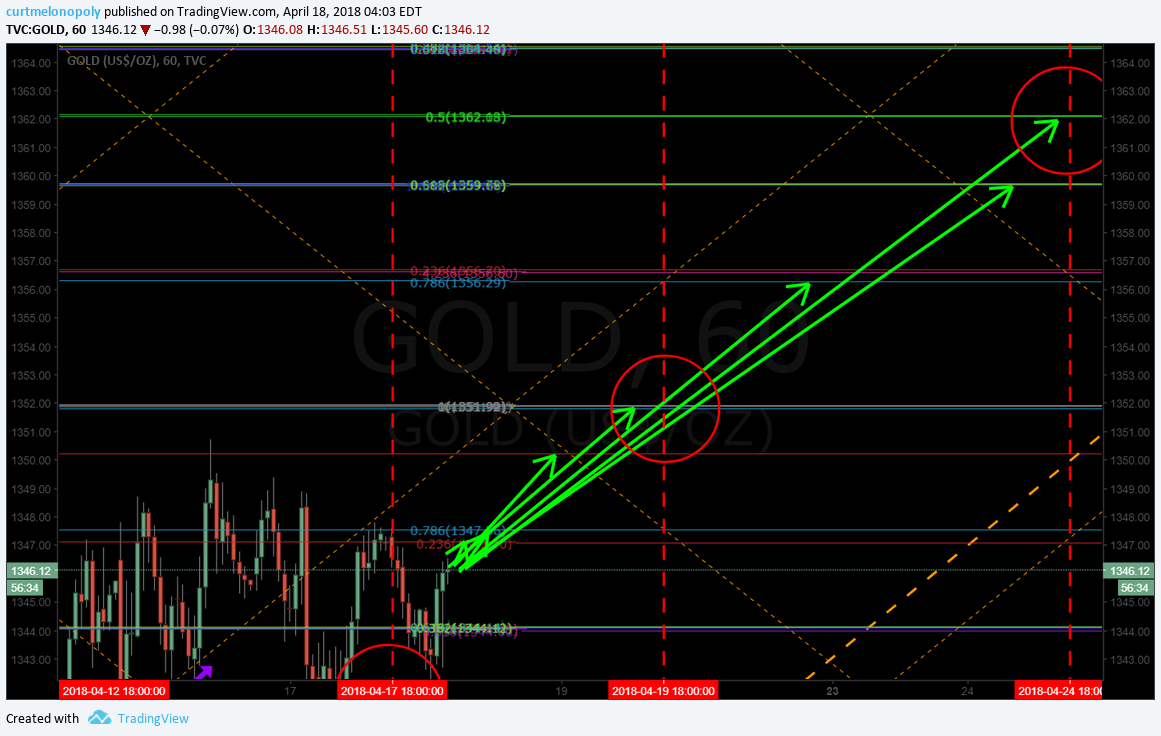
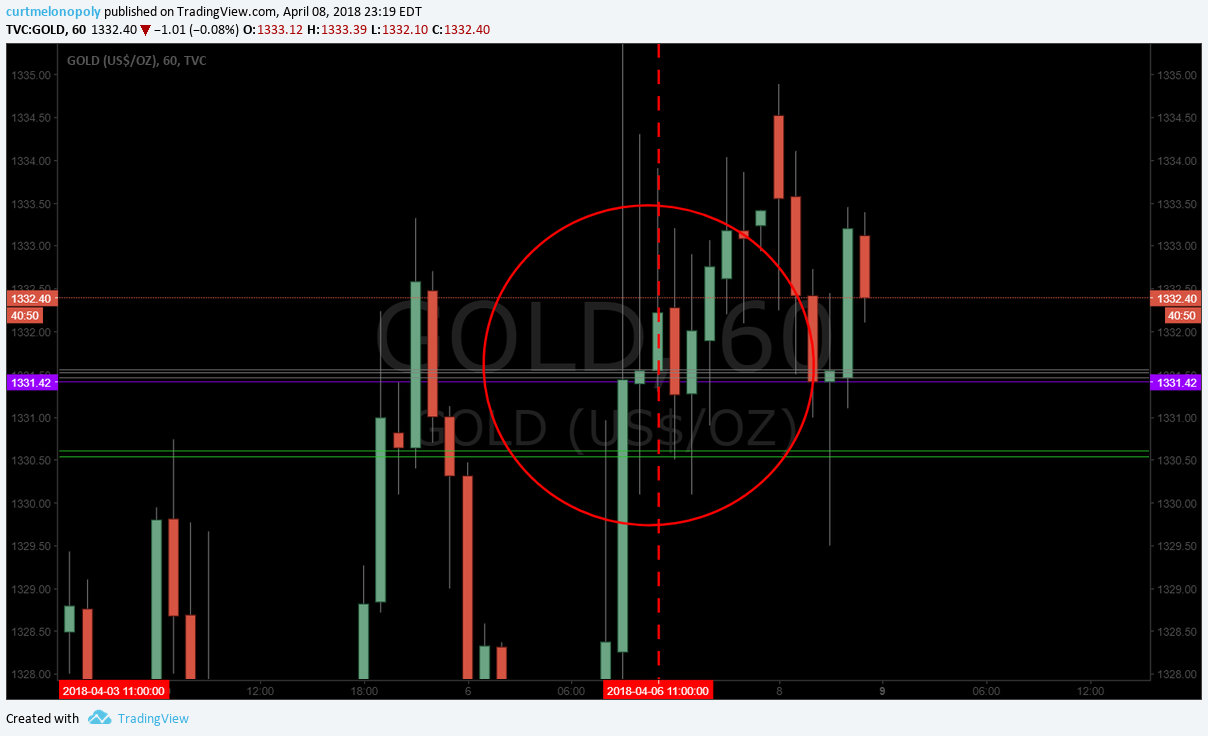
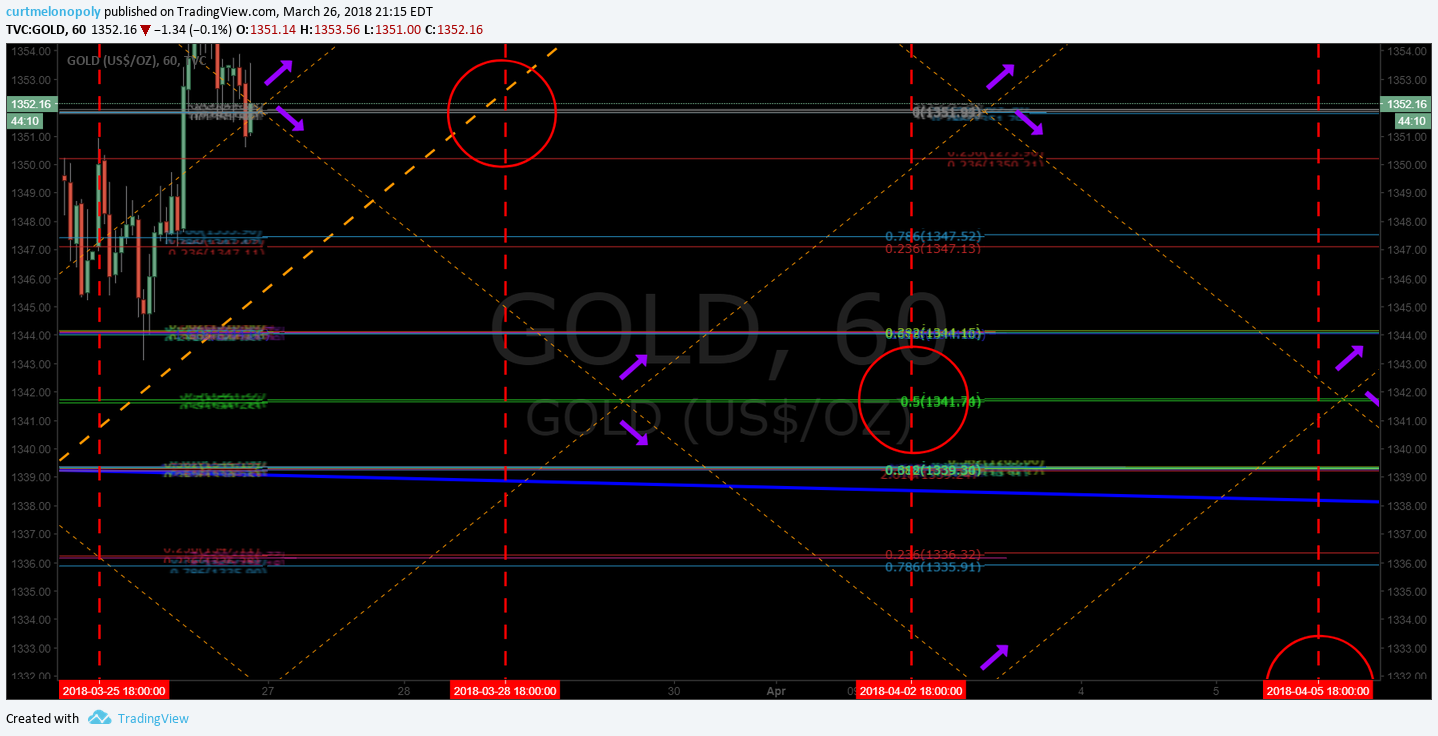
GOLD $GC_F $GLD – Started long hedge position 1352.86 May 4 price target, 1385.86, 1315.05 1277.09 bearish scenario targets same date May 4.

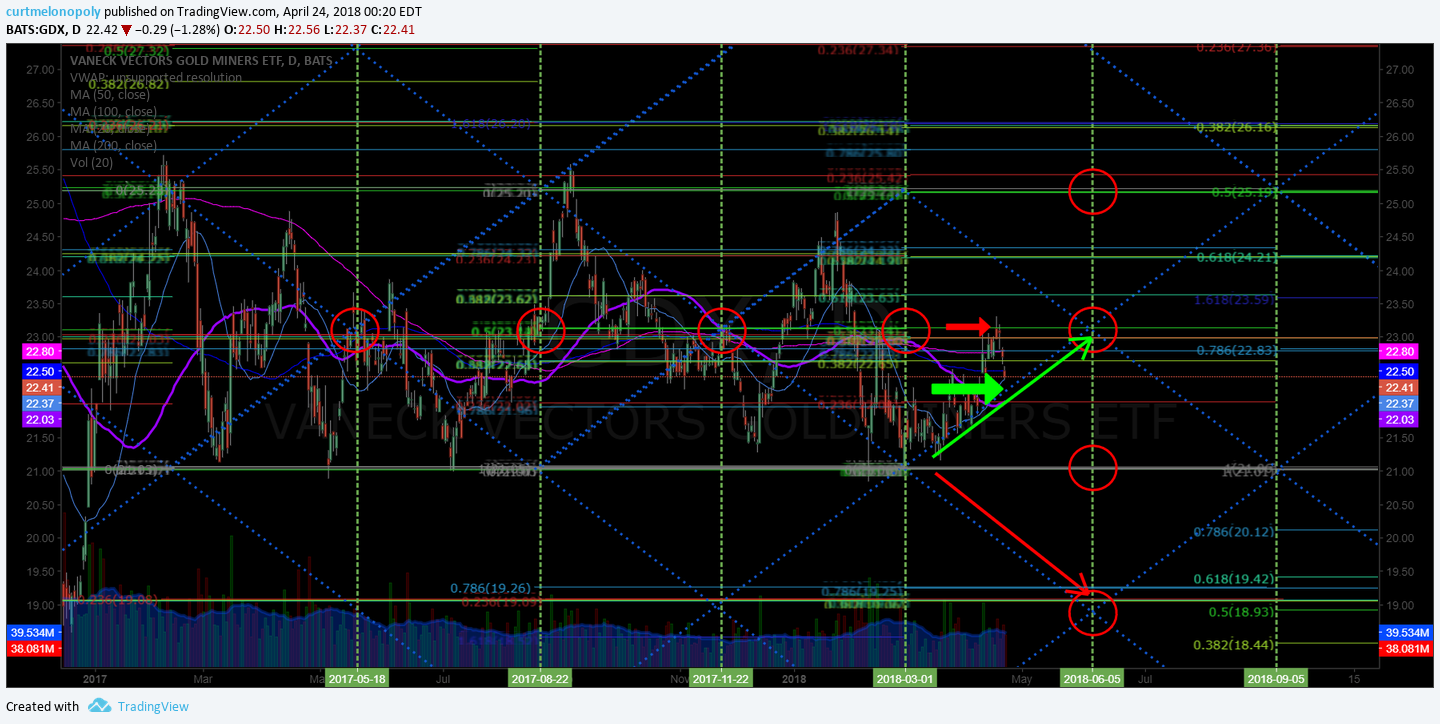
$GDX Gold Miners – Alert went out last night of support intra and it has bounced, resistance 23.14 22.97 22.80 22.65 June 4 time cycle targets 23.14 likely 21.07 bearish and 25.14 bullish 27.31 most bullish scenario.

Bitcoin $BTC – Swing trading model – How we knew the turn was in play, we alerted buy side and hit it near perfect. Trim in to resistance areas and add above. 13842.00 May 21 Bullish Target, 9891.90 moderately bullish, 5871.60 bearish. New up channel shown. On daytrading model resistance 9380.00 9878.90 April 28 price target.

$GOOGL – we nailed wash-out snap back and is now testing 200 MA support. 9855.00 support. 11035.00 price target July 2 bullish scenario.

$ATOS – Resistance pivot (primary) 5.38.

$SNAP over 15.75 targets 16.50.

$EVLV – in to the 200 MA and backed of on the daytrade.

$HEAR – charting has some structure. Target 17.80 200 MA weekly chart on bull side move.

$CHEK – Off halt wanted over 100 MA to 200 MA and left for coffee and boom it hit while I was away. Alerted in 8s and target on daytrade move 13s. Can’t get them all.

$MARA over 50 MA 1.75 targets 2.25 and over that 2.80 price target. Long term chart is junk.

$PRTA – traded on daytrade flat, wash-out snap – back trade, nailed the turn and then it came off. Will be watching very close the days going forward.

$ZDGE – Over 4.00 long side trade. I like the structure of the chart.

$TSLA – Caught this on the wash out snap back trade. 279.80 support really important area. 381.00 Nov 15 2018 price target.

$FB – Another wash-out snap back that went really well. Price targets hitting and structure of model has been perfect. Now came off after hit mid quad resistance.

Recent Trading Set-Up Review Webinars

Trade Set-ups $SPY, $NFLX, OIL, $WTI, $ESPR, $GOOGL, Bitcoin, $BTC, $FEYE, $AAPL and more.

Trading Set-Ups $SPY, Gold, $GC_F, $GDX, Bitcoin, $GOOGL, $EVLV, $HEAR, $CHEK, $MARA, $PRTA, $ZDGE

Trading Set-Ups $NETE, $TSG, $ETH Ethereum, $BTC Bitcoin, $TAN, $HEAR, $AMMJ, $SNAP, $VLRX

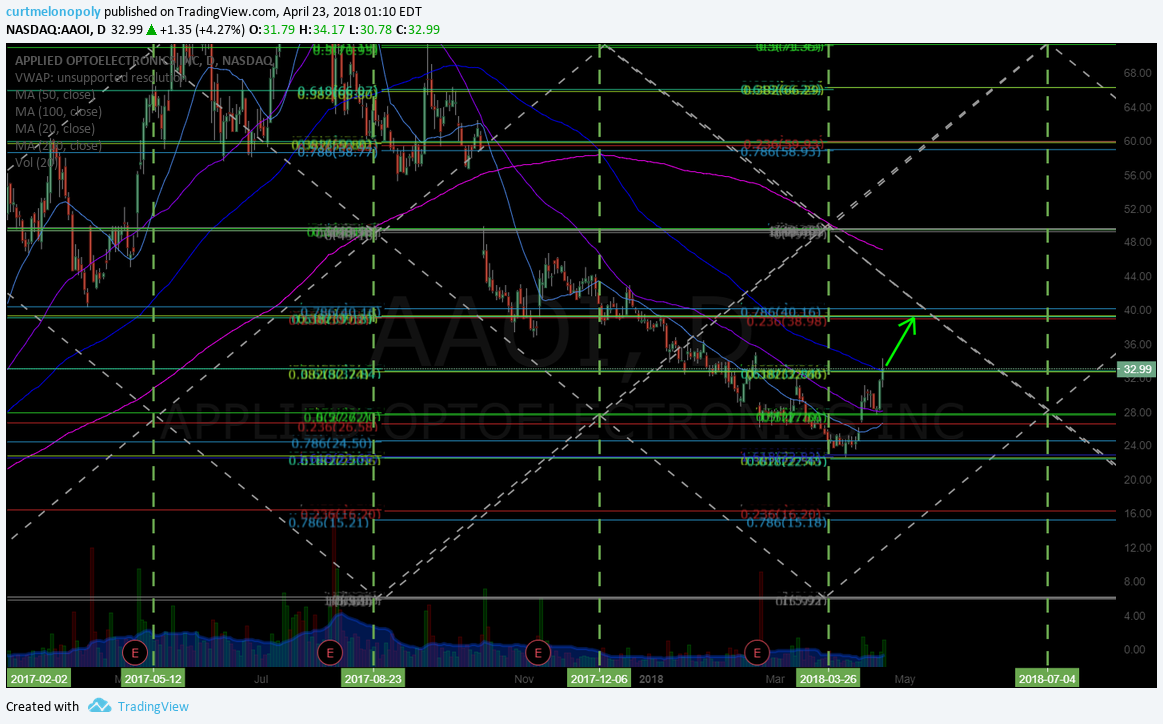
Trade Set-Ups OIL, $WTI, $SPY, $GOOGL, $FSLR, $AXP, $GREK, $CELG, $AAOI, $SDRL, $WFT

Register to free email list for trade set-ups, webinars, special events: https://compoundtrading.com/contact/

Website: https://compoundtrading.com

Free chat room: https://discord.gg/2HRTk6n

Subscribe: https://compoundtrading.com/overview-…

Twitter: https://twitter.com/CompoundTrading

Lead Trader: https://twitter.com/curtmelonopoly

Tradingview: https://www.tradingview.com/u/curtmel…

Facebook: https://www.facebook.com/compoundtrad…

StockTwits: https://stocktwits.com/compoundtrading

Email: https://[email protected]

Compound Trading Platform: Algorithm model charting for $SPY, $VIX, #OIL, #GOLD, #SILVER, #Crypto ($BTC Bitcoin, $ETH, $LTC, $XRP,) $DXY US Dollar and Swing Trading Newsletter. Live trading rooms for daytrading and oil traders. Private coaching and live alerts.


Read More
Rosie Gold Algorithm Chart Model Tues Apr 24 $GC_F $XAUUSD $GLD $UGLD $DGLD $GDX $NUGT $DUST

Rosie Gold Algorithm Chart Model Tues Apr 24 $GC_F $XAUUSD $GLD $UGLD $DGLD $GDX $NUGT $DUST

April 24, 2018July 2, 2018 RosietheAlgo GLDRosie the Gold Algo Chart Report$DGLD, $DUST, $GDX, $JDST, $JNUG, $NUGT, $UGLD, $XAUUSD, Algorithm, Chart, GLD, Gold, Miners, Rosie, Trading

Rosie the Gold Algorithm Model Charting Update Tuesday April 24, 2018 #GOLD $GC_F $XAUUSD $GLD, $UGLD, $DGLD with Gold Miner Observations: $GDX, $GDXJ ($NUGT, $DUST, $JDST, $JNUG)

Good day! My name is Rosie the Gold Algo. Welcome to my new member edition Gold trade report for Compound Trading.

Like EPIC our Oil Algorithm chart model, I am an algorithm chart model in development and trader testing for coding phase to be used as an intelligent assistant for our traders (not HFT). My charting model is specifically suitable for the use and purpose of Gold and Gold Miner related.

The charting models are best used decision to decision. In other words, each line on the algorithmic model charts are support and resistance. As trade progresses, weighing algorithmic charting model against conventional charting observations provides an edge over using only conventional charts.

If you need assistance at anytime contact my developers at [email protected].

Updates:

The charting below for Gold now has prospective channel support and resistance, considerable wider time frame quad walls highlighted (thicker orange dotted lines) and key channel direction decision areas noted with purple arrows.

How to Use the Charting Model:

How to Use ROSIE Gold Algorithm: #GOLD, $GLD, $XAUUSD, $GDX, $GDXJ, $NUGT, $DUST, $JNUG, $JDST

Gold / Gold Miner Trade Coaching

Users of this algorithm model charting may opt for private one-on-one coaching with our lead trader and / or an experienced trader that has worked under our lead trader.

On our website there are standard one-on-one online coaching packages you can order (coaching via Skype) or you can request a customized package (reflecting the time you are wanting to invest in your learning). 

To request a custom package most suited to your needs email us at [email protected] or click here for a standard private trade coaching package. Other options for coaching include online webinars for members (from time to time), private on location and in-person coaching sessions at our new trading location(s) and organized trading conference events. 

Primary Trade Indications:

Live Twitter Alert Feed for Gold / Miner Trades: @GoldAlerts_CT

Gold Trade Buy / Sell Short Term Swing Triggers

For short term trading the following are support and resistance areas for trade that can be used as buy / sell triggers for Gold.

1300.96

1311.07

1321.30

1331.51

1341.61

1351.86

1362.03

1372.72

1383.43

1384.79

The primary method of trade our traders are reporting works with the most predictability is to wait for Gold to breach the trading range (grey lines marked with arrows) up or down and then have it confirm as it leaves the corresponding trading quadrant to the up or downside. See video above.

As it is a model in development, if you find more predictable methods please report same.

Resistance and Support Clusters: Blue and Yellow horizontal (may be sloped) lines (marked with arrows). The thicker they are the more significant they are. Blue are conventional indicators and Yellow are calculated historical algorithmic points of significance. If the cluster is significant our charting techs will shade the area in white to bring this to your attention. The most recent cluster has proven to be significant resistance in recent trade.

Trading Range: Grey Lines (marked with grey arrows). Trade above or below creates bias and bias is confirmed to a high probability when trade then leaves a quadrant (geometric diamond shape formed with diagonal Fib trend lines for time – frame) after gaining or losing a trading range horizontal support / resistance line (grey horizontal line).

Quadrants: Diagonal Orange Lines that form diamond shapes. Based on diagonal Fibonacci trend lines act as important support and resistance. The wider the time frame the thicker the line.

Channel Decisions: Purple arrows note critical uptrend and downtrend channel decisions.

Fibonacci Support and Resistance: Horizontal lines on charting (various colors).

Targets: Red circles on charting. The least of the indicators and should be used for observation purpose only. The targets are in very early stage development / testing. Two are provided for each quadrant time frame – the upper scenario targets should be considered if trend is up and likewise for the lower. Only either are expected to hit (if at all – very low probability of a hit is expected at this point).

Conventional Charting: All decisions should be weighed against conventional charting (as may be provided below also).

Gold Algorithm Live Charting Link: 

Click on share button bottom right (beside flag) and then click on “Make it Mine”.

Gold Live Chart Link April 23, 2018:

Current trade area. Rosie Gold Algorithm. April 23 1159 PM #Gold $GLD $GC_F $XAUUSD $NUGT $DUST

https://www.tradingview.com/chart/GOLD/BzhsZttZ-Current-trade-area-Rosie-Gold-Algorithm-April-23-1159-PM-Gold/

Gold, trading, chart, Algorithm, Rosie
Current trade area. Rosie Gold Algorithm. April 23 1159 PM #Gold $GLD $GC_F $XAUUSD $NUGT $DUST

Gold down channel scenario. Rosie Gold Algorithm. April 23 1156 PM #Gold $GLD $GC_F $XAUUSD $NUGT $DUST

Gold, down, channel, scenario, chart
Gold down channel scenario. Rosie Gold Algorithm. April 23 1156 PM #Gold $GLD $GC_F $XAUUSD $NUGT $DUST

Gold up channel scenario. Rosie Gold Algorithm. April 23 1155 PM #Gold $GLD $GC_F $XAUUSD $NUGT $DUST

Gold, up, channel, chart
Gold up channel scenario. Rosie Gold Algorithm. April 23 1155 PM #Gold $GLD $GC_F $XAUUSD $NUGT $DUST

Conventional Charting Considerations:

April 24 – Gold 0.33% lost 50 MA but bullish structure still in play. #Gold #XAUUSD $GC_F $GLD

https://www.tradingview.com/chart/GOLD/8tCBgGWn-Gold-lost-50-MA-but-bullish-structure-in-play-Gold-Notes/

Gold, chart, bullish
Gold lost 50 MA but bullish structure still in play. #Gold #XAUUSD $GC_F $GLD

Per previous;

WOW. Gold bulls continue to press upper resistance. Chart notes.

Gold technical reality has my “trader bias” in conflict. 

Gold -0.11% recent historical resistance has been a predictable short, however, a break upside is becoming more and more probable as this structure firms up and upside price targets in time cycle become more probable. 

MACD and Stochastic RSI are both still trending on the daily – this is bullish . 

May 4, 2018 time / price cycle peaks and the bullish targets on this daily chart model are 1352.00 1387.00 and most bullish scenario 1420.00. 

There is lots of room to upside forming the algorithmic model charting channel also. The top of the prospective upside channel is wayyyy up there. This is important. 

In summary…. this chart structure of Gold is forming a significant risk reward advantage to the bullish side. 

I am personally (trader bias) slanted to bearish , but the chart says bullish . Primarily because of symmetry and structure. 

Trade price, not opinion. 

https://www.tradingview.com/chart/GOLD/CC40Zior-WOW-Gold-bulls-continue-to-press-upper-resistance-Chart-notes/

GOLD, resistance, chart
Gold bulls continue to press the upper resistance points on daily chart model. #Gold $GLD $GC_F $XAUUSD $NUGT $DUST

Per previous;

Gold came off again at historical resistance for predictable short. target June 4 1320.00 area. #Gold $GLD $GC_F

If the June 4 downside target doesn’t hit and Gold -0.04% turns up then look to upside in to 1350.00 area again for a decent short side trade set-up (historical resistance).

Trade is over 50 MA at this point on daily but 100 MA seems to be recent support area (generally).

Also MACD Stoch RSI and SQZMOM are moderately flat so this looks like a consolidation area near term.

https://www.tradingview.com/chart/GOLD/IcE7fVql-Historical-resistance-hit-again-Predictable-short-Chart-Notes/

Gold, resistance, chart, daily
Gold came off again at historical resistance for predictable short. target June 4 1320.00 area. #Gold $GLD $GC_F

Gold Miner $GDX:

April 24 – $GDX came off at mid quad resistance as thought. Add long or enter long at quad TL line support if it holds.

https://www.tradingview.com/chart/GDX/VcYeYEEm-GDX-came-off-at-mid-quad-resistance-as-thought-Add-long-or-ent/

$GDX, chart, resistance, support
$GDX came off at mid quad resistance as thought. Add long or enter long at quad TL line support if it holds.

Per recent;

$GDX Gold miner trading near mid quad resistance test and perfectly on way to price target. $NUGT $DUST $JNUG $JDST

https://www.tradingview.com/chart/GDX/vsFoQRJA-GDX-Gold-miner-trading-near-mid-quad-resistance-test-and-perfec/

$GDX, Gold, Miner, Chart, $DUST, $NUGT
$GDX Gold miner trading near mid quad resistance test and perfectly on way to price target. $NUGT $DUST $JNUG $JDST

Per recent;

$GDX 50 MA test, structure in play – one of the cleanest, easiest trades on the market $NUGT $DUST $JDST $JNUG $GLD

https://www.tradingview.com/chart/GDX/xqvoPTby-50-MA-Test-Structure-in-Play-Top-10-Easiest-Trades-See-Notes/

No trading is easy, but I’m sure you get my point – the symmetry, structure and support and resistance points in this trade set-up in Gold -0.05% Miners certainly helps a trader plan each trade in this.

GDX 0.46% is setting up for an excellent long side bias price target trade in to time price cycle peak June 5 (red circles on chart are the preferred price targets as trade reflects – trade in direction of most appropriate target).

Gold -0.05% 0.56% miners continue to bounce off previous (historical) support area with predictability. The trend (or history in this instance) is your friend.

Price is currently following the diagonal uptrend quad trading range for this time cycle upward near perfect along quad wall support structure (blue dotted diagonal) on the algorithmic trading model chart.

A long near the support (previous bounce area of 21.00) and trimming near 23.00 has been a great trade and there’s no reason to change my trading plan unless something structurally changes in the charting / trade.

THE ONE IMPORTANT note in recent trade is that we did fail the upside 50 MA test on the daily chart …. but this could break upside soon. SO WATCH THE 50 MA VERY CLOSELY and trade accordingly. Failing 50 MA is bearish until it’s not. Upside break likely rockets trade north, so at this point I am long bias.

If 50 MA test fails I will be looking for long side after next bounce again in to the model structure.

Per recent;

$GDX Gold miners once again bouncing at the recent support.

https://www.tradingview.com/chart/GDX/rGrPWcfs-GDX-Gold-miners-once-again-bouncing-at-the-recent-support/

$GDX, chart
$GDX Gold miners once again bouncing at the recent support.

Per recent;

Gold Miners $GDX break down of recent monthly lows possible here in to lower target. $NUGT $DUST $JDST $JNUG

https://www.tradingview.com/chart/GDX/2qXL8Us8-Gold-Miners-GDX-break-down-of-recent-monthly-lows-possible-here/

GDX, Gold, Miners, Chart, Targets
Gold Miners $GDX break down of recent monthly lows possible here in to lower target. $NUGT $DUST $JDST $JNUG

Recent Gold Price Targets:

Gold price target April 6 hit perfect to time and price provided on report 14 days prior. $GC_F $GLD $XAUUSD $DUST $NUGT

Gold, price target, algorithm
Gold price target April 6 hit perfect to time and price provided on report 14 days prior. $GC_F $GLD $XAUUSD $DUST $NUGT

Gold price target 1800 Sun lined up to price target time and price provided on report 6 days prior. $GC_F $GLD $XAUUSD $DUST $NUGT

Gold, price, target, hit, algorithm
Gold price target 1800 Sun lined up to price target time and price provided on report 6 days prior. $GC_F $GLD $XAUUSD $DUST $NUGT

Gold price target 1800 Mar 4 hit perfect to time and price provided on report 6 days prior. $GC_F $GLD $XAUUSD $DUST $NUGT

Gold, algorithm, price, target
Gold price target 1800 Mar 4 hit perfect to time and price provided on report 6 days prior. $GC_F $GLD $XAUUSD $DUST $NUGT

Gold price target 1800 Feb 4 hit perfect to time and price provided on report 7 days prior. $GC_F $GLD $XAUUSD $DUST $NUGT

Gold, algorithm, price, target, hit
Gold price target 1800 Feb 4 hit perfect to time and prce provided on report 7 days prior. $GC_F $GLD $XAUUSD $DUST $NUGT

Recent Gold and Gold Miner Trade Alerts:

Alert – Gold long side bias trade set-up trading intra 1346.18 PT’s on chart. Trim in to each resistance & add above.

Alert – Gold long side bias trade set-up trading intra 1346.18 PT’s on chart. Trim in to each resistance & add above.

https://twitter.com/goldalerts_ct/status/986515923657019393

Gold, long, trade
Alert – Gold long side bias trade set-up trading intra 1346.18 PT’s on chart. Trim in to each resistance & add above.

$GDX long side trade trim bias now in to resistance at 23.14 and add above long for next PT 24.21

https://twitter.com/goldalerts_ct/status/984834434015821824

$GDX long side trade trim bias now in to resistance at 23.14 and add above long for next PT 24.21

https://twitter.com/goldalerts_ct/status/984834434015821824

$GDX near mid quad res today – trim longs there and add above on break for 25.19 PT June 5. https://www.tradingview.com/chart/GDX/iriVmaBR-GDX-near-mid-quad-res-today-trim-longs-there-and-add-above-on/ …

https://twitter.com/goldalerts_ct/status/984215137010757632

Gold Trading Plan

Gold trading plan. Long side alert 405 AM – 18 Apr 2018 at green arrow 1346.18 trading 1326.50 intra. Fails at red arrow. Hold. Hedge.

Gold, trading, plan, long
Gold trading plan. Long side alert 405 AM – 18 Apr 2018 at green arrow 1346.18 trading 1326.50 intra. Fails at red arrow. Hold. Hedge.

Will add under 1321.33, 1311.86, 1300.93, expect at latest bounce 1293.51 and add there.

Trading, plan, Gold, adds
Will add under 1321.33, 1311.86, 1300.93, expect at latest bounce 1293.51 and add there.

Major support pivot in the 1293.51 area of Gold Algorithm Model. #Gold #trading #Algorithm #Chart

Gold, support, chart
Major support pivot in the 1293.51 area of Gold Algorithm Model. #Gold #trading #Algorithm #Chart

Green triangle completion of significant time cycle in Gold and support area (inverse apex). Significant buy zone if trade gets there.

Gold, time, price, cycle, chart
Green triangle completion of significant time cycle in Gold and support area (inverse apex). Significant buy zone if trade gets there.

Bullish scenario 1367.80 May 1 is top of quad in current time cycle. Unlikely but worth note for major resistance trims.

Gold, resistance, chart
Bullish scenario 1367.80 May 1 is top of quad in current time cycle. Unlikely but worth note for major resistance trims.

All the best with your trades and look forward to seeing you in the room!

Rosie the Gold Algo

Tweets by ROSIEtheAlgo

Article Topics: Rosie, Gold, Algorithm, Chart, Trading, Gold, $XAUUSD, $GOLD, $GLD, $UGLD, $DGLD, Miners, $GDX, $NUGT, $DUST, $JDST, $JNUG

Read More
PreMarket Trading Plan Mon Apr 23: $AAOI, $SHLD, $AGN, Rusal sanctions, #earnings, Bitcoin, SPY, OIL, Gold, Silver, USD

PreMarket Trading Plan Mon Apr 23: $AAOI, $SHLD, $AGN, Rusal sanctions, #earnings, Bitcoin, SPY, OIL, Gold, Silver, USD

April 23, 2018May 20, 2018 Curt MelonopolyTrading Plan$AAOI, $AGN, $SHLD, earnings, Gold, Oil, Plan, Premarket, Rusal sanctions, Silver, SPY, Stocks, Trading, USD, Watchlist

Compound Trading Chat Room Stock Trading Plan and Watch List Monday April 23, 2018: $AAOI, $SHLD, $AGN, Rusal sanctions, #earnings, SP500, $SPY, $BTC, Bitcoin, Gold, $GLD, $GDX, OIL, $WTI, $USOIL, Volatility, $VIX , Silver, $SLV, US Dollar Index, $DXY … more.

Welcome to the morning Wall Street trading day session at Compound Trading!

Notices:

What’s New at Compound Trading April / May 2018. https://compoundtrading.com/whats-new-at-compound-trading-april-may-2018/

Trade Coaching Boot Camp coming up – 2 spots left. https://compoundtrading.com/trade-coaching/

Preparation for Trade Coaching Boot Camp (for in person & online attendees) #FreedomTraders https://compoundtrading.com/preparation-for-trade-coaching-boot-camp-for-in-person-online-attendees-freedomtraders/

EPIC (Oil) Members Note: Weekly EIA Oil Trade webinar 10:30 AM ET Wed in oil trading room. Also, weekly webinar Wed 11:00 AM ET specific for Oil trade chart analysis, algorithm model use (swing and intra) and cover questions as needed. The videos will be available to EPIC members as a library online. (Previously EIA was in main trading room, but for this purpose we will meet in the oil trading room. The private oil trading Discord channel can also be used for live two way voice question and answer).

April Sale On Now! 10 Promo Codes Per Select Items Only! Ends Apr 30 or if Promo Code limit for a specific item has been reached (10). If there is no sale price beside item listed it is sold out. Click here for available Promo Codes. https://compoundtrading.com/overview-features/ … #trading #stockmarket

April Sale On Now! 10 Promo Codes Per Select Items Only! Ends Apr 30 or if Promo Code limit for a specific item has been reached (10). If there is no sale price beside item listed it is sold out. Click here for available Promo Codes. https://t.co/TFgZFPzOBt #trading #stockmarket

— Melonopoly (@curtmelonopoly) April 16, 2018

Notes in red text below are new comments entered specifically today (or recently important).

Live Trading Room Link:

http://compoundtrading1.clickmeeting.com/livetrading

Real-time Alerts for Oil, Gold, Swing Trading, Day Trading, Bitcoin are now available by following specific alert Twitter feeds.

Disclaimer / disclosure: Every subscriber must read this disclaimer.

Reporting and Next Gen Algorithms:

BE SURE to get in to each private Discord server specific to your subscription as many of the updates as we go forward will be posted in there. This includes the SWING TRADING platform also.

IF YOU NEED A LINK / INVITE email or DM us!

Connect with us on Discord.

https://twitter.com/CompoundTrading/status/880670140454637569

Recent Blog / Video / Social Posts: 

#BitcoinTrading 101: A Beginner’s Guide to Getting Started $BTCUSD $XBTUSD $BTC https://compoundtrading.com/bitcointrading-101-beginners-guide-getting-started-btcusd-xbtusd-btc/ …

https://twitter.com/CompoundTrading/status/927397024315662336

How to Use EPIC Oil Algorithm: $USOIL, $WTI, $CL_F, $USO, $UCO, $SCO, $UWT, $DWT, #OIL, #OOTT: http://youtu.be/hawVV31G9bg?a via @YouTube

https://twitter.com/CompoundTrading/status/889148655785177088

How to Use ROSIE Gold Algorithm: #GOLD, $GLD, $XAUUSD, $GDX, $GDXJ, $NUGT, $DUST, $JNUG, $JDST

https://twitter.com/CompoundTrading/status/889147527278333952

Recent Chart / Trade Set-Ups: 

See You Tube for other recent video posts. 

Great Trading Last Few Wks – Lets Keep Going! $RIG, #OIL, $SPY, $ETH, $BTC, $FB, $GOOGL, $BWA, $GDX more.

Swing Trade Set-Ups Abound $SPY, $NFLX, $DIS, $EOG, $WTIC, $USOIL, $BTC, $FB, $MARA, $LITE, $IOTS and more.

Special Swing Trade Report: #OIL, #GOLD, $NFLX, $SPY, $DIS, $GDX, $TSLA, $AAOI, $ESPR, $ITCI, $TAN, $CELG, $C and more.

$FB Facebook Long Set-Up Testing Buy Sell Trigger

Twitter Trading Plan $TWTR (Part two)

How to Trade $NFLX Move

How to Trade $MOMO Move

How to Trade $CHK Move

Twitter Trading Plan $TWTR (Part two)

How to Trade $NFLX Move

How to Trade $MOMO Move

How to Trade $CHK Move

#SwingTrading Midday Review – Compound Trading: $LTBR, $ANF, $MOMO, $APTO, $USOIL, $WTI, $BA, $NFLX

No Crystal Ball? Watch this… EPIC Oil Algorithm #EIA $USOIL $WTI #OIL $USO $CL_F #OOTT #Algo

#SwingTrading Midday Review: $NFLX $BTCUSD $SPY $VCEL $COT $DXY #GOLD $GLD $SLV $USOIL $WTI

Recent Educational Videos:

Want to learn how to trade stocks for consistent profit? Raw trading footage video library. https://www.youtube.com/channel/UCxmgJ3CfWHRBFFMpoHumZ8w … … #freedomtraders

Visit the Trading Educational and Analysis Play List at this Link on our YouTube Channel

Trading Plan (Buy, Hold, Sell) Watch Lists. Morning Momentum / Gap / News / PR / IPO / SEC Filings / Earnings Stocks on Watch: 

Sears Holding shares soar more than 12% in pre-market after CEO Lampert’s hedge fund offers to buy Kenmore, Sears’ real estate assets http://cnb.cx/2qRlseV

U.S. says may relieve Rusal sanctions if Deripaska divests control

Commodities Crumble After US Says It May Ease Rusal Sanctions https://t.co/5NHs8b8dju pic.twitter.com/5ARD9kwfqU

— zerohedge (@zerohedge) April 23, 2018

Per recent;

Per Apr 18 – Time to look at metals and crypto very closely… in prep for a short term retrace in our broad market bull move inflection that should peak soon and retrace for a rest. Crypto up or down has high ROE ROI #commodities #crypto #trading #algorithm #models $STUDY

Well that worked well… very profitable – after chart review I am bias some retrace is soon, I am short term trimming all positions here. We had over twenty long side alerted positions in this move. 100% winners. Timestamped. $STUDY #boomtown #premarket #trading #stockmarket https://t.co/HGHmFnnXsN

— Melonopoly (@curtmelonopoly) April 18, 2018

Market Observation:

As of 7:16 AM: US Dollar $DXY trading 90.26, Oil FX $USOIL ($WTI) trading 68.07, Gold $GLD trading 1327.31, Silver $SLV trading 16.93, $SPY trading 266.61, Bitcoin $BTC.X $BTCUSD $XBTUSD trading 8905.00 , and $VIX trading 17.02.

Recent Momentum Stocks to Watch: 

News: 

$PRTA. Prothena Corp. Halts Development of NEOD001 for AL Amyloidosis https://www.streetinsider.com/Corporate+News/Prothena+Corp.+%28PRTA%29+Halts+Development+of+NEOD001+for+AL+Amyloidosis/14081876.html ….

Pfizer receives CRL from FDA in response to proposed trastuzumab biosimilar $PFE http://dlvr.it/QQTGxC

Helios increases stake in MoviePass to 92%. https://seekingalpha.com/news/3347471-helios-increases-stake-moviepass-92-percent?source=feed_f … #premarket $HMNY

$BIIB New SPINRAZA Data Unveiled at #AAN18 Show Continued Improvement in Motor Function for Broad Age Range and Survival Benefit for Infants

Biohaven announces secondary endpoint results from Phase 3 clinical trials BHV3000-301 and 302 o… https://seekingalpha.com/news/3347479-biohaven-announces-secondary-endpoint-results-phase-3-clinical-trials-bhv3000minus-301-302?source=feed_f … #premarket $BHVN

$AKAO Highlights Plazomicin Presentations at European Congress of Clinical Microbiology and Infectious Diseases #ECCMID18

$MLNT Presents Results from VABOMERE TANGO II Trial at ECCMID 2018, Highlighting Outcomes in Vulnerable Patient Populations

Abeona Announces FDA Grants RMAT Designation to ABO-102 Gene Therapy in MPS IIIA $ABEO

$ORMP initiates 90-day pivotal dose-ranging Phase 2b HbA1c clinical study of oral insulin capsule ORMD-0801

$RARE Announces Filing and FDA Clearance of an IND Application for DTX401 a Gene Therapy for the Treatment of Glycogen Storage Disease Type Ia

Recent SEC Filings: 

Recent IPO’s:

$AGMH

$SPOT Morning Brief: Spotify rival Tencent Music preparing for IPO

Carbon Black prices its IPO at up to $136M https://seekingalpha.com/news/3347494-carbon-black-prices-ipo-136m?source=feed_f … #premarket $CBLK

Earnings: 

#earnings for the week

$AMZN $FB $AMD $MSFT $BA $TWTR $GOOGL $INTC $CAT $HAL $X $V $LMT $PYPL $ALK $XOM $ABBV $F $MMM $AMTD $VZ $T $FCX $WYNN $KMB $UPS $HAS $KO $CMCSA $RTN $AAL $WDC $BIIB $STM $QCOM $TXN $SBUX $GM $ALGN $LUV $UTX $NOK $CMG $CVX $SIRI

http://eps.sh/cal

#earnings for the week$AMZN $FB $AMD $MSFT $BA $TWTR $GOOGL $INTC $CAT $HAL $X $V $LMT $PYPL $ALK $XOM $ABBV $F $MMM $AMTD $VZ $T $FCX $WYNN $KMB $UPS $HAS $KO $CMCSA $RTN $AAL $WDC $BIIB $STM $QCOM $TXN $SBUX $GM $ALGN $LUV $UTX $NOK $CMG $CVX $SIRIhttps://t.co/r57QUKKDXL https://t.co/mmyg7TNe2o

— Melonopoly (@curtmelonopoly) April 21, 2018

Trade Set-up Alerts & Reports. Recent / Current Holds, Open and Closed Trades:

April 12 – Special Swing Report – $FB Facebook Long Set-Up Testing Buy Sell Trigger #swingtrading (Public Edition)

$FB Facebook long side trade from 153.40 Mar 28 buy side trigger now testing buy sell trigger 167.51. See chart notes. #swingtrading https://www.tradingview.com/chart/FB/968SzV2E-Facebook-New-Buy-Sell-Trigger-Here-Now-See-Chart-Notes/

Facebook, trade, setup, swingtrading, chart
$FB Facebook long side trade from 153.40 Mar 28 buy side trigger now testing buy sell tigger 167.51 #swingtrading

April 11 – Swing Trading in Review. $DIS, $C, $TSLA, $FB, $SPY, $GDX, $CELG https://compoundtrading.com/swing-trading-review-dis-c-tsla-fb-spy-gdx-celg/ …

https://twitter.com/CompoundTrading/status/983045524839452672

Charts and Chart Set-ups on Watch:

$AAOI over 32.90 targets 39.18 then 40.66. Watch for 50 MA overhead. (purple)

$AAOI, premarket, trading, plan, swing trading
$AAOI over 32.90 targets 39.18 then 40.66. Watch for 50 MA overhead. (purple)

$AGN I know it’s psychedelic but I think the time cycle is over soon and it reverses. Targets in report. #swingtrading https://www.tradingview.com/chart/AGN/7qp2fwSt-AGN-I-know-it-s-psychedelic-but-I-think-time-cycle-over-soon/ …

$AGN I know it's psychedelic but I think the time cycle is over soon and it reverses. Targets in report. #swingtrading https://t.co/eMNb1Uns34 pic.twitter.com/tMhCVtl3lA

— Swing Trading (@swingtrading_ct) April 23, 2018

$SPY ended week under 50 MA (bearish) however, MACD is still trending up and earnings season in full swing.

$SPY, daily, chart, MACD, 50 MA
$SPY ended week under 50 MA (bearish) however, MACD is still trending up and earnings season in full swing.

Per previous;

Silver touch to 100 MA on Weekly. Not saying it will go… but I wouldn’t want to be short. $SLV, $USLV, $DSLV

Silver, chart, premarket, trading, plan
Silver touch to 100 MA on Weekly. Not saying it will go… but I wouldn’t want to be short. $SLV, $USLV, $DSLV

100 Day Moving Average on Monthly Oil Chart logical price target. $USOIL $WTI #OIL $USO $UWT $DWT $CL_F #OOTT

https://www.tradingview.com/chart/USOIL/X2bXU0B8-100-Day-Moving-Average-on-Monthly-Oil-Chart-Logical-Price-Target/

OIL, Monthly, Chart, Trading, Plan, Premarket
100 Day Moving Average on Monthly Oil Chart logical price target. $USOIL $WTI #OIL $USO $UWT $DWT $CL_F #OOTT

Gold bulls continue to press the upper resistance points on daily chart model. #Gold $GLD $GC_F $XAUUSD $NUGT $DUST

GOLD, resistance, chart
Gold bulls continue to press the upper resistance points on daily chart model. #Gold $GLD $GC_F $XAUUSD $NUGT $DUST

$GDX Gold miner trading near mid quad resistance test and perfectly on way to price target. $NUGT $DUST $JNUG $JDST

$GDX, Gold, Miner, Chart, $DUST, $NUGT
$GDX Gold miner trading near mid quad resistance test and perfectly on way to price target. $NUGT $DUST $JNUG $JDST

$FEYE trade went as prescribed in last report – bias long to upside price target 22.32 June 27.

Feye, trading, plan, stocks, premarket
$FEYE trade went as prescribed in last report – bias long to upside price target 22.32 June 27.

Bitcoin: April 12 – Bullish indicator – price didn’t drop in to target this time. Not absolute indication of turn, but is a signal. $BTC

$BTC, chart, algorithm
Bullish indicator – price didn’t drop in to target this time. Not absolute indication of turn, but is a signal. $BTC

$CELG 86s to 91s off alert, buy sell trigger now. Chart Notes. https://www.tradingview.com/chart/CELG/gdKoFxEq-CELG-86s-to-91s-off-alert-buy-sell-trigger-now-Chart-Notes/ …

$CELG 86s to 91s off alert, buy sell trigger now. Chart Notes. https://t.co/5AWSJCxqA5 pic.twitter.com/9SaQX01K5U

— Swing Trading (@swingtrading_ct) April 8, 2018

$MXIM under 55.94 short side looks great. MACD turn. See Chart notes. #swingtrading https://www.tradingview.com/chart/MXIM/l2JjyH3X-MXIM-under-55-94-short-side-looks-great-MACD-turn-Chart-notes/ …

$MXIM under 55.94 short side looks great. MACD turn. See Chart notes. #swingtrading https://t.co/nNQfOV6rMr pic.twitter.com/4241zYTpX0

— Swing Trading (@swingtrading_ct) April 8, 2018

Litecoin will have to bounce near here if chart structure to remain in place. $LTC

If it doesn’t bounce near up channel support (yellow diagonal line) it could run another trading quad area down very easily.

See chart notes.

https://www.tradingview.com/chart/LTCUSD/NAsEtGUs-Litecoin-likely-bounce-near-here-for-chart-structure-Chart-notes/ …

Litecoin will have to bounce near here if chart structure to remain in place. $LTC

If it doesn't bounce near up channel support (yellow diagonal line) it could run another trading quad area down very easily.

See chart notes.https://t.co/SMEVswx4ha pic.twitter.com/EHM5S9DmcC

— Crypto the BTC Algo (@CryptotheAlgo) April 7, 2018

$TSLA also blasting here from yesterday’s alert🔥 In it to win it. #swingtrading

$TSLA also blasting here from yesterday's alert🔥 In it to win it. #swingtrading pic.twitter.com/JEefAyUROL

— Melonopoly (@curtmelonopoly) April 5, 2018

$DIS swing trade set-up from swing trading report yesterday blasting here🔥 Nice set-up. In it to win it. #swingtrading https://twitter.com/SwingAlerts_CT/status/981914928528416768/photo/1pic.twitter.com/muDQaThxP2

$DIS swing trade set-up from swing trading report yesterday blasting here🔥 Nice set-up. In it to win it. #swingtrading https://t.co/muDQaThxP2 pic.twitter.com/UXpvTgLpuo

— Melonopoly (@curtmelonopoly) April 5, 2018

Market Outlook, Market News and Social Bits From Around the Internet:

#5things
-U.S.-China want to talk
-10-year inches towards 3%
-it’s PMI day
-Markets slip
-Deals, earnings
https://www.bloomberg.com/news/articles/2018-04-23/five-things-you-need-to-know-to-start-your-day …

Beleaguered dollar bulls finally get a lifeboat as benchmark Treasury yields power towards 3 percent https://www.bloomberg.com/news/articles/2018-04-23/beleaguered-dollar-bulls-finally-get-lifeboat-as-yields-graze-3 … via @johnainger

Beleaguered dollar bulls finally get a lifeboat as benchmark Treasury yields power towards 3 percent https://t.co/eleYbYNVff via @johnainger pic.twitter.com/ltLuryFi96

— Bloomberg Markets (@markets) April 23, 2018

If you are new to our trading service you should review recent blog posts, the Compound Trading YouTube Channel and at minimum our algorithm Twitter feeds because they do tell a story in terms of the market and how the inflections of the market determine our day to day trading. You will notice the algorithmic modelling has been undeniably accurate with many time-frames (intra-day, weeks and months out) so I myself have learned to respect their math (they have taken me from a 60% hit rate to 80%+ in my trading – all publicly posted live trades).

Momentum Stocks (Market Open and Intra-Day):

I do trade morning momo stocks, but I do avoid much of the day trading risk (preferring to daytrade only what is structurally set-up also on the swing trade side and to my advantage in the algorithmic model charting). I often avoid the first 30 minutes (gap and go) and trade momentum stocks or structured (per explanation in previous sentence) stocks later in day after a wash-out looking for a snap-back trade that can possibly also become a strong swing or longer term trade that I can leg in to. Just prior to open and shortly after open I post momentum stocks to the trade chat room (and Twitter and Stocktwits if I have time).

Some of my Favorite Intra-day Trading Set-Ups:

(1) Momentum Stock Wash-Outs for Snap Back, (2) Bad News Wash-outs on Stocks with High Institutional Ownership, (3) Getting on the Right Side of a Trend Change and scaling in my position and (4) Our Algorithm Charting Model Set-Ups.

The momentum stocks (from previous days and morning trade) I continue to watch through the day for indicators that allow a trade.

Morning Stock Watch-Lists for my Favorite Set-Ups:

(1) Pre-Market Gainers Watch-List: $MDR $DPW $VVC $HEAR $DSLV $HMNY $ACIA $PHG $DWT $OILD $Z $JDST $ADMP $DUST $SCYX $MRK $DRIP $YNDX $SCO $JCP $KMB $TTM $IMBBY $UA $CAT $TWTR $SQ

(2) Pre-market Decliners Watch-List :

(3) Other Watch-List:

(4) Regular Algo Charting Watch-List: Gold $GC_F $GLD, Miners $GDX ($NUGT, $DUST, $JDST, $JNUG), Silver $SLV $SI_F ($USLV, $DSLV), Crude Oil FX: $USOIL $WTI ($UWT, $DWT, $USO, $UCO, $CL_F, $UWT, $DWT), Natural Gas $NG_F ($UGAZ, $DGAZ), S & P 500 $SPY $ES_F ($SPXL, $SPXS), US Dollar Index $DXY ($UUP), Volatility $VIX ($TVIX, $UVXY), $BTCUSD Bitcoin.

(5) Recent Upgrades:

$OKTA Raised to Buy From Hold by Canaccord Genuity

Wabtec upgraded to Buy on potential for transfomative GE deal at Stifel $WAB $GE http://dlvr.it/QQTGtY

Regions Financial $RF PT Raised to $20.75 at FIG Partners

Guggenheim Reiterates Buy on Kroger $KR Following C-Store Sale

Citi climbs aboard the Caterpillar train https://seekingalpha.com/news/3347470-citi-climbs-aboard-caterpillar-train?source=feed_f … #premarket $CAT

Stifel Remains Bullish on Amazon $AMZN Ahead of 1Q

TransUnion $TRU PT Raised to $74 at Stifel

Asure Software initiated at a 32% upside https://seekingalpha.com/news/3347465-asure-software-initiated-32-percent-upside?source=feed_f … #premarket $ASUR

Under Armour upgraded to Hold from Sell at Deutsche Bank $UAA $UA http://dlvr.it/QQT6qP

Coupa Software initiated at 29% upside https://seekingalpha.com/news/3347461-coupa-software-initiated-29-percent-upside?source=feed_f … #premarket $COUP

$WLL Raised to $45 at KeyBanc

$AA Raised to $70 at DB

$MRK GS adds to conviction buy list $73

$LDOS Raised to $80 at Citi

$HUBS Raised to $125 at Piper

$FSLR Raised to $90 at Roth

$RCI Raised to $51 at GS

$TYL Raised to $200 at DA Davidson

CenterPoint Energy to buy Vectren for $72/share https://seekingalpha.com/news/3347457-centerpoint-energy-buy-vectren-72-share?source=feed_f … #premarket $CNP $VVC

(6) Recent Downgrades:

Whirlpool Corporation $WHR PT Lowered to $184 at RBC Capital

RBC downgrades Paylocity on increasing competition https://seekingalpha.com/news/3347472-rbc-downgrades-paylocity-increasing-competition?source=feed_f … #premarket $PCTY

$ONCS PT lowered to $4 from $6 HCW

Stay tuned in Stock Chat Room for more pre-market stocks on watch.

Study:

For new readers, a review of our unlocked posts on our blog would help you get in to the story we are following with the securities listed in this newsletter.

Free scanners to find momentum stocks that you can easily review charts of for indicators that bring probability of your trade being successful up considerably. These are not useful for first 30 minute market open gap and go type plays (you need a good momentum scanner, level 2, and best to have hot-keys for the first 30 mins of gap and go trading)… but are very useful for intra day scalping and swing trading (start with trending stocks and then look at indicators intra for simple set-ups – study scan study scan study scan).

http://finviz.com/

https://finance.yahoo.com/screener/predefined/ec5bebb9-b7b2-4474-9e5c-3e258b61cbe6

http://www.highshortinterest.com/

http://www.gurufocus.com/short-stocks.php

http://www.3xetf.com/all/

http://www.etf.com/channels/gold-etfs

GL!

Curtis

Algorithm Twitter feeds can be found here: $BTC (@CryptotheAlgo) $WTI (@EPICtheAlgo), $VIX (@VexatiousVIX), $SPY (@FREEDOMtheAlgo), $GLD (@ROSIEtheAlgo), $SLV (@SuperNovaAlgo), $DXY (@DXYUSD_Index). Our Swing Trading Twitter feed is found here: https://twitter.com/swingtrading_ct.  Our lead trader Twitter feed is here @curtmelonopoly and lead tech developer @hundalSHS.

Article Topics: Premarket, Watchlist, Stocks, Trading, Plan, $AAOI, $SHLD, $AGN, Rusal sanctions, #earnings, SPY, OIL, Gold, Silver, USD 

Read More
PreMarket Trading Fri Apr 20: $AGMH, Trump, OIL, Bitcoin Cash, Silver, Gold, Crypto, SP500, $GE, $HON, $RF, $WFC, $MAT, $SKX

PreMarket Trading Fri Apr 20: $AGMH, Trump, OIL, Bitcoin Cash, Silver, Gold, Crypto, SP500, $GE, $HON, $RF, $WFC, $MAT, $SKX

April 20, 2018April 29, 2018 Curt MelonopolyTrading Plan$GE, $HON, $MAT, $RF, $SKX, $WFC, BITCOIN, Cash, Crypto, Gold, Oil, Plan, Premarket, Silver, SP500, Stocks, Trading, Trump, Watchlist

Compound Trading Chat Room Stock Trading Plan and Watch List Friday April 20, 2018: SP500, $SPY, $BTC, Bitcoin, Gold, $GLD, $GDX, OIL, $WTI, $USOIL, Volatility, $VIX , Silver, $SLV, US Dollar Index, $DXY … more.

Welcome to the morning Wall Street trading day session at Compound Trading!

Notices:

EPIC (Oil) Members Note: Weekly EIA Oil Trade webinar 10:30 AM ET Wed in oil trading room. Also, weekly webinar Wed 11:00 AM ET specific for Oil trade chart analysis, algorithm model use (swing and intra) and cover questions as needed. The videos will be available to EPIC members as a library online. (Previously EIA was in main trading room, but for this purpose we will meet in the oil trading room. The private oil trading Discord channel can also be used for live two way voice question and answer).

April Sale On Now! 10 Promo Codes Per Select Items Only! Ends Apr 30 or if Promo Code limit for a specific item has been reached (10). If there is no sale price beside item listed it is sold out. Click here for available Promo Codes. https://compoundtrading.com/overview-features/ … #trading #stockmarket

April Sale On Now! 10 Promo Codes Per Select Items Only! Ends Apr 30 or if Promo Code limit for a specific item has been reached (10). If there is no sale price beside item listed it is sold out. Click here for available Promo Codes. https://t.co/TFgZFPzOBt #trading #stockmarket

— Melonopoly (@curtmelonopoly) April 16, 2018

New link on site for those that couldn’t access previous for Trade Coaching Boot Camp coming up. (hopefully this works for ya) “Only 2 Spots Left! May 2018 Trade Coaching Boot Camp in Dominican Republic” #tradecoaching

New link on site for those that couldn't access previous. (hopefully this works for ya) "Only 2 Spots Left! May 2018 Trade Coaching Boot Camp in Dominican Republic" #tradecoaching https://t.co/2OExe4N4vS

— Melonopoly (@curtmelonopoly) April 20, 2018

Notes in red text below are new comments entered specifically today (or recently important).

Live Trading Room Link:

http://compoundtrading1.clickmeeting.com/livetrading

Real-time Alerts for Oil, Gold, Swing Trading, Day Trading, Bitcoin are now available by following specific alert Twitter feeds.

Disclaimer / disclosure: Every subscriber must read this disclaimer.

Reporting and Next Gen Algorithms:

BE SURE to get in to each private Discord server specific to your subscription as many of the updates as we go forward will be posted in there. This includes the SWING TRADING platform also.

IF YOU NEED A LINK / INVITE email or DM us!

Connect with us on Discord.

https://twitter.com/CompoundTrading/status/880670140454637569

Recent Blog / Video / Social Posts: 

#BitcoinTrading 101: A Beginner’s Guide to Getting Started $BTCUSD $XBTUSD $BTC https://compoundtrading.com/bitcointrading-101-beginners-guide-getting-started-btcusd-xbtusd-btc/ …

https://twitter.com/CompoundTrading/status/927397024315662336

How to Use EPIC Oil Algorithm: $USOIL, $WTI, $CL_F, $USO, $UCO, $SCO, $UWT, $DWT, #OIL, #OOTT: http://youtu.be/hawVV31G9bg?a via @YouTube

https://twitter.com/CompoundTrading/status/889148655785177088

How to Use ROSIE Gold Algorithm: #GOLD, $GLD, $XAUUSD, $GDX, $GDXJ, $NUGT, $DUST, $JNUG, $JDST

https://twitter.com/CompoundTrading/status/889147527278333952

Recent Chart / Trade Set-Ups: 

See You Tube for other recent video posts. 

Great Trading Last Few Wks – Lets Keep Going! $RIG, #OIL, $SPY, $ETH, $BTC, $FB, $GOOGL, $BWA, $GDX more.

Swing Trade Set-Ups Abound $SPY, $NFLX, $DIS, $EOG, $WTIC, $USOIL, $BTC, $FB, $MARA, $LITE, $IOTS and more.

Special Swing Trade Report: #OIL, #GOLD, $NFLX, $SPY, $DIS, $GDX, $TSLA, $AAOI, $ESPR, $ITCI, $TAN, $CELG, $C and more.

$FB Facebook Long Set-Up Testing Buy Sell Trigger

Twitter Trading Plan $TWTR (Part two)

How to Trade $NFLX Move

How to Trade $MOMO Move

How to Trade $CHK Move

Twitter Trading Plan $TWTR (Part two)

How to Trade $NFLX Move

How to Trade $MOMO Move

How to Trade $CHK Move

#SwingTrading Midday Review – Compound Trading: $LTBR, $ANF, $MOMO, $APTO, $USOIL, $WTI, $BA, $NFLX

No Crystal Ball? Watch this… EPIC Oil Algorithm #EIA $USOIL $WTI #OIL $USO $CL_F #OOTT #Algo

#SwingTrading Midday Review: $NFLX $BTCUSD $SPY $VCEL $COT $DXY #GOLD $GLD $SLV $USOIL $WTI

Recent Educational Videos:

Want to learn how to trade stocks for consistent profit? Raw trading footage video library. https://www.youtube.com/channel/UCxmgJ3CfWHRBFFMpoHumZ8w … … #freedomtraders

Visit the Trading Educational and Analysis Play List at this Link on our YouTube Channel

Trading Plan (Buy, Hold, Sell) Watch Lists. Morning Momentum / Gap / News / PR / IPO / SEC Filings / Earnings Stocks on Watch: 

Cryptowatch: Bitcoin cash & Ripple both surging 13% today as the major cryptocurrencies continue their comeback this month $BCH $XRP $BTC $ETH

Stocks making the biggest moves premarket: GE, HON, RF, WFC, MAT, SKX & more https://www.cnbc.com/2018/04/20/stocks-making-the-biggest-moves-premarket-ge-hon-rf-wfc-mat-skx-more.html?__source=sharebar|twitter&par=sharebar

Stocks making the biggest moves premarket: GE, HON, RF, WFC, MAT, SKX & more https://t.co/8kDe9AQyi7

— Melonopoly (@curtmelonopoly) April 20, 2018

Here’s what Bitcoin Cash fans are doing right now…

Here’s what Bitcoin Cash fans are doing right now… pic.twitter.com/6j9d6n7nE5

— CNBC's Fast Money (@CNBCFastMoney) April 20, 2018

Crypto Board🔥$BTC $XRP $ETH $LTC $XBT #Crypto

Crypto Board🔥$BTC $XRP $ETH $LTC $XBT #Crypto pic.twitter.com/SaT6f1Rt3i

— Melonopoly (@curtmelonopoly) April 20, 2018

Per Apr 18 – Time to look at metals and crypto very closely… in prep for a short term retrace in our broad market bull move inflection that should peak soon and retrace for a rest. Crypto up or down has high ROE ROI #commodities #crypto #trading #algorithm #models $STUDY

Well that worked well… very profitable – after chart review I am bias some retrace is soon, I am short term trimming all positions here. We had over twenty long side alerted positions in this move. 100% winners. Timestamped. $STUDY #boomtown #premarket #trading #stockmarket https://t.co/HGHmFnnXsN

— Melonopoly (@curtmelonopoly) April 18, 2018

Market Observation:

As of 7:45 AM: US Dollar $DXY trading 89.95, Oil FX $USOIL ($WTI) trading 67.92, Gold $GLD trading 1342.31, Silver $SLV trading 17.16, $SPY trading 268.77, Bitcoin $BTC.X $BTCUSD $XBTUSD trading 8539.00 , and $VIX trading 15.8.

Recent Momentum Stocks to Watch: 

News: $CLDX, $AGHM, $SQ (raise), $ABEO, $HEAR, $IZEA, $LLNW, $VXRT

$ABEO Abeona Therapeutics Receives Orphan Drug Designation in the European Union for ABO-202 Gene Therapy Program in Batten Disease

Deutsche Bank Reiterates Buy on Square $SQ Ahead of 1Q Release

Recent SEC Filings: 

Recent IPO’s: $AGMH 

Earnings:

#earnings scheduled for the week

$NFLX $BAC $GE $LRCX $GS $UNH $IBM $JNJ $CLF $MTB $ABT $MS $ISRG $PGR $CMA $PG $AA $BX $AXP $ASML $MLNX $HON $UAL $FRED $NUE $SLB $PIR$DGX $URI $GSM $CE $CSX $GWW $WM $SEAC $NTRS $PNFP $KEY $WTC $USB $OMC $SKX $TXT $ETFC

http://eps.sh/cal

#earnings scheduled for the week$NFLX $BAC $GE $LRCX $GS $UNH $IBM $JNJ $CLF $MTB $ABT $MS $ISRG $PGR $CMA $PG $AA $BX $AXP $ASML $MLNX $HON $UAL $FRED $NUE $SLB $PIR$DGX $URI $GSM $CE $CSX $GWW $WM $SEAC $NTRS $PNFP $KEY $WTC $USB $OMC $SKX $TXT $ETFChttps://t.co/r57QUKKDXL https://t.co/9agjWeri4f

— Melonopoly (@curtmelonopoly) April 16, 2018

Trade Set-up Alerts & Reports. Recent / Current Holds, Open and Closed Trades:

Premarket Oil Trade in Progress. Long side bias trade set up alert. Entry and price targets. Trim before resistance add above. FX $USOIL $WTI #OIL

Oil, trade, premarket, alerts, price, target
Long side bias trade set up alert. Entry and price targets. Trim before resistance add above. FX $USOIL $WTI #OIL

April 12 – Special Swing Report – $FB Facebook Long Set-Up Testing Buy Sell Trigger #swingtrading (Public Edition)

$FB Facebook long side trade from 153.40 Mar 28 buy side trigger now testing buy sell trigger 167.51. See chart notes. #swingtrading https://www.tradingview.com/chart/FB/968SzV2E-Facebook-New-Buy-Sell-Trigger-Here-Now-See-Chart-Notes/

Facebook, trade, setup, swingtrading, chart
$FB Facebook long side trade from 153.40 Mar 28 buy side trigger now testing buy sell tigger 167.51 #swingtrading

April 11 – Swing Trading in Review. $DIS, $C, $TSLA, $FB, $SPY, $GDX, $CELG https://compoundtrading.com/swing-trading-review-dis-c-tsla-fb-spy-gdx-celg/ …

https://twitter.com/CompoundTrading/status/983045524839452672

Charts and Chart Set-ups on Watch:

Silver touch to 100 MA on Weekly. Not saying it will go… but I wouldn’t want to be short. $SLV, $USLV, $DSLV

Silver, chart, premarket, trading, plan
Silver touch to 100 MA on Weekly. Not saying it will go… but I wouldn’t want to be short. $SLV, $USLV, $DSLV

100 Day Moving Average on Monthly Oil Chart logical price target. $USOIL $WTI #OIL $USO $UWT $DWT $CL_F #OOTT

https://www.tradingview.com/chart/USOIL/X2bXU0B8-100-Day-Moving-Average-on-Monthly-Oil-Chart-Logical-Price-Target/

OIL, Monthly, Chart, Trading, Plan, Premarket
100 Day Moving Average on Monthly Oil Chart logical price target. $USOIL $WTI #OIL $USO $UWT $DWT $CL_F #OOTT

Gold bulls continue to press the upper resistance points on daily chart model. #Gold $GLD $GC_F $XAUUSD $NUGT $DUST

GOLD, resistance, chart
Gold bulls continue to press the upper resistance points on daily chart model. #Gold $GLD $GC_F $XAUUSD $NUGT $DUST

$GDX Gold miner trading near mid quad resistance test and perfectly on way to price target. $NUGT $DUST $JNUG $JDST

$GDX, Gold, Miner, Chart, $DUST, $NUGT
$GDX Gold miner trading near mid quad resistance test and perfectly on way to price target. $NUGT $DUST $JNUG $JDST

$FEYE trade went as prescribed in last report – bias long to upside price target 22.32 June 27.

Feye, trading, plan, stocks, premarket
$FEYE trade went as prescribed in last report – bias long to upside price target 22.32 June 27.

Bitcoin: April 12 – Bullish indicator – price didn’t drop in to target this time. Not absolute indication of turn, but is a signal. $BTC

$BTC, chart, algorithm
Bullish indicator – price didn’t drop in to target this time. Not absolute indication of turn, but is a signal. $BTC

$CELG 86s to 91s off alert, buy sell trigger now. Chart Notes. https://www.tradingview.com/chart/CELG/gdKoFxEq-CELG-86s-to-91s-off-alert-buy-sell-trigger-now-Chart-Notes/ …

$CELG 86s to 91s off alert, buy sell trigger now. Chart Notes. https://t.co/5AWSJCxqA5 pic.twitter.com/9SaQX01K5U

— Swing Trading (@swingtrading_ct) April 8, 2018

$MXIM under 55.94 short side looks great. MACD turn. See Chart notes. #swingtrading https://www.tradingview.com/chart/MXIM/l2JjyH3X-MXIM-under-55-94-short-side-looks-great-MACD-turn-Chart-notes/ …

$MXIM under 55.94 short side looks great. MACD turn. See Chart notes. #swingtrading https://t.co/nNQfOV6rMr pic.twitter.com/4241zYTpX0

— Swing Trading (@swingtrading_ct) April 8, 2018

Litecoin will have to bounce near here if chart structure to remain in place. $LTC

If it doesn’t bounce near up channel support (yellow diagonal line) it could run another trading quad area down very easily.

See chart notes.

https://www.tradingview.com/chart/LTCUSD/NAsEtGUs-Litecoin-likely-bounce-near-here-for-chart-structure-Chart-notes/ …

Litecoin will have to bounce near here if chart structure to remain in place. $LTC

If it doesn't bounce near up channel support (yellow diagonal line) it could run another trading quad area down very easily.

See chart notes.https://t.co/SMEVswx4ha pic.twitter.com/EHM5S9DmcC

— Crypto the BTC Algo (@CryptotheAlgo) April 7, 2018

$TSLA also blasting here from yesterday’s alert🔥 In it to win it. #swingtrading

$TSLA also blasting here from yesterday's alert🔥 In it to win it. #swingtrading pic.twitter.com/JEefAyUROL

— Melonopoly (@curtmelonopoly) April 5, 2018

$DIS swing trade set-up from swing trading report yesterday blasting here🔥 Nice set-up. In it to win it. #swingtrading https://twitter.com/SwingAlerts_CT/status/981914928528416768/photo/1pic.twitter.com/muDQaThxP2

$DIS swing trade set-up from swing trading report yesterday blasting here🔥 Nice set-up. In it to win it. #swingtrading https://t.co/muDQaThxP2 pic.twitter.com/UXpvTgLpuo

— Melonopoly (@curtmelonopoly) April 5, 2018

Market Outlook, Market News and Social Bits From Around the Internet:

#5Things people in markets are talking about now:
-3 percent?
-OPEC finds reasons to keep cuts
-Dovish Carney
-Markets quiet
-Coming up…
https://bloom.bg/2HMXA3o

#5Things people in markets are talking about now:
-3 percent?
-OPEC finds reasons to keep cuts
-Dovish Carney
-Markets quiet
-Coming up…https://t.co/B02EltPY4b pic.twitter.com/XRorMDu36o

— Bloomberg (@business) April 20, 2018

If you are new to our trading service you should review recent blog posts, the Compound Trading YouTube Channel and at minimum our algorithm Twitter feeds because they do tell a story in terms of the market and how the inflections of the market determine our day to day trading. You will notice the algorithmic modelling has been undeniably accurate with many time-frames (intra-day, weeks and months out) so I myself have learned to respect their math (they have taken me from a 60% hit rate to 80%+ in my trading – all publicly posted live trades).

Momentum Stocks (Market Open and Intra-Day):

I do trade morning momo stocks, but I do avoid much of the day trading risk (preferring to daytrade only what is structurally set-up also on the swing trade side and to my advantage in the algorithmic model charting). I often avoid the first 30 minutes (gap and go) and trade momentum stocks or structured (per explanation in previous sentence) stocks later in day after a wash-out looking for a snap-back trade that can possibly also become a strong swing or longer term trade that I can leg in to. Just prior to open and shortly after open I post momentum stocks to the trade chat room (and Twitter and Stocktwits if I have time).

Some of my Favorite Intra-day Trading Set-Ups:

(1) Momentum Stock Wash-Outs for Snap Back, (2) Bad News Wash-outs on Stocks with High Institutional Ownership, (3) Getting on the Right Side of a Trend Change and scaling in my position and (4) Our Algorithm Charting Model Set-Ups.

The momentum stocks (from previous days and morning trade) I continue to watch through the day for indicators that allow a trade.

Morning Stock Watch-Lists for my Favorite Set-Ups:

(1) Pre-Market Gainers Watch-List: $AGMH, $ERIC $VXRT $IONS $LLNW $PF $DPW $GE $MSCC $XNET $EBIO $RIGL $NOK $OPGN $HEAR $INFY $SBGL $TWTR $DWT  

(2) Pre-market Decliners Watch-List :

(3) Other Watch-List:

(4) Regular Algo Charting Watch-List: Gold $GC_F $GLD, Miners $GDX ($NUGT, $DUST, $JDST, $JNUG), Silver $SLV $SI_F ($USLV, $DSLV), Crude Oil FX: $USOIL $WTI ($UWT, $DWT, $USO, $UCO, $CL_F, $UWT, $DWT), Natural Gas $NG_F ($UGAZ, $DGAZ), S & P 500 $SPY $ES_F ($SPXL, $SPXS), US Dollar Index $DXY ($UUP), Volatility $VIX ($TVIX, $UVXY), $BTCUSD Bitcoin.

(5) Recent Upgrades: $TSCO $PBCT $ADS $MAC $ASB $E $UGI $SBNY $SYNT $LFC $WLL $TWTR $NAP $MAC $OMF $JHG $ASB, $WWE. $STLD. $AMZN

(6) Recent Downgrades: $PG $CHD $TEAM $PM $DHT $NNA $SKX $MRTN $OLN, $NKE, $QVRO, $PIR, $SKX, $PM


Stay tuned in Stock Chat Room for more pre-market stocks on watch.

Study:

For new readers, a review of our unlocked posts on our blog would help you get in to the story we are following with the securities listed in this newsletter.

Free scanners to find momentum stocks that you can easily review charts of for indicators that bring probability of your trade being successful up considerably. These are not useful for first 30 minute market open gap and go type plays (you need a good momentum scanner, level 2, and best to have hot-keys for the first 30 mins of gap and go trading)… but are very useful for intra day scalping and swing trading (start with trending stocks and then look at indicators intra for simple set-ups – study scan study scan study scan).

http://finviz.com/

https://finance.yahoo.com/screener/predefined/ec5bebb9-b7b2-4474-9e5c-3e258b61cbe6

http://www.highshortinterest.com/

http://www.gurufocus.com/short-stocks.php

http://www.3xetf.com/all/

http://www.etf.com/channels/gold-etfs

GL!

Curtis

Algorithm Twitter feeds can be found here: $BTC (@CryptotheAlgo) $WTI (@EPICtheAlgo), $VIX (@VexatiousVIX), $SPY (@FREEDOMtheAlgo), $GLD (@ROSIEtheAlgo), $SLV (@SuperNovaAlgo), $DXY (@DXYUSD_Index). Our Swing Trading Twitter feed is found here: https://twitter.com/swingtrading_ct.  Our lead trader Twitter feed is here @curtmelonopoly and lead tech developer @hundalSHS.

Article Topics: Premarket, Watchlist, Stocks, Trading, Plan,  Trump, OIL, Bitcoin, Cash, SILVER, GOLD, Crypto, SP500, $GE, $HON, $RF, $WFC, $MAT, $SKX

Read More
PreMarket Trading Thurs Wed Apr 19: OIL, $WTI, $USOIL, GOLD, $GLD, Crypto, $BTC, $SPY more.

PreMarket Trading Thurs Wed Apr 19: OIL, $WTI, $USOIL, GOLD, $GLD, Crypto, $BTC, $SPY more.

April 19, 2018April 29, 2018 Curt MelonopolyTrading Plan$BTC, $USOIL, $WTI, Crypto, GLD, Gold, Oil, Plan, Premarket, SPY, Stocks, Trading, Watchlist

Compound Trading Chat Room Stock Trading Plan and Watch List Thursday April 19, 2018: SP500, $SPY, $BTC, Bitcoin, Gold, $GLD, $GDX, OIL, $WTI, $USOIL, Volatility, $VIX , Silver, $SLV, US Dollar Index, $DXY … more.

Welcome to the morning Wall Street trading day session at Compound Trading!

Notices:

EPIC (Oil) Members Note: Weekly EIA Oil Trade webinar 10:30 AM ET Wed in oil trading room. Also, weekly webinar Wed 11:00 AM ET specific for Oil trade chart analysis, algorithm model use (swing and intra) and cover questions as needed. The videos will be available to EPIC members as a library online. (Previously EIA was in main trading room, but for this purpose we will meet in the oil trading room. The private oil trading Discord channel can also be used for live two way voice question and answer).

April Sale On Now! 10 Promo Codes Per Select Items Only! Ends Apr 30 or if Promo Code limit for a specific item has been reached (10). If there is no sale price beside item listed it is sold out. Click here for available Promo Codes. https://compoundtrading.com/overview-features/ … #trading #stockmarket

April Sale On Now! 10 Promo Codes Per Select Items Only! Ends Apr 30 or if Promo Code limit for a specific item has been reached (10). If there is no sale price beside item listed it is sold out. Click here for available Promo Codes. https://t.co/TFgZFPzOBt #trading #stockmarket

— Melonopoly (@curtmelonopoly) April 16, 2018

Details to our next Trading Boot Camp in May! We’re over 70% booked so don’t wait. 30% off on this session! And what a location! #tradecoaching #learntotrade

https://twitter.com/CompoundTrading/status/982706326454358017

Notes in red text below are new comments entered specifically today (or recently important).

Live Trading Room Link:

http://compoundtrading1.clickmeeting.com/livetrading

Real-time Alerts for Oil, Gold, Swing Trading, Day Trading, Bitcoin are now available by following specific alert Twitter feeds.

Disclaimer / disclosure: Every subscriber must read this disclaimer.

Reporting and Next Gen Algorithms:

BE SURE to get in to each private Discord server specific to your subscription as many of the updates as we go forward will be posted in there. This includes the SWING TRADING platform also.

IF YOU NEED A LINK / INVITE email or DM us!

Connect with us on Discord.

https://twitter.com/CompoundTrading/status/880670140454637569

Recent Blog / Video / Social Posts: 

#BitcoinTrading 101: A Beginner’s Guide to Getting Started $BTCUSD $XBTUSD $BTC https://compoundtrading.com/bitcointrading-101-beginners-guide-getting-started-btcusd-xbtusd-btc/ …

https://twitter.com/CompoundTrading/status/927397024315662336

How to Use EPIC Oil Algorithm: $USOIL, $WTI, $CL_F, $USO, $UCO, $SCO, $UWT, $DWT, #OIL, #OOTT: http://youtu.be/hawVV31G9bg?a via @YouTube

https://twitter.com/CompoundTrading/status/889148655785177088

How to Use ROSIE Gold Algorithm: #GOLD, $GLD, $XAUUSD, $GDX, $GDXJ, $NUGT, $DUST, $JNUG, $JDST

https://twitter.com/CompoundTrading/status/889147527278333952

Recent Chart / Trade Set-Ups: 

See You Tube for other recent video posts. 

Great Trading Last Few Wks – Lets Keep Going! $RIG, #OIL, $SPY, $ETH, $BTC, $FB, $GOOGL, $BWA, $GDX more.

Swing Trade Set-Ups Abound $SPY, $NFLX, $DIS, $EOG, $WTIC, $USOIL, $BTC, $FB, $MARA, $LITE, $IOTS and more.

Special Swing Trade Report: #OIL, #GOLD, $NFLX, $SPY, $DIS, $GDX, $TSLA, $AAOI, $ESPR, $ITCI, $TAN, $CELG, $C and more.

$FB Facebook Long Set-Up Testing Buy Sell Trigger

Twitter Trading Plan $TWTR (Part two)

How to Trade $NFLX Move

How to Trade $MOMO Move

How to Trade $CHK Move

Twitter Trading Plan $TWTR (Part two)

How to Trade $NFLX Move

How to Trade $MOMO Move

How to Trade $CHK Move

#SwingTrading Midday Review – Compound Trading: $LTBR, $ANF, $MOMO, $APTO, $USOIL, $WTI, $BA, $NFLX

No Crystal Ball? Watch this… EPIC Oil Algorithm #EIA $USOIL $WTI #OIL $USO $CL_F #OOTT #Algo

#SwingTrading Midday Review: $NFLX $BTCUSD $SPY $VCEL $COT $DXY #GOLD $GLD $SLV $USOIL $WTI

Recent Educational Videos:

Want to learn how to trade stocks for consistent profit? Raw trading footage video library. https://www.youtube.com/channel/UCxmgJ3CfWHRBFFMpoHumZ8w … … #freedomtraders

Visit the Trading Educational and Analysis Play List at this Link on our YouTube Channel

Trading Plan (Buy, Hold, Sell) Watch Lists. Morning Momentum / Gap / News / PR / IPO / SEC Filings / Earnings Stocks on Watch: 

Stocks making the biggest moves premarket: PG, BX, BBT, BK, FOXA, LUV, QCOM & more https://cnb.cx/2JartKz

Stocks making the biggest moves premarket: PG, BX, BBT, BK, FOXA, LUV, QCOM & more https://t.co/eh0xmDpkB8

— Melonopoly (@curtmelonopoly) April 19, 2018

Per Apr 18 – Time to look at metals and crypto very closely… in prep for a short term retrace in our broad market bull move inflection that should peak soon and retrace for a rest. Crypto up or down has high ROE ROI #commodities #crypto #trading #algorithm #models $STUDY

Well that worked well… very profitable – after chart review I am bias some retrace is soon, I am short term trimming all positions here. We had over twenty long side alerted positions in this move. 100% winners. Timestamped. $STUDY #boomtown #premarket #trading #stockmarket https://t.co/HGHmFnnXsN

— Melonopoly (@curtmelonopoly) April 18, 2018

Market Observation:

As of 7:45 AM: US Dollar $DXY trading 89.62, Oil FX $USOIL ($WTI) trading 69.43, Gold $GLD trading 1349.31, Silver $SLV trading 16.98, $SPY trading 270.39, Bitcoin $BTC.X $BTCUSD $XBTUSD trading 8200.00 , and $VIX trading 15.5.

Recent Momentum Stocks to Watch: 

News: 

$ARGS Reports Results of Interim Analysis of the ADAPT Trial and Announces Review of Strategic Alternative. Company to terminate the ADAPT study

$ARGS trading in the common stock to be transferred from Nasdaq to the OTC

$RXII RXi Pharmaceuticals Shares Up 9.9% After Hours As 13G From Intracoastal Capital Shows New 9.2% Stake $RXII https://pro.benzinga.com @benzinga

$ROKU – Hearing Needham Defending Stock Amid $AMZN, $BBY Partnership; Said Deal Eliminates Threat From Amazon In Other Stores As Deal With Best Buy Is Exclusive; Reiterates Buy, $50 Target

$BPTH Pre-Clinical Data Demonstrating Promising Potential of Prexigebersen as Treatment for Solid Tumors in Gynecologic Malignancies Presented at American Association for Cancer Research Annual Meeting

$KRYS KB103 Receives Orphan Medicinal Product Designation in Europe for Dystrophic Epidermolysis Bullosa

$ATNX Receives Orphan Drug Designation for Oraxol for the Treatment of Angiosarcoma

$SHPG Rejects Takeda’s $60 Billion Takeover Bid

XPO Logistics launches smart speaker tool https://seekingalpha.com/news/3346831-xpo-logistics-launches-smart-speaker-tool?source=feed_f … #premarket $XPO

Recent SEC Filings: 

Recent IPO’s:

Earnings:

#earnings scheduled for the week

$NFLX $BAC $GE $LRCX $GS $UNH $IBM $JNJ $CLF $MTB $ABT $MS $ISRG $PGR $CMA $PG $AA $BX $AXP $ASML $MLNX $HON $UAL $FRED $NUE $SLB $PIR$DGX $URI $GSM $CE $CSX $GWW $WM $SEAC $NTRS $PNFP $KEY $WTC $USB $OMC $SKX $TXT $ETFC

http://eps.sh/cal

#earnings scheduled for the week$NFLX $BAC $GE $LRCX $GS $UNH $IBM $JNJ $CLF $MTB $ABT $MS $ISRG $PGR $CMA $PG $AA $BX $AXP $ASML $MLNX $HON $UAL $FRED $NUE $SLB $PIR$DGX $URI $GSM $CE $CSX $GWW $WM $SEAC $NTRS $PNFP $KEY $WTC $USB $OMC $SKX $TXT $ETFChttps://t.co/r57QUKKDXL https://t.co/9agjWeri4f

— Melonopoly (@curtmelonopoly) April 16, 2018

Trade Set-up Alerts & Reports. Recent / Current Holds, Open and Closed Trades:

April 12 – Special Swing Report – $FB Facebook Long Set-Up Testing Buy Sell Trigger #swingtrading (Public Edition)

$FB Facebook long side trade from 153.40 Mar 28 buy side trigger now testing buy sell trigger 167.51. See chart notes. #swingtrading https://www.tradingview.com/chart/FB/968SzV2E-Facebook-New-Buy-Sell-Trigger-Here-Now-See-Chart-Notes/

Facebook, trade, setup, swingtrading, chart
$FB Facebook long side trade from 153.40 Mar 28 buy side trigger now testing buy sell tigger 167.51 #swingtrading

April 11 – Swing Trading in Review. $DIS, $C, $TSLA, $FB, $SPY, $GDX, $CELG https://compoundtrading.com/swing-trading-review-dis-c-tsla-fb-spy-gdx-celg/ …

https://twitter.com/CompoundTrading/status/983045524839452672

Charts and Chart Set-ups on Watch:

100 Day Moving Average on Monthly Oil Chart logical price target. $USOIL $WTI #OIL $USO $UWT $DWT $CL_F #OOTT

https://www.tradingview.com/chart/USOIL/X2bXU0B8-100-Day-Moving-Average-on-Monthly-Oil-Chart-Logical-Price-Target/

OIL, Monthly, Chart, Trading, Plan, Premarket
100 Day Moving Average on Monthly Oil Chart logical price target. $USOIL $WTI #OIL $USO $UWT $DWT $CL_F #OOTT

Gold bulls continue to press the upper resistance points on daily chart model. #Gold $GLD $GC_F $XAUUSD $NUGT $DUST

GOLD, resistance, chart
Gold bulls continue to press the upper resistance points on daily chart model. #Gold $GLD $GC_F $XAUUSD $NUGT $DUST

$GDX Gold miner trading near mid quad resistance test and perfectly on way to price target. $NUGT $DUST $JNUG $JDST

$GDX, Gold, Miner, Chart, $DUST, $NUGT
$GDX Gold miner trading near mid quad resistance test and perfectly on way to price target. $NUGT $DUST $JNUG $JDST

$FEYE trade went as prescribed in last report – bias long to upside price target 22.32 June 27.

Feye, trading, plan, stocks, premarket
$FEYE trade went as prescribed in last report – bias long to upside price target 22.32 June 27.

Bitcoin: April 12 – Bullish indicator – price didn’t drop in to target this time. Not absolute indication of turn, but is a signal. $BTC

$BTC, chart, algorithm
Bullish indicator – price didn’t drop in to target this time. Not absolute indication of turn, but is a signal. $BTC

$CELG 86s to 91s off alert, buy sell trigger now. Chart Notes. https://www.tradingview.com/chart/CELG/gdKoFxEq-CELG-86s-to-91s-off-alert-buy-sell-trigger-now-Chart-Notes/ …

$CELG 86s to 91s off alert, buy sell trigger now. Chart Notes. https://t.co/5AWSJCxqA5 pic.twitter.com/9SaQX01K5U

— Swing Trading (@swingtrading_ct) April 8, 2018

$MXIM under 55.94 short side looks great. MACD turn. See Chart notes. #swingtrading https://www.tradingview.com/chart/MXIM/l2JjyH3X-MXIM-under-55-94-short-side-looks-great-MACD-turn-Chart-notes/ …

$MXIM under 55.94 short side looks great. MACD turn. See Chart notes. #swingtrading https://t.co/nNQfOV6rMr pic.twitter.com/4241zYTpX0

— Swing Trading (@swingtrading_ct) April 8, 2018

Litecoin will have to bounce near here if chart structure to remain in place. $LTC

If it doesn’t bounce near up channel support (yellow diagonal line) it could run another trading quad area down very easily.

See chart notes.

https://www.tradingview.com/chart/LTCUSD/NAsEtGUs-Litecoin-likely-bounce-near-here-for-chart-structure-Chart-notes/ …

Litecoin will have to bounce near here if chart structure to remain in place. $LTC

If it doesn't bounce near up channel support (yellow diagonal line) it could run another trading quad area down very easily.

See chart notes.https://t.co/SMEVswx4ha pic.twitter.com/EHM5S9DmcC

— Crypto the BTC Algo (@CryptotheAlgo) April 7, 2018

$TSLA also blasting here from yesterday’s alert🔥 In it to win it. #swingtrading

$TSLA also blasting here from yesterday's alert🔥 In it to win it. #swingtrading pic.twitter.com/JEefAyUROL

— Melonopoly (@curtmelonopoly) April 5, 2018

$DIS swing trade set-up from swing trading report yesterday blasting here🔥 Nice set-up. In it to win it. #swingtrading https://twitter.com/SwingAlerts_CT/status/981914928528416768/photo/1pic.twitter.com/muDQaThxP2

$DIS swing trade set-up from swing trading report yesterday blasting here🔥 Nice set-up. In it to win it. #swingtrading https://t.co/muDQaThxP2 pic.twitter.com/UXpvTgLpuo

— Melonopoly (@curtmelonopoly) April 5, 2018

Trade in $C Citi on fire🔥In it to win it. #swingtrading

Trade in $C Citi on fire🔥In it to win it. #swingtrading pic.twitter.com/0HKG0jH9sb

— Melonopoly (@curtmelonopoly) April 5, 2018

Market Outlook, Market News and Social Bits From Around the Internet:

#5things
-Metals surge
-Saudi oil-price target in sight
-VIX questions
-Markets mixed
-Coming up…
https://bloom.bg/2Hb7yOS


#5things
-Metals surge
-Saudi oil-price target in sight
-VIX questions
-Markets mixed
-Coming up…https://t.co/oZnzSi096t pic.twitter.com/jzQ5IysjNj

— Bloomberg Markets (@markets) April 19, 2018

VIX rigging talk erupts on Wall Street after another wild swing https://bloom.bg/2HgOCug

VIX rigging talk erupts on Wall Street after another wild swing https://t.co/Z7TFX0d8S7 pic.twitter.com/pl7aOw6qDt

— Bloomberg Markets (@markets) April 19, 2018

If you are new to our trading service you should review recent blog posts, the Compound Trading YouTube Channel and at minimum our algorithm Twitter feeds because they do tell a story in terms of the market and how the inflections of the market determine our day to day trading. You will notice the algorithmic modelling has been undeniably accurate with many time-frames (intra-day, weeks and months out) so I myself have learned to respect their math (they have taken me from a 60% hit rate to 80%+ in my trading – all publicly posted live trades).

Momentum Stocks (Market Open and Intra-Day):

I do trade morning momo stocks, but I do avoid much of the day trading risk (preferring to daytrade only what is structurally set-up also on the swing trade side and to my advantage in the algorithmic model charting). I often avoid the first 30 minutes (gap and go) and trade momentum stocks or structured (per explanation in previous sentence) stocks later in day after a wash-out looking for a snap-back trade that can possibly also become a strong swing or longer term trade that I can leg in to. Just prior to open and shortly after open I post momentum stocks to the trade chat room (and Twitter and Stocktwits if I have time).

Some of my Favorite Intra-day Trading Set-Ups:

(1) Momentum Stock Wash-Outs for Snap Back, (2) Bad News Wash-outs on Stocks with High Institutional Ownership, (3) Getting on the Right Side of a Trend Change and scaling in my position and (4) Our Algorithm Charting Model Set-Ups.

The momentum stocks (from previous days and morning trade) I continue to watch through the day for indicators that allow a trade.

Morning Stock Watch-Lists for my Favorite Set-Ups:

(1) Pre-Market Gainers Watch-List:   $BPTH, $VTVT, $SHPG $APHB $AA $TOPS $GFI $WPP $ABB $HMY $GERN $YINN $BK $ERIC $SBGL $DGAZ $SOXS $ROKU $TVIX $RAD $HX $YNDX $AMZN

(2) Pre-market Decliners Watch-List :

(3) Other Watch-List:

(4) Regular Algo Charting Watch-List: Gold $GC_F $GLD, Miners $GDX ($NUGT, $DUST, $JDST, $JNUG), Silver $SLV $SI_F ($USLV, $DSLV), Crude Oil FX: $USOIL $WTI ($UWT, $DWT, $USO, $UCO, $CL_F, $UWT, $DWT), Natural Gas $NG_F ($UGAZ, $DGAZ), S & P 500 $SPY $ES_F ($SPXL, $SPXS), US Dollar Index $DXY ($UUP), Volatility $VIX ($TVIX, $UVXY), $BTCUSD Bitcoin.

(5) Recent Upgrades: $EBAY PT Raised to $58 at Citi

(6) Recent Downgrades:

United Financial $UBNK PT Lowered to $17 at RBC Capital

Texas Capital Bancshares $TCBI PT Lowered to $105 at RBC Capital

Stay tuned in Stock Chat Room for more pre-market stocks on watch.

Study:

For new readers, a review of our unlocked posts on our blog would help you get in to the story we are following with the securities listed in this newsletter.

Free scanners to find momentum stocks that you can easily review charts of for indicators that bring probability of your trade being successful up considerably. These are not useful for first 30 minute market open gap and go type plays (you need a good momentum scanner, level 2, and best to have hot-keys for the first 30 mins of gap and go trading)… but are very useful for intra day scalping and swing trading (start with trending stocks and then look at indicators intra for simple set-ups – study scan study scan study scan).

http://finviz.com/

https://finance.yahoo.com/screener/predefined/ec5bebb9-b7b2-4474-9e5c-3e258b61cbe6

http://www.highshortinterest.com/

http://www.gurufocus.com/short-stocks.php

http://www.3xetf.com/all/

http://www.etf.com/channels/gold-etfs

GL!

Curtis

Algorithm Twitter feeds can be found here: $BTC (@CryptotheAlgo) $WTI (@EPICtheAlgo), $VIX (@VexatiousVIX), $SPY (@FREEDOMtheAlgo), $GLD (@ROSIEtheAlgo), $SLV (@SuperNovaAlgo), $DXY (@DXYUSD_Index). Our Swing Trading Twitter feed is found here: https://twitter.com/swingtrading_ct.  Our lead trader Twitter feed is here @curtmelonopoly and lead tech developer @hundalSHS.

Article Topics: Premarket, Watchlist, Stocks, Trading, Plan,  OIL, $WTI, $USOIL, GOLD, $GLD, Crypto, $BTC, $SPY

Read More
Rosie Gold Algorithm Chart Model Wed Apr 18 $GC_F $XAUUSD $GLD $UGLD $DGLD $GDX $NUGT $DUST

Rosie Gold Algorithm Chart Model Wed Apr 18 $GC_F $XAUUSD $GLD $UGLD $DGLD $GDX $NUGT $DUST

April 18, 2018April 29, 2018 RosietheAlgo GLDRosie the Gold Algo Chart Report$DGLD, $DUST, $GDX, $JDST, $JNUG, $NUGT, $UGLD, $XAUUSD, Algorithm, Chart, GLD, Gold, Miners, Rosie, Trading

Rosie the Gold Algorithm Model Charting Update Wednesday April 18, 2018 #GOLD $GC_F $XAUUSD $GLD, $UGLD, $DGLD with Gold Miner Observations: $GDX, $GDXJ ($NUGT, $DUST, $JDST, $JNUG)

Good day! My name is Rosie the Gold Algo. Welcome to my new member edition Gold trade report for Compound Trading.

Like EPIC our Oil Algorithm chart model, I am an algorithm chart model in development and trader testing for coding phase to be used as an intelligent assistant for our traders (not HFT). My charting model is specifically suitable for the use and purpose of Gold and Gold Miner related.

The charting models are best used decision to decision. In other words, each line on the algorithmic model charts are support and resistance. As trade progresses, weighing algorithmic charting model against conventional charting observations provides an edge over using only conventional charts.

If you need assistance at anytime contact my developers at [email protected].

Updates:

The charting below for Gold now has prospective channel support and resistance, considerable wider time frame quad walls highlighted (thicker orange dotted lines) and key channel direction decision areas noted with purple arrows.

How to Use the Charting Model:

How to Use ROSIE Gold Algorithm: #GOLD, $GLD, $XAUUSD, $GDX, $GDXJ, $NUGT, $DUST, $JNUG, $JDST

Gold / Gold Miner Trade Coaching

Users of this algorithm model charting may opt for private one-on-one coaching with our lead trader and / or an experienced trader that has worked under our lead trader.

On our website there are standard one-on-one online coaching packages you can order (coaching via Skype) or you can request a customized package (reflecting the time you are wanting to invest in your learning). 

To request a custom package most suited to your needs email us at [email protected] or click here for a standard private trade coaching package. Other options for coaching include online webinars for members (from time to time), private on location and in-person coaching sessions at our new trading location(s) and organized trading conference events. 

Primary Trade Indications:

Live Twitter Alert Feed for Gold / Miner Trades: @GoldAlerts_CT

Gold Trade Buy / Sell Short Term Swing Triggers

For short term trading the following are support and resistance areas for trade that can be used as buy / sell triggers for Gold.

1300.96

1311.07

1321.30

1331.51

1341.61

1351.86

1362.03

1372.72

1383.43

1384.79

The primary method of trade our traders are reporting works with the most predictability is to wait for Gold to breach the trading range (grey lines marked with arrows) up or down and then have it confirm as it leaves the corresponding trading quadrant to the up or downside. See video above.

As it is a model in development, if you find more predictable methods please report same.

Resistance and Support Clusters: Blue and Yellow horizontal (may be sloped) lines (marked with arrows). The thicker they are the more significant they are. Blue are conventional indicators and Yellow are calculated historical algorithmic points of significance. If the cluster is significant our charting techs will shade the area in white to bring this to your attention. The most recent cluster has proven to be significant resistance in recent trade.

Trading Range: Grey Lines (marked with grey arrows). Trade above or below creates bias and bias is confirmed to a high probability when trade then leaves a quadrant (geometric diamond shape formed with diagonal Fib trend lines for time – frame) after gaining or losing a trading range horizontal support / resistance line (grey horizontal line).

Quadrants: Diagonal Orange Lines that form diamond shapes. Based on diagonal Fibonacci trend lines act as important support and resistance. The wider the time frame the thicker the line.

Channel Decisions: Purple arrows note critical uptrend and downtrend channel decisions.

Fibonacci Support and Resistance: Horizontal lines on charting (various colors).

Targets: Red circles on charting. The least of the indicators and should be used for observation purpose only. The targets are in very early stage development / testing. Two are provided for each quadrant time frame – the upper scenario targets should be considered if trend is up and likewise for the lower. Only either are expected to hit (if at all – very low probability of a hit is expected at this point).

Conventional Charting: All decisions should be weighed against conventional charting (as may be provided below also).

Gold Algorithm Live Charting Link: Click on share button bottom right (beside flag) and then click on “Make it Mine”.

Gold Live Chart Link April 18, 2018:

https://www.tradingview.com/chart/GOLD/rReBUiMD-Current-trade-area-Rosie-Gold-Algorithm-April-18-607-AM-Gold/

Current trade area. Rosie Gold Algorithm. April 18 607 AM #Gold $GLD $GC_F $XAUUSD $NUGT $DUST

Gold, algorithm, chart, $GLD, $XAUUSD
Current trade area. Rosie Gold Algorithm. April 18 607 AM #Gold $GLD $GC_F $XAUUSD $NUGT $DUST

Gold down channel scenario. Rosie Gold Algorithm. April 18 609 AM #Gold $GLD $GC_F $XAUUSD $NUGT $DUST

Gold, down, channel, chart
Gold down channel scenario. Rosie Gold Algorithm. April 18 609 AM #Gold $GLD $GC_F $XAUUSD $NUGT $DUST

Gold up channel scenario. Rosie Gold Algorithm. April 18 608 AM #Gold $GLD $GC_F $XAUUSD $NUGT $DUST

Gold, up, channel, chart
Gold up channel scenario. Rosie Gold Algorithm. April 18 608 AM #Gold $GLD $GC_F $XAUUSD $NUGT $DUST

Conventional Charting Considerations:

WOW. Gold bulls continue to press upper resistance. Chart notes.

Gold technical reality has my “trader bias” in conflict. 

Gold -0.11% recent historical resistance has been a predictable short, however, a break upside is becoming more and more probable as this structure firms up and upside price targets in time cycle become more probable. 

MACD and Stochastic RSI are both still trending on the daily – this is bullish . 

May 4, 2018 time / price cycle peaks and the bullish targets on this daily chart model are 1352.00 1387.00 and most bullish scenario 1420.00. 

There is lots of room to upside forming the algorithmic model charting channel also. The top of the prospective upside channel is wayyyy up there. This is important. 

In summary…. this chart structure of Gold is forming a significant risk reward advantage to the bullish side. 

I am personally (trader bias) slanted to bearish , but the chart says bullish . Primarily because of symmetry and structure. 

Trade price, not opinion. 

https://www.tradingview.com/chart/GOLD/CC40Zior-WOW-Gold-bulls-continue-to-press-upper-resistance-Chart-notes/

GOLD, resistance, chart
Gold bulls continue to press the upper resistance points on daily chart model. #Gold $GLD $GC_F $XAUUSD $NUGT $DUST

Per previous;

Gold came off again at historical resistance for predictable short. target June 4 1320.00 area. #Gold $GLD $GC_F

If the June 4 downside target doesn’t hit and Gold -0.04% turns up then look to upside in to 1350.00 area again for a decent short side trade set-up (historical resistance).

Trade is over 50 MA at this point on daily but 100 MA seems to be recent support area (generally).

Also MACD Stoch RSI and SQZMOM are moderately flat so this looks like a consolidation area near term.

https://www.tradingview.com/chart/GOLD/IcE7fVql-Historical-resistance-hit-again-Predictable-short-Chart-Notes/

Gold, resistance, chart, daily
Gold came off again at historical resistance for predictable short. target June 4 1320.00 area. #Gold $GLD $GC_F

Per recent;

GOLD MACD and Squeeze Momentum indicators are turned up on daily. Bullish.

Current trading bias is long considering.

Gold, MACD, chart
GOLD MACD and Squeeze Momentum indicators are turned up on daily. Bullish.

Gold Miner $GDX:

$GDX Gold miner trading near mid quad resistance test and perfectly on way to price target. $NUGT $DUST $JNUG $JDST

https://www.tradingview.com/chart/GDX/vsFoQRJA-GDX-Gold-miner-trading-near-mid-quad-resistance-test-and-perfec/

$GDX, Gold, Miner, Chart, $DUST, $NUGT
$GDX Gold miner trading near mid quad resistance test and perfectly on way to price target. $NUGT $DUST $JNUG $JDST

Per recent;

$GDX 50 MA test, structure in play – one of the cleanest, easiest trades on the market $NUGT $DUST $JDST $JNUG $GLD

https://www.tradingview.com/chart/GDX/xqvoPTby-50-MA-Test-Structure-in-Play-Top-10-Easiest-Trades-See-Notes/

No trading is easy, but I’m sure you get my point – the symmetry, structure and support and resistance points in this trade set-up in Gold -0.05% Miners certainly helps a trader plan each trade in this.

GDX 0.46% is setting up for an excellent long side bias price target trade in to time price cycle peak June 5 (red circles on chart are the preferred price targets as trade reflects – trade in direction of most appropriate target).

Gold -0.05% 0.56% miners continue to bounce off previous (historical) support area with predictability. The trend (or history in this instance) is your friend.

Price is currently following the diagonal uptrend quad trading range for this time cycle upward near perfect along quad wall support structure (blue dotted diagonal) on the algorithmic trading model chart.

A long near the support (previous bounce area of 21.00) and trimming near 23.00 has been a great trade and there’s no reason to change my trading plan unless something structurally changes in the charting / trade.

THE ONE IMPORTANT note in recent trade is that we did fail the upside 50 MA test on the daily chart …. but this could break upside soon. SO WATCH THE 50 MA VERY CLOSELY and trade accordingly. Failing 50 MA is bearish until it’s not. Upside break likely rockets trade north, so at this point I am long bias.

If 50 MA test fails I will be looking for long side after next bounce again in to the model structure.

Per recent;

$GDX Gold miners once again bouncing at the recent support.

https://www.tradingview.com/chart/GDX/rGrPWcfs-GDX-Gold-miners-once-again-bouncing-at-the-recent-support/

$GDX, chart
$GDX Gold miners once again bouncing at the recent support.

Per recent;

Gold Miners $GDX break down of recent monthly lows possible here in to lower target. $NUGT $DUST $JDST $JNUG

https://www.tradingview.com/chart/GDX/2qXL8Us8-Gold-Miners-GDX-break-down-of-recent-monthly-lows-possible-here/

GDX, Gold, Miners, Chart, Targets
Gold Miners $GDX break down of recent monthly lows possible here in to lower target. $NUGT $DUST $JDST $JNUG

$GDX Gold Miner PT in play – price above 21.06 targets 2315 below 21.06 targets 18.90 June 4. $NUGT $DUST $JDST $JNUG

https://www.tradingview.com/chart/GDX/9Wa5xCJK-GDX-Gold-Miner-PT-in-play-price-above-21-06-targets-2315-belo/

$GDX, chart, in play, price, targets
$GDX Gold Miner PT in play – price above 21.06 targets 2315 below 21.06 targets 18.90 June 4. $NUGT $DUST $JDST $JNUG

Recent Gold Price Targets:

Gold price target April 6 hit perfect to time and price provided on report 14 days prior. $GC_F $GLD $XAUUSD $DUST $NUGT

Gold, price target, algorithm
Gold price target April 6 hit perfect to time and price provided on report 14 days prior. $GC_F $GLD $XAUUSD $DUST $NUGT

Gold price target 1800 Sun lined up to price target time and price provided on report 6 days prior. $GC_F $GLD $XAUUSD $DUST $NUGT

Gold, price, target, hit, algorithm
Gold price target 1800 Sun lined up to price target time and price provided on report 6 days prior. $GC_F $GLD $XAUUSD $DUST $NUGT

Gold price target 1800 Mar 4 hit perfect to time and price provided on report 6 days prior. $GC_F $GLD $XAUUSD $DUST $NUGT

Gold, algorithm, price, target
Gold price target 1800 Mar 4 hit perfect to time and price provided on report 6 days prior. $GC_F $GLD $XAUUSD $DUST $NUGT

Gold price target 1800 Feb 4 hit perfect to time and price provided on report 7 days prior. $GC_F $GLD $XAUUSD $DUST $NUGT

Gold, algorithm, price, target, hit
Gold price target 1800 Feb 4 hit perfect to time and prce provided on report 7 days prior. $GC_F $GLD $XAUUSD $DUST $NUGT

Recent Gold and Gold Miner Trade Alerts:

Alert – Gold long side bias trade set-up trading intra 1346.18 PT’s on chart. Trim in to each resistance & add above.

Alert – Gold long side bias trade set-up trading intra 1346.18 PT’s on chart. Trim in to each resistance & add above.

https://twitter.com/goldalerts_ct/status/986515923657019393

Gold, long, trade
Alert – Gold long side bias trade set-up trading intra 1346.18 PT’s on chart. Trim in to each resistance & add above.

$GDX long side trade trim bias now in to resistance at 23.14 and add above long for next PT 24.21

https://twitter.com/goldalerts_ct/status/984834434015821824

$GDX long side trade trim bias now in to resistance at 23.14 and add above long for next PT 24.21

https://twitter.com/goldalerts_ct/status/984834434015821824

$GDX near mid quad res today – trim longs there and add above on break for 25.19 PT June 5. https://www.tradingview.com/chart/GDX/iriVmaBR-GDX-near-mid-quad-res-today-trim-longs-there-and-add-above-on/ …

https://twitter.com/goldalerts_ct/status/984215137010757632

All the best with your trades and look forward to seeing you in the room!

Rosie the Gold Algo

Tweets by ROSIEtheAlgo

Article Topics: Rosie, Gold, Algorithm, Chart, Trading, Gold, $XAUUSD, $GOLD, $GLD, $UGLD, $DGLD, Miners, $GDX, $NUGT, $DUST, $JDST, $JNUG

Read More
Special Swing Trade Report: #OIL, #GOLD,  $NFLX, $SPY, $DIS, $GDX, $TSLA, $AAOI, $ESPR, $ITCI, $TAN, $CELG, $C and more.

Special Swing Trade Report: #OIL, #GOLD, $NFLX, $SPY, $DIS, $GDX, $TSLA, $AAOI, $ESPR, $ITCI, $TAN, $CELG, $C and more.

April 11, 2018April 11, 2018 Curt MelonopolySwing Newsletters$AAOI, $C, $CELG, $DIS, $EOG, $ESPR, $GDX, $ITCI, $NFLX, $TAN, $TSLA, Charting, Gold, Oil, Report, Setups., Sing, SPY, Trading

Exclusive Report for Email List Members and Swing Trading Members.

Some of the best trading set-ups and ROI we have had in some time. Wow. 

Excellent set-ups in #OIL, #GOLD, $NFLX, $SPY, $DIS, $GDX, $TSLA, $EOG, $AAOI, $ESPR, $ITCI, $TAN, $CELG, $C and many more.

Written Summary Below of Trading Plan Set-Ups Reviewed in Video (Click on links in summary text below to be directed to specific charting from lead trader).

#EIA Oil Analysis / Charting Structure $USOIL $WTI: Oil trade is divergent to upside on the EPIC Algorithm Model. Trade is up near channel resistance area and our long bias is no longer in play until this resistance area is concluded to up or downside – there is a probable trade scenario going forward reviewed on video (EPIC members can review EPIC alerts, private Discord room, weekly newsletter and visit 24 hour oil room for more detail). The weekly simple oil model has a 74.50 upside chance for oil for week of April 9, 2018. And the third chart reviewed here is the Monthly oil model with a time cycle peak in October coming in around 67.00 on $USOIL $WTI. Doesn’t mean it won’t spike up in to weekly target range of 74.50 prior to returning to 67.00 area. Also of note is the 200 MA resistance and 50% retracement line on charting that is reviewed in this video.

Our weekly simple oil model posted originally months back has a 74.50 upside chance for oil for week of April 9, 2018 time cycle completion. Never thought price would get anywhere near that:) $USOIL $WTI #CL $UWT $DWT $USO #OOTT

Our weekly simple oil model posted originally months back has a 74.50 upside chance for oil for week of April 9, 2018 time cycle completion. Never thought price would get anywhere near that:) $USOIL $WTI #CL $UWT $DWT $USO #OOTT https://t.co/4EyE5Xajfv

— Melonopoly (@curtmelonopoly) April 11, 2018

And the simple monthly oil model with a time cycle peak in October is coming in around 67.00 on $USOIL $WTI (most probable) target. Video on deck explains other targets (trade price). $USO #CL #OOTT #OIL https://www.tradingview.com/chart/USOIL/LFoaIZEq-Oil-Resistance-One-of-Most-Predictable-Trades-See-chart-notes/ …

And the simple monthly oil model with a time cycle peak in October is coming in around 67.00 on $USOIL $WTI (most probable) target. Video on deck explains other targets (trade price). $USO #CL #OOTT #OIL https://t.co/utoQLL18ra pic.twitter.com/V3bkZVUpXR

— Melonopoly (@curtmelonopoly) April 11, 2018

Gold $GC_F $GLD – Weekly MACD pinching up with trade near previous high. This is a test area. Don’t forget the previous high test resistance with Gold that has caused it to back off.

$EOG EOG Resources – EOG trading above important buy trigger 108.76 intra trading 107.93. 115.29 diagonal resistance and one at 119.68 with 115 to 116 price target at earnings end of the month, if price holds the buy sell trigger area in around 109.00. Long over trigger.

$AAOI Applied OptoElectronics – Triggering buy long side trigger over mid quad on AAOI, is up over 12% on the day. More alert detail to follow for members as trade plays out.

$ESPR Esperion – ESPR trading perfect through the Fibs, hit important pivot resistance on 71.67 and triggered long side buy with first target 74.67 and hit today and backed off some. Looking for 80.60 – 80.80.

$ITCI Intra Cellular – ITCI with resistance 23.88 as intra important buy trigger with price above it. If it loses support 23.88 (when price is above) then cut each time until trade takes and hits the next price target area of 30.0 ish.

$DIS Disney – Disney dropped out bottom of model like $SPY model in recent volatility / panic. Structured buy side play targeting 103.73 June 30. Previously charted a number of times / alerted recently.

$NFLX Netflix – Netflix has been a fantastic trade set-up for members. We had a buy trigger 295.40. Buy side trigger confirmation was diagonal Fib / quad wall (explained on video).

$SPY SP500 – Same type of structure as Disney chart. This structure was modeled in advance of price. It is hitting exact day and time and price targets. This again has been an excellent SPY trade set-up for members. Upside 265.52 resistance, mid quad 267.96 and over targets over 265.62 targets 268 area April 18, 2018 as first buy side price target.

$TAN Solar ETF – TAN 25.08 intra with buy trigger at 25.50 on watch intra.

$GDX Gold Miners – Miner’s near mid quad resistance Fib line and then backed off on the day. Has been an excellent trade alert on long side for our members. 23.14 is the trim mark and it came very near today.

$CELG CELGENE – Celgene has price trending along diagonal Fib (quad wall) to first price target 91.37, 91.97, 96.00 price targets to upside off buy side long alert previously to members. Ultimate bullish target is 95.60 April 20 but unlikely.

$MXIM Maxim Integrated – We have a sell side bias on Maxim that has to play out. Watching. Resistance and support on chart in video.

$TSLA TESLA – Alerting TESLA in 260.00 range has been a great buy side trade structure. It got up over major resistance at mid quad horizontal Fib buy side confirmation trigger at 280.17 ish and straight to next resistance 304.60 with Nov 14 382.70 price target. Price targets (resistance) on its way upside are at 333.80 and 338.62 on its way up.

$C Citi – 73.68 next price target on Citi and all the resistance and more price targets explained on video.

$ATHM AutoHome – Fantastic break-out trade set-up previously alerted and now over previous highs. Trade price here forward. Will alert sell side when it triggers.

$VRX Valeant – Near 200 MA on daily as a massive test and then 50 MA on daily upside is the buy trigger. Model to follow if it sets up.

We also reviewed a few of the momentum stocks from the day.

For more detail on the time cycle peaks for your trade, price targets, and support / resistance points relating to your personal trading plan contact me with any questions you have.

Best and peace!

PS Remember to trade price – if the trade goes against you it is always better to take a small loss than be married to a bad chart / stock.

I am live broadcasting these trading set-up and other chart set-ups documenting my process in detail for review w/ daily PL’s, video, charting set-ups and alerts.

Subscribe: 1 month free trial and a $1.99 sign-up fee promo ends in 72 hours.

Swing Trading Bundle (Swing Trading Newsletter and Live Swing Trading Alerts).

Swing Trading Newsletter (Weekly Newsletter Published for Traders).

Real-Time Swing Trading Alerts (Private Member only Twitter Feed).

One-on-One Trade Coaching (Via Skype or In-Person).

Reach Out:

Register to free email list for trade set-ups, webinars, special events: https://compoundtrading.com/contact/

Website: https://compoundtrading.com

Free chat room: https://discord.gg/2HRTk6n

Subscribe: https://compoundtrading.com/overview-…

Twitter: https://twitter.com/CompoundTrading

Lead Trader: https://twitter.com/curtmelonopoly

Tradingview: https://www.tradingview.com/u/curtmelonopoly/

Facebook: https://www.facebook.com/compoundtrading/

StockTwits: https://stocktwits.com/compoundtrading

Email: https://[email protected]

Compound Trading Platform: Algorithm model charting for $SPY, $VIX, #OIL, #GOLD, #SILVER, #Crypto ($BTC Bitcoin 1.05% , $ETH, $LTC, $XRP,) $DXY -0.05% US Dollar -0.05% and Swing Trading Newsletter. Live trading rooms for daytrading and oil 2.00% traders. Private coaching and live alerts.

Read More
Rosie Gold Algorithm Chart Model Mon Apr 9 $GC_F $XAUUSD $GLD $UGLD $DGLD $GDX $NUGT $DUST

Rosie Gold Algorithm Chart Model Mon Apr 9 $GC_F $XAUUSD $GLD $UGLD $DGLD $GDX $NUGT $DUST

April 9, 2018April 29, 2018 RosietheAlgo GLDRosie the Gold Algo Chart Report$DGLD, $DUST, $GDX, $JDST, $JNUG, $NUGT, $UGLD, $XAUUSD, Algorithm, Chart, GLD, Gold, Miners, Trading

Rosie the Gold Algorithm Model Charting Update Monday April 9, 2018 #GOLD $GC_F $XAUUSD $GLD, $UGLD, $DGLD with Gold Miner Observations: $GDX, $GDXJ ($NUGT, $DUST, $JDST, $JNUG)

Good day! My name is Rosie the Gold Algo. Welcome to my new member edition Gold trade report for Compound Trading.

Like EPIC our Oil Algorithm chart model, I am an algorithm chart model in development and trader testing for coding phase to be used as an intelligent assistant for our traders (not HFT). My charting model is specifically suitable for the use and purpose of Gold and Gold Miner related.

The charting models are best used decision to decision. In other words, each line on the algorithmic model charts are support and resistance. As trade progresses, weighing algorithmic charting model against conventional charting observations provides an edge over using only conventional charts.

If you need assistance at anytime contact my developers at [email protected].

Updates:

The charting below for Gold now has prospective channel support and resistance, considerable wider time frame quad walls highlighted (thicker orange dotted lines) and key channel direction decision areas noted with purple arrows.

How to Use the Charting Model:

How to Use ROSIE Gold Algorithm: #GOLD, $GLD, $XAUUSD, $GDX, $GDXJ, $NUGT, $DUST, $JNUG, $JDST

Gold / Gold Miner Trade Coaching

Users of this algorithm model charting may opt for private one-on-one coaching with our lead trader and / or an experienced trader that has worked under our lead trader.

On our website there are standard one-on-one online coaching packages you can order (coaching via Skype) or you can request a customized package (reflecting the time you are wanting to invest in your learning). 

To request a custom package most suited to your needs email us at [email protected] or click here for a standard private trade coaching package. Other options for coaching include online webinars for members (from time to time), private on location and in-person coaching sessions at our new trading location(s) and organized trading conference events. 

Primary Trade Indications:

Live Twitter Alert Feed for Gold / Miner Trades: @GoldAlerts_CT

Gold Trade Buy / Sell Short Term Swing Triggers

For short term trading the following are support and resistance areas for trade that can be used as buy / sell triggers for Gold.

1300.96

1311.07

1321.30

1331.51

1341.61

1351.86

1362.03

1372.72

1383.43

1384.79

The primary method of trade our traders are reporting works with the most predictability is to wait for Gold to breach the trading range (grey lines marked with arrows) up or down and then have it confirm as it leaves the corresponding trading quadrant to the up or downside. See video above.

As it is a model in development, if you find more predictable methods please report same.

Resistance and Support Clusters: Blue and Yellow horizontal (may be sloped) lines (marked with arrows). The thicker they are the more significant they are. Blue are conventional indicators and Yellow are calculated historical algorithmic points of significance. If the cluster is significant our charting techs will shade the area in white to bring this to your attention. The most recent cluster has proven to be significant resistance in recent trade.

Trading Range: Grey Lines (marked with grey arrows). Trade above or below creates bias and bias is confirmed to a high probability when trade then leaves a quadrant (geometric diamond shape formed with diagonal Fib trend lines for time – frame) after gaining or losing a trading range horizontal support / resistance line (grey horizontal line).

Quadrants: Diagonal Orange Lines that form diamond shapes. Based on diagonal Fibonacci trend lines act as important support and resistance. The wider the time frame the thicker the line.

Channel Decisions: Purple arrows note critical uptrend and downtrend channel decisions.

Fibonacci Support and Resistance: Horizontal lines on charting (various colors).

Targets: Red circles on charting. The least of the indicators and should be used for observation purpose only. The targets are in very early stage development / testing. Two are provided for each quadrant time frame – the upper scenario targets should be considered if trend is up and likewise for the lower. Only either are expected to hit (if at all – very low probability of a hit is expected at this point).

Conventional Charting: All decisions should be weighed against conventional charting (as may be provided below also).

Gold Algorithm Live Charting Link: Click on share button bottom right (beside flag) and then click on “Make it Mine”.

Gold Live Chart Link April 9, 2018:

https://www.tradingview.com/chart/GOLD/mnPIRLaE-Rosie-Gold-Algorithm-Current-trade-area-April-9-111-AM-Gold/

Rosie Gold Algorithm – Current trade area. April 9 111 AM #Gold $GLD $GC_F $XAUUSD $NUGT $DUST

Gold, Algorithm, Current, trade
Rosie Gold Algorithm – Current trade area. April 9 111 AM #Gold $GLD $GC_F $XAUUSD $NUGT $DUST

Rosie Gold Algorithm – Up trend channel scenario. April 9 114 AM #Gold $GLD $GC_F $XAUUSD $NUGT $DUST

Gold, chart, GC_F, $GLD
Rosie Gold Algorithm – Up trend channel scenario. April 9 114 AM #Gold $GLD $GC_F $XAUUSD $NUGT $DUST

Rosie Gold Algorithm – Down trend channel scenario. April 9 113 AM #Gold $GLD $GC_F $XAUUSD $NUGT $DUST

Gold, chart, down, channel
Rosie Gold Algorithm – Down trend channel scenario. April 9 113 AM #Gold $GLD $GC_F $XAUUSD $NUGT $DUST

Conventional Charting Considerations:

Gold came off again at historical resistance for predictable short. target June 4 1320.00 area. #Gold $GLD $GC_F

If the June 4 downside target doesn’t hit and Gold -0.04% turns up then look to upside in to 1350.00 area again for a decent short side trade set-up (historical resistance).

Trade is over 50 MA at this point on daily but 100 MA seems to be recent support area (generally).

Also MACD Stoch RSI and SQZMOM are moderately flat so this looks like a consolidation area near term.

https://www.tradingview.com/chart/GOLD/IcE7fVql-Historical-resistance-hit-again-Predictable-short-Chart-Notes/

Gold, resistance, chart, daily
Gold came off again at historical resistance for predictable short. target June 4 1320.00 area. #Gold $GLD $GC_F

Per recent;

GOLD MACD and Squeeze Momentum indicators are turned up on daily. Bullish.

Current trading bias is long considering.

Gold, MACD, chart
GOLD MACD and Squeeze Momentum indicators are turned up on daily. Bullish.

Gold up over 50 MA and quad diagonal trendline res in to mid quad res. Targets in play.

Resistance here at the mid quad would be a reasonable expectation, and if not for sure at the diagonal trendline resistance above.

https://www.tradingview.com/chart/GOLD/7Fc0aXKz-Gold-up-over-50-MA-and-quad-diagonal-trendline-res-in-to-mid-qua/

Gold, chart, price, targets, resistance
Gold up over 50 MA and quad diagonal trendline res in to mid quad res. Targets in play.

Gold Miner $GDX:

$GDX 50 MA test, structure in play – one of the cleanest, easiest trades on the market $NUGT $DUST $JDST $JNUG $GLD

https://www.tradingview.com/chart/GDX/xqvoPTby-50-MA-Test-Structure-in-Play-Top-10-Easiest-Trades-See-Notes/

Gold, resistance, chart, daily
Gold came off again at historical resistance for predictable short. target June 4 1320.00 area. #Gold $GLD $GC_F

No trading is easy, but I’m sure you get my point – the symmetry, structure and support and resistance points in this trade set-up in Gold -0.05% Miners certainly helps a trader plan each trade in this.

GDX 0.46% is setting up for an excellent long side bias price target trade in to time price cycle peak June 5 (red circles on chart are the preferred price targets as trade reflects – trade in direction of most appropriate target).

Gold -0.05% 0.56% miners continue to bounce off previous (historical) support area with predictability. The trend (or history in this instance) is your friend.

Price is currently following the diagonal uptrend quad trading range for this time cycle upward near perfect along quad wall support structure (blue dotted diagonal) on the algorithmic trading model chart.

A long near the support (previous bounce area of 21.00) and trimming near 23.00 has been a great trade and there’s no reason to change my trading plan unless something structurally changes in the charting / trade.

THE ONE IMPORTANT note in recent trade is that we did fail the upside 50 MA test on the daily chart …. but this could break upside soon. SO WATCH THE 50 MA VERY CLOSELY and trade accordingly. Failing 50 MA is bearish until it’s not. Upside break likely rockets trade north, so at this point I am long bias.

If 50 MA test fails I will be looking for long side after next bounce again in to the model structure.

Per recent;

$GDX Gold miners once again bouncing at the recent support.

https://www.tradingview.com/chart/GDX/rGrPWcfs-GDX-Gold-miners-once-again-bouncing-at-the-recent-support/

$GDX, chart
$GDX Gold miners once again bouncing at the recent support.

Per recent;

Gold Miners $GDX break down of recent monthly lows possible here in to lower target. $NUGT $DUST $JDST $JNUG

https://www.tradingview.com/chart/GDX/2qXL8Us8-Gold-Miners-GDX-break-down-of-recent-monthly-lows-possible-here/

GDX, Gold, Miners, Chart, Targets
Gold Miners $GDX break down of recent monthly lows possible here in to lower target. $NUGT $DUST $JDST $JNUG

$GDX Gold Miner PT in play – price above 21.06 targets 2315 below 21.06 targets 18.90 June 4. $NUGT $DUST $JDST $JNUG

https://www.tradingview.com/chart/GDX/9Wa5xCJK-GDX-Gold-Miner-PT-in-play-price-above-21-06-targets-2315-belo/

$GDX, chart, in play, price, targets
$GDX Gold Miner PT in play – price above 21.06 targets 2315 below 21.06 targets 18.90 June 4. $NUGT $DUST $JDST $JNUG

Per recent;

$GDX Gold Miner price above 21.06 targets 2315 and below 21.06 targets 18.90 June 4. $NUGT $DUST $JDST $JNUG

https://www.tradingview.com/chart/GDX/32aRl68H-GDX-Gold-Miner-price-above-21-06-targets-2315-and-below-21-06-t/

$GDX, Miner, chart, price, targets
$GDX Gold Miner price above 21.06 targets 2315 and below 21.06 targets 18.90 June 4. $NUGT $DUST $JDST $JNUG

Recent Gold Price Targets:

Gold price target April 6 hit perfect to time and price provided on report 14 days prior. $GC_F $GLD $XAUUSD $DUST $NUGT

Gold, price target, algorithm
Gold price target April 6 hit perfect to time and price provided on report 14 days prior. $GC_F $GLD $XAUUSD $DUST $NUGT

Gold price target 1800 Sun lined up to price target time and price provided on report 6 days prior. $GC_F $GLD $XAUUSD $DUST $NUGT

Gold, price, target, hit, algorithm
Gold price target 1800 Sun lined up to price target time and price provided on report 6 days prior. $GC_F $GLD $XAUUSD $DUST $NUGT

Gold price target 1800 Mar 4 hit perfect to time and price provided on report 6 days prior. $GC_F $GLD $XAUUSD $DUST $NUGT

Gold, algorithm, price, target
Gold price target 1800 Mar 4 hit perfect to time and price provided on report 6 days prior. $GC_F $GLD $XAUUSD $DUST $NUGT

Gold price target 1800 Feb 4 hit perfect to time and price provided on report 7 days prior. $GC_F $GLD $XAUUSD $DUST $NUGT

Gold, algorithm, price, target, hit
Gold price target 1800 Feb 4 hit perfect to time and prce provided on report 7 days prior. $GC_F $GLD $XAUUSD $DUST $NUGT

All the best with your trades and look forward to seeing you in the room!

Rosie the Gold Algo

Tweets by ROSIEtheAlgo

Article Topics: Rosie, Gold, Algorithm, Chart, Trading, Gold, $XAUUSD, $GOLD, $GLD, $UGLD, $DGLD, Miners, $GDX, $NUGT, $DUST, $JDST, $JNUG

Read More
Swing Trading Stock Update Thurs Apr 4 Part A $C, $AKTX, $DIS, $PSTG, $DXY, $XAUUSD, Gold …

Swing Trading Stock Update Thurs Apr 4 Part A $C, $AKTX, $DIS, $PSTG, $DXY, $XAUUSD, Gold …

April 4, 2018April 29, 2018 Swing TraderSwing Trading$AKTX, $C, $DIS, $PSTG, $XAUUSD, DXY, Gold, Picks, Stock, Swing, Trading

Welcome to the Compound Trading Weekly Swing Trading Stocks for April 4, 2018. $C, $AKTX, $DIS, $PSTG, $DXY, $XAUUSD, $BABA, $LIT, $BA, $MXIM, $ATHM, $BWA, $EXK.

Email us at [email protected] anytime with any questions about any of the swing trades listed below. Or, if we get bogged down private message Curtis in trade room or direct message him on Twitter. Market hours are tough but we endeavor to get back to everyone after market each day.

Notices:

Good morning!

This swing trading report is one in five in rotation. The goal is to publish each in rotation approximately every 30 – 40 days (pending market conditions). We currently have approximately one hundred equities we cover regularly in our swing trading rotation.

This is Part A and B of this report.

The reports are in the process of upgrades to included buy and sell triggers identified on charting of select instruments that are nearing trade set-ups. The triggers (price and / or other indicators) will also be programmed in to our charting for attendees to the live trading room and alerts will flash on screen in the trading room. Additionally, the triggers will be buy / sell points for our traders to use as part of the alerts members may receive.

If you need help with a specific trade and the specific trading plan for your swing trade set-up let me know and as I have time I can help you formulate.

When managing your trades with the reports keep in mind that you will have to invest an hour or two a week to check the indicators mentioned for buy and sell triggers.

Swing trading success, even with a service, does require “some” maintenance on the part of the user, although the new live alert service will take much of that burden off the user as we know many of our users have busy lives. It is the indicators lining up that signal a trade long entry or an exit. In our case rely heavily on MACD on daily or weekly (or Stoch RSI and Moving averages) but indicators we are basing our trade entry and exits on are listed with each trade so any user that does even moderate trade management will know when the indicator(s) have turn with or against the trade.

Intra-week you can always DM myself on Twitter or email with specific questions regarding trades you are considering for assistance. But it is critical that you attend to the maintenance of your signals at least once a week if not twice and set stops and preferably alarms so that intra-week you can enter or exit.

If nothing else you can always book some coaching time and I’ll assist also (highly recommended if you are not trading green yet). If interested in coaching options email me [email protected].

IF WE DON’T GET BACK TO YOU RIGHT AWAY it is usually because we are pressured with deadlines or are trading.

As live charts are made available below, click on link and open viewer. Then to use chart yourself click on share button at bottom right (near thumbs up) and then click “make it mine”.

To remove the indicators (MACD, Stochastic RSI, Squeeze Momentum Indicator represented at bottom of chart) double click on chart body – and same to return the indicators.

If you receive a report and you are not subscribed to the specific service it is a complimentary issue..

Our apologies if you receive more than one copy – it means you are on more than one subscription list. We are working to resolve this issue.

Newer updates below in red for ease.

Recent Compound Trading Videos and/ or Blog Posts for Swing Traders / Charting Set-Ups:

See You Tube for other recent video posts. 

Twitter Trading Plan $TWTR (Part two)

How to Trade $NFLX Move

How to Trade $MOMO Move

How to Trade $CHK Move

#SwingTrading Midday Review – Compound Trading: $LTBR, $ANF, $MOMO, $APTO, $USOIL, $WTI, $BA, $NFLX

No Crystal Ball? Watch this… EPIC Oil Algorithm #EIA $USOIL $WTI #OIL $USO $CL_F #OOTT #Algo

#SwingTrading Midday Review: $NFLX $BTCUSD $SPY $VCEL $COT $DXY #GOLD $GLD $SLV $USOIL $WTI

#SwingTrading Midday Review: $BZUN $SPY $COT $AMRC

Using the S&P500 to Confirm Momentum Correlates: $SPY/$BZUN Model Structures

How I executed volatility trade with precision. $VIX $XIV #Volatility #Trading $TVIX, $UVXY, $SPY

@EPICtheAlgo #EIA Report, January 24, 2018: Inverse Hedge Between #CL and $SPY

Swing trading setups Jan 18 $FB, $SPY, $CNTF, $CTIC, $RIOT, $AES ….

Email us at [email protected] anytime with any questions about any of the swing trades listed below. Or, if we get bogged down private message Curtis in trade room or direct message him on Twitter. Market hours are tough but we endeavor to get back to everyone after market each day.

Stock Pick Coverage

$C – CitiGroup

April 4 – Citi quad wall & historical support near. 74.46 PT Chart notes. – #C chart

http://www.tradingview.com/chart/C/qRDWOlvu-Citi-quad-wall-historical-support-near-74-46-PT-Chart-notes/ …

$C Citi at a quad wall and historical support test here. 74.46 June 15 time cycle price target in play. #swingtrading

The trading area quad wall test (blue dotted diagonal line) is real. It could hold. If not it is down to lower target most likely.

But if it holds the path of least resistance is June 15 price cycle peak price target at 74.46.

Also of note the historical pivot / support is the horizontal white dotted line.

Huge risk reward advantage here for bull side trade.

HOWEVER, the 200 MA on daily has been lost so watch that as significant upside resistance test if price gets upward momentum.

AND, the MACD on daily is not crossed up as of yet.

$C, swingtrading, chart
$C Citi at a quad wall and historical support test. 74.46 June 15 time cycle price target in play. #swingtrading

There is a special report out to members on CitiGroup swing trading set-up here. Password: CITISWING

$AKTX – Akari Therapeutics

April 4 – Watching $AKTX quad wall support test VERY CLOSE here. Upside May 16 price target is near double.

With this chart set-up all they need is some PR news and it will go in my opinion.

Stochastic RSI on daily recently turned up but MACD is flat and SQZMOM trending down. Would be prudent to have all 3 turned up for a long.

$AKTX Buy / Sell Triggers:

Near trade buy triggers (Fibonacci support / resistance):

2.09

2.63

2.86

3.12

Significant upside resistance support areas:

4.105 is the 200 MA

4.90

5.42

8.80

9.21

9.52

10.62

11.91

12.19

14.11

https://www.tradingview.com/chart/AKTX/nz6zdTql-Watching-AKTX-quad-wall-support-test-VERY-CLOSE-here-Upside-pr/

Akari Therapeutics Announces Fourth Quarter and Full Year 2017 Financial Results and Highlights Recent Clinical Progress

https://finance.yahoo.com/news/akari-therapeutics-announces-fourth-quarter-110000635.html?.tsrc=rss

$AKTX, price target, swing trading, chart
Watching $AKTX quad wall support test VERY CLOSE here. Upside price target is near double.

Mar 1 – $AKTX Daily chart – price slumping in to time price cycle expiry at lower quad target.

$AKTX High probability of bounce off a Fib area soon in to time cycle target noted.

https://www.tradingview.com/chart/AKTX/2vVhjfA0-AKTX-High-probability-of-bounce-off-a-Fib-area-soon-in-to-time/

$AKTX, Swing trade
$AKTX High probability of bounce off a Fib area soon in to time cycle target noted.

Jan 16 – All indicators on daily are indecisive to flat. Watching.

Dec11 – $AKTX premarket trading 5.79 up on news – chart with buy sell triggers for swing trade.

https://www.tradingview.com/chart/AKTX/M0PEi6eR-AKTX-premarket-trading-5-79-up-on-news-chart-with-buy-sell-tr/

$DIS – Disney

April 4 – $DIS trading 100.57 has MACD on daily targeting 103.89 110.64 May 30. #swingtrading Other targets noted.

Watch the 200 MA overhead as main resistance test on the way there.

2 Great Stocks You Can Buy and Hold Forever https://finance.yahoo.com/news/2-great-stocks-buy-hold-132100523.html?.tsrc=rss

https://www.tradingview.com/chart/DIS/241M4TSO-DIS-trading-100-57-has-MACD-on-daily-targeting-103-89-110-64-Ma/

$DIX, price targets, MACD, swingtrading
$DIS trading 100.57 has MACD on daily targeting 103.89 110.64 May 30. #swingtrading

Mar 1 – $DIS Stoch RSI turned down under 200 MA under mid quad bearish to targets.

This looks like a short to either target (follow price) if price stays under mid quad and 200 MA. It has been predictabiy hitting target areas.

$DIS News: Sky Is the Limit in Battle for Sky

https://www.tradingview.com/chart/DIS/ZnDXYcdX-DIS-Stoch-RSI-turned-down-under-200-MA-under-mid-quad-bearish-t/

$DIS, short, setup, swing
$DIS Stoch RSI turned down under 200 MA under mid quad bearish to targets.

Jan 16 – $DIS Disney trading 112.47 with earnings Feb 6 in bullish trade quad wall test on deck with price targets on chart. #swingtrading

Earnings Feb 6 with targets as listed below for Feb 15, 2018 time / price cycle peak:

Bullish price targets: 117.32, 124.22

Bearish price targets: 103.73, 96.90

Indecisive price target: 110.52

It seems with current trade bullish that if price breaks the quad wall (blue diagonal fib TL) to upside that at least 117.32 is in play (pending earnings of course).

https://www.tradingview.com/chart/DIS/STl9kKKR-DIS-Disney-trading-112-47-with-earnings-Feb-6-in-bullish-trade/

$DIS, Disney, Swing trading, chart, price, targets
$DIS Disney trading 112.47 with earnings Feb 6 in bullish trade quad wall test on deck with price targets on chart. #swingtrading

Dec 11 – The targets from the Nov 14 swing trading report played out perfect. Below are the new price buy sell triggers.

$DIS Disney Swing Trade Daily Chart with Buy Sell Triggers, Price Targets, Fibonacci Trendline Quads, Moving Averages #swingtrading

https://www.tradingview.com/chart/DIS/SHZjZ2BU-DIS-Disney-Swing-Trade-Daily-Chart-with-Buy-Sell-Triggers-Pric/

Disney $DIS Long Trade Scenario:

Trading at 104.37 premarket under 200 MA but above key support 103.69.

Trigger long 103.69 if it holds and watch 200 MA close as resistance.

110.63 Buy Sell Trigger

117.42 Buy Sell Trigger

Disney $DIS Short Trade Scenario:

Price fails 200 MA upside resistance test

Price fails Buy Sell Trigger support 103.69

Target next Fibs down at:

102.16

100.09

99.82

96.94

Blue Fibonacci trendlines act as support / resistance points also FYI.

$DIS, Swing Trade, Buy Sell, Triggers, Price Target
$DIS Disney Swing Trade Daily Chart with Buy Sell Triggers, Price Targets, Fibonacci Trendline Quads, Moving Averages #swingtrading

$PSTG – Pure Storage

April 4 – $PSTG indecisive trade but MACD on daily may turn up here. Long over 50 MA.

Why You Should Retain Pure Storage in Your Portfolio Now https://finance.yahoo.com/news/why-retain-pure-storage-portfolio-130101121.html?.tsrc=rss

https://www.tradingview.com/chart/PSTG/dvGKmWsB-PSTG-indecisive-trade-but-MACD-on-daily-may-turn-up-here-Long/

$PSTG, chart
https://www.tradingview.com/chart/PSTG/dvGKmWsB-PSTG-indecisive-trade-but-MACD-on-daily-may-turn-up-here-Long/

Mar 1 – $PSTG on watch in to earnings tomorrow – will chart thereafter.

Jan 16 – $PSTG trading 16.47 continues to trade under pressure now under 50 MA and 20 MA on daily. Will watch.

Dec 11 – $PSTG trading 17.25 and under 20 MA on daily. Will wait for 20 MA to be regained to assess set-up.

Nov 14 – $PSTG Pure Storage trade has been amazing since it regained 200 MA. Too extended now wait for MA test. #swingtrading

$PSTG, Swing trading, chart
$PSTG Pure Storage trade has been amazing since it regained 200 MA. Too extended now wait for MA test. #swingtrading

Oct 9 – Trading 15.55. Above all MA’s with MACD trending down. Will consider a long when MACD turns up.

$DXY US Dollar Index $UUP

April 4 – $DXY US Dollar sideways range bound trading.

$DXY, US Dollar, chart
$DXY US Dollar sideways range bound trading.

Mar 1 – $DXY US Dollar Index forming a reversal bottom bounce trend working through MAs on Daily.

It’s almost time to call this a reversal trend that can be charted with targets – very soon.

https://www.tradingview.com/chart/DXY/M94oJY3W-DXY-US-Dollar-Index-forming-a-reversal-bottom-bounce-trend-work/

$DXY, US Dollar, chart
$DXY US Dollar Index forming a reversal bottom bounce trend working through MAs on Daily.

Jan 16 – Trading 90.48 it remains under significant pressure with no considerable indicator pointing to an end to the downturn. Watching.

Dec 11 – Trading 93.84 and at this point well under 200 MA with Stoch RSI high – will watch yet.

Nov 14 – $DXY US Dollar Index trading 94.26 in premarket – wait for Stoch RSI and MACD to turn up. Under 200 MA.

$DXY, Swing, trade, US Dollar
$DXY US Dollar Index trading 94.26 in premarket – wait for Stoch RSI and MACD to turn up. Under 200 MA.

$XAUUSD #Gold $GLD $UGLD $DGLD

April 4 – Gold in a long drawn out range bound decision that should conclude soon. $XAUUSD #Gold $GLD $GC_F

No bias to conclusion as of yet.

https://www.tradingview.com/chart/XAUUSD/mptMsFti-Gold-in-a-long-drawn-out-range-bound-decision-that-should-conclu/

Gold, chart
Gold in a long drawn out range bound decision that should conclude soon. $XAUUSD #Gold $GLD $GC_F

Mar 1 – Gold – Long drawn out process on the monthly. Decision coming… $XAUUSD #Gold $GLD $GC_F

https://www.tradingview.com/chart/XAUUSD/F8phaow9-Gold-Long-drawn-out-process-on-the-monthly-Decision-coming/

Gold, monthly, chart
Gold – Long drawn out process on the monthly. Decision coming… $XAUUSD #Gold $GLD $GC_F

Jan 16 – Gold intra day trading up against significant historical resistance at a primary pivot – above opens way to significant upside.

Will be watching monthly chart for 100 MA upside test and historical resistance test. If price breaks above I will close a small short position and flip long in size. If that occurs I will post a swing trading chart model with targets.

Gold, swing, trading, chart, monthly, resistance
Gold intra day trading up against significant historical resistance at a prmary pivot – above opens way to significant upside.

Nov 14 – Gold premarket trading 1276.98 wait for Stochastic RSI to turn up on daily for a long swing trade. $GLD $XAUUSD $GC_F

Gold, premarket, swing, trading, GLD, XAUUSD, GC_F
Gold premarket trading 1276.98 wait for Stochastic RSI to turn up on daily for a long swing trade. $GLD $XAUUSD $GC_F

$MXIM – MAXIM Integrated Products

Mar 1 – $MXIM trade between the horizontal support and resistance lines.

https://www.tradingview.com/chart/MXIM/jZWbQmDZ-MXIM-trade-between-the-horizontal-support-and-resistance-lines/

$MXIM, trading, support, resistance
$MXIM trade between the horizontal support and resistance lines.

Jan 16 – $MXIM trading 55.05 continuing its bullish advance with earnings on Jan 25. Caution here warranted as price is extending considerably above 200 MA – especially as earnings report nears. If you trade it be very cautious with sizing in to earnings.

$MXIM, monthly, chart
$MXIM trading 55.05 continuing its bullish advance with earnings on Jan 25. Caution here warranted as price is extending considerably above 200 MA

Nov 14 – $MXIM possible buy trigger setting up wait for bounce off MA with Stoch RSI turned up along with MACD

$MXIM, Swing trading, chart, buy trigger
$MXIM possible buy trigger setting up wait for bounce off MA with Stoch RSI turned up along with MACD

Oct 9 – Trading 48.57 above all MA’s, near previous highs (52 week highs) and MACD trending up. Will wait for a break of previous highs to consider a long or at point of turn down and MACD turning back up.

$ATHM – AutoHome

Mar 1 – $ATHM Extremely bullish setup in to earnings on weekly chart. On high watch at ER.

$ATHM News: Autohome Inc. to Announce Fourth Quarter and Full Year 2017 Financial Results on March 7, 2018

$ATHM, weekly, chart
$ATHM Extremely bullish setup in to earnings on weekly chart. On high watch at ER.

Jan 16 – $ATHM trading 77.92 continues bullish advance on monthly chart with Stoch RSI turned up in to Mar 1 earnings.

The daily chart has a stoch RSI crossing down now however. If it crosses back up in advance of earnings I may consider a short-term swing trade in to earnings closing prior to date.

$ATHM monthly, chart
$ATHM trading 77.92 continues bullish advance on monthly chart with Stoch RSI turned up in to Mar 1 earnings.

Nov 14 – Trading 61.19 post earnings with Stoch RSI turned down on daily and MACD near flat. I would wait for the price to bounce of MA’s with Stoch RSI and MACD turned. Careful with any moving average above price – it will be resistance.

Oct 9 – Trading 61.42 with MACD on daily about to curl and cross up. If it does I will likely take the long.

$BWA – BorgWarner

Mar 1 – $BWA Under serious pressure with DOW slump and on 200 MA on Daily. Likely down further.

$BWA on weekly watching for possible bounce at 50 or 200 MA but MACD turned down.

$BWA, pressure, chart, daily, 200MA
$BWA Under serious pressure with DOW slump and on 200 MA. Likely down further.
$BWA, weekly, chart
$BWA on weekly watching for possible bounce at 50 or 200 MA but MACD turned down.

Jan 16 – $BWA needs to trade above 57.95 and hold to target higher in to earnings or it is lower. #swingtrading

https://www.tradingview.com/chart/BWA/JlOunzZI-BWA-needs-to-trade-above-57-95-and-hold-to-target-higher-in-to/

I have this one alarmed and will chart the swing trade targets to upside or downside as trade develops in to earnings set for Feb 8, 2018.

$BWA, swingtrading, chart
$BWA needs to trade above 57.95 and hold to target higher in to earnings or it is lower. #swingtrading

News on BorgWarber (BWA)

BorgWarner Inc. (BWA) has an Earnings ESP of +0.47% and a Zacks Rank #3. 

Headquartered in Auburn Hills, MI, BorgWarner is a leading manufacturer of powertrain products for major automakers. The company is expected to report fourth-quarter 2017 results on Feb 8.

BorgWarner supports initial launch of world’s first series-produced all-electric light-duty truck

BorgWarner, a global leader in clean and efficient technology solutions for combustion, hybrid and electric vehicles, supplies its HVH250 electric motor and eGearDrive® transmission for the initial launch of the FUSO eCanter truck, the world’s first series-produced all-electric light-duty truck.

Are Options Traders Betting on a Big Move in BorgWarner (BWA) Stock?

Clearly, options traders are pricing in a big move for BorgWarner, but what is the fundamental picture for the company? Currently, BorgWarner is a Zacks Rank #2 (Buy) in the Automotive – Original Equipment industry that ranks in the Top 40% of our Zacks Industry Rank. Over the last 60 days, two analysts have increased their earnings estimates for the current quarter, while none has dropped them.

Nov 14 – Trading 52.26 post earnings with Stoch RSI about to curl up on the daily and MACD the opposite – I would wait for Stoch RSI and MACD to turn up with price bouncing off MA’s and beware of any MA’s above price as it will be used as resistance.

Oct 9 – Trading 51.93 above all MA’s and Stoch RSI and MACD starting to cool after recent run. Will wait for MACD to return a trend down and cross up for a potential long.

$LIT  – Global Lithium

Mar 1 – Trading 34.22 lost 200 MA on daily – watching for a reconstruct bounce or continuation down. Watching.

Jan 23 – $LIT Lithium ETF trading 38.65 with Stoch RSI near bottom, MACD crossed down, SQZMOM red, watch for Stoch RSI cross up first.

$LIT, Lithium, Chart
$LIT Lithium ETF trading 38.65 with Stoch RSI near bottom, MACD crossed down, SQZMOM red, watch for Stoch RSI cross up first.

Nov 14 – Trading 40.45 near highs with Stoch RSI about to turn down on daily. Poor place for a long entry and poor risk – reward for a short. Wait for stoch RSI to curl up and assess bounce off moving averages. Has been trending for some time now and as such I would use caution with assumption that trend won’t retest the 200 ma – it is due.

Oct 9 – Trading 39.03 with recent pull back and run back and MACD about to possibly turn up again and price could break 52 week highs. If that scenario occurs it is a long for a test on the break.

Aug 7 – Trading 32.44 and all indicators still up. Obviously missed the move and now waiting for it to pull back to an ma on trend and bounce for a possible entry.

July 24 – Trading 30.68 all indicators up 52 week highs. Watching.

July 14 – Trading 30.35 with indicators signalling a buy and volume coming in over last week. On high watch.

July 5 – Trading 29.10 with MACD trending down. Waiting on MACD to assess.

June 26 – Trading 29.21 with all indicators pointing down but it looks like a turn may be near as Stoch RSIE looks bottomed and Fri volume appeared. On Watch.

June 18 – Trading 29.41 all indicators pointing down and waiting for the turn.

June 6 – Trading 29.92 Holding but be aware it could come of a bit soon before running again as Stoch RSI turned down on daily and its high on weekly.

$BA – Boeing

Mar 1 – Trading 262.21 with indecisive indicators. Watching.

Jan 23 – $BA Boeing trading 338.00 with Stoch RSI turned down, MACD and SQZMOM extended. Assess when Stoch RSI curls up.

$BA, stock, chart, daily
$BA Boeing trading 338.00 with Stoch RSI turned down, MACD and SQZMOM extended. Assess when Stoch RSI curls up.

Nov 14 – Trading 262.28 and all indicators in my opinion are extended / tired to bull side. I may be wrong, but I don’t see any great risk reward thesis available to long or short side right now.

Oct 9 – Trading 258.80. Trading new recent highs with ER in 15 days and MACD possibly ready to turn back up. Likely take a trade pre earnings if MACD turns up and previous highs break.

Aug 7 – Trading 237.31. Break out post earnings and starting to come off now. Will wait for it to pull back to ma that it bounces off and consider entry.

July 24 – Trading 212.16 earnings in 2 days. Going to watch this with interest considering recent bull run.

July 14 – Trading 207.50. All indicators are up and price is escalating. It seems the only way to trade this is as a traditional swing on pullbacks of MACD and the turn on it. Watching.

July 5 – Trading 198.59. MACD now trending down so I will wait for that to resolve and assess.

June 26 – Trading 202.23. So I missed the long and should have followed my set up on June 6. All indicators pointing up and making new 52 week highs. Fantastic trending stock and kicking myself for not taking that entry. Waiting for a pull back to assess.

June 18 – Trading 196.44. Per below it was in fact a good long. MACD has confirmed and price is now in break out trading at 52 week highs. I may trade this break out with a 1/5 size entry in pre market and wait for first pull back to add. Indicators on weekly turned up also.

June 6 – Trading 188.47. Per last report it was an okay long. SQZMOM green MACD trending up but Stoch RSI on daily trending down on daily and on weekly the MACD may turn down and SQZMOM Green but trending down. Watching for now.

$EXK – EXK Silver Mining

Mar 1 – $EXK under 200 MA on daily chart – watch for upside breach.

$EXK, daily, chart, 200 MA
$EXK under 200 MA on daily chart – watch for upside breach.

Jan 23 – $EXK Silver Corp trading 2.42 under 200 MA with Stoch RSI MACD SQZMOM turned down. Watching.

$EXK, Silver, Stock Chart
$EXK Silver Corp trading 2.42 under 200 MA with Stoch RSI MACD SQZMOM turned down. Watching.

Nov 14 – Trading 2.10 very heavy – no consideration yet.

$BABA – Alibaba

Mar 1 – Trading 186.14 with indecisive topping formation. Watching.

Jan 23 – $BABA trading 184.02 earnings on Feb 1 with Stoch RSI, MACD, SQZMOM turned down. Testing 20 MA on daily.

$BABA, Daily, Chart
$BABA trading 184.02 earnings on Feb 1 with Stoch RSI, MACD, SQZMOM turned down. Testing 20 MA on daily.

Nov 14 – $BABA careful with swing trade long short term as Stoch RSI is down w MACD to likely follow trading near highs.

Here is the $BABA chart premarket https://www.tradingview.com/chart/BABA/FyzDSu1Q-BABA-careful-with-swing-trade-long-short-term-as-Stoch-RSI-is-d/

$BABA, swingtrading, chart, premarket
$BABA careful with swing trade long short term as Stoch RSI is down w MACD to likely follow trading near highs.

Oct 9 – $BABA Trading near recent highs, trending. On break w MACD SQZMOM up I may long. #swingtrading

BABA, swing, trading
$BABA Trading near recent highs, trending. On break w MACD SQZMOM up I may long. #swingtrading

Aug 7 – Trading 153.33. Trending above ma’s keeps coming back to 20 ma and bouncing and now past ER so it should pullback to a deeper ma in trend and on a bounce I’ll enter.

July 24 – Trading 152.02 ER 17 days and MACD may turn down? Hard to say. Watching.

July 14 – Trading 149.75. This also is in break out and extended well above MA’s. Watching.

July 5 – Trading 140.99 and has been in range for days now on daily. MACD trending down so I will wait for it to turn to assess.

June 26 – Trading 143.01. Well, here we go with the no pull back again. All indicators are trending up on daily but the Stoch RSI turned down on weekly and volume is consistently coming down so I think a pull back is near.

June 18 – Trading 134.87. Still no pull back and I continue to pay. Anyway on weekly stoch rsi is turned down so we will see but MACD and SQZMOM is turned up so who knows when it will stop.

June 6 – Trading 125.20. Didn’t get our pull back and we’re paying. BUT SQZMOM just slightly turned down on weekly now so maybe we’ll get that pullback yet.

May 31 – Trading 123.60. Watching for a pull back.

May 23 – Trading 125.10. Well we got the pullback around earnings and missed it. Hopefully some members got it. It’s trading at near ATH’s right now in premarket.

May 17 – Trading 124.00. Every indicator on hourly, daily and weekly are still flashing buy, however, there has been no pullback to get an entry long. Watching.

May 8 – Trading 117.20. Same as below. Earnings nine days away also.

May 3 – Watching for it to cool off. Unfortunately we did miss some of the move. Waiting for MACD to trend down and catch it on its next turn up.

April 24 – Watching.

April 19 – Closed 111.40 at target from 104.64 cost avg 500 shares. Will allow MACD to return to bottom for re-entry.

$BABA, Swing, Trading, Chart
$BABA Closed trade at 111.40 at target from 104.64 cost average #swingtrading

April 10 – Hit 110.45, very near our 111.40 target. Holding, trading 109.34. Long 104.64.

April 4 – Holding long 500 shares from 104.64 now trading 108.17. It is testing all time highs and we may add on a break of all time highs. If it pulls back we may cut for a small profit. First price target is 111.40 (see below)

$BABA Live chart with indicators including that SQZMOM indicator – sweeet tool! https://www.tradingview.com/chart/BABA/Lbao9BVu-BABA-Swing-Trade-going-well-Our-Swing-Trading-side-is-in-at-10/

$BABA Swing Trade going well. Our Swing Trading side is in at 104.64 trading at 108.17. #swingtrading pic.twitter.com/x2zOezrBQ3

— Melonopoly (@curtmelonopoly) April 4, 2017

March 27 – We’re long 104.64 500 shares March 22 at test of 20 MA. Stop is at our entry and we are looking for a fresh break-out. However, the market sentiment is not great right now so we are unsure. There is an upside pivot at 111.38 we are watching for resistance should price continue up. Also watching MACD close.

$BABA, Swing, Trading
$BABA Swing trade

March 20 – Wait for MACD to turn up and confirm and stay long until MACD turns down. The Stoch RSI seems to be frontrunning the MACD fyi. $BABA is one of my favorites right now and I see a long entry early in the week.

$BABA Live Trading Chart – https://www.tradingview.com/chart/SPY/GsGBi5f2-BABA-Daily-100-MA-50-MA-Cross-MACD-Pinch-SQZMOM-up-Stoch-RSI/

$BABA Daily 100 MA 50 MA Cross, MACD Pinch, SQZMOM up, Stoch RSI up. Wait for MACD for long. #swingtrading

$BABA, Swing, Trading, Chart
$BABA Daily 100 MA 50 MA Cross, MACD Pinch, SQZMOM up, Stoch RSI up. Wait for MACD for long. #swingtrading

Email or DM me on Twitter anytime with thoughts or questions!

Cheers!

Curtis

Tweets by swingtrading_ct

Article Topics; $C, $AKTX, $DIS, $PSTG, $DXY, $XAUUSD, GOLD, $BABA, $LIT, $BA, $MXIM, $ATHM, $BWA, $EXK, Compound Trading, Swing, Trading, Stock, Picks

Read More
Rosie Gold Algorithm Chart Model Mon Mar 26 $GC_F $XAUUSD $GLD $UGLD $DGLD $GDX $NUGT $DUST

Rosie Gold Algorithm Chart Model Mon Mar 26 $GC_F $XAUUSD $GLD $UGLD $DGLD $GDX $NUGT $DUST

March 26, 2018April 29, 2018 RosietheAlgo GLDRosie the Gold Algo Chart Report$DGLD, $DUST, $GDX, $JDST, $JNUG, $NUGT, $UGLD, $XAUUSD, Algorithm, Chart, GLD, Gold, Miners, Rosie, Trading

Rosie the Gold Algorithm Model Charting Update Monday Mar 26, 2018 #GOLD $GC_F $XAUUSD $GLD, $UGLD, $DGLD with Gold Miner Observations: $GDX, $GDXJ ($NUGT, $DUST, $JDST, $JNUG)

Good day! My name is Rosie the Gold Algo. Welcome to my new member edition Gold trade report for Compound Trading.

Like EPIC our Oil Algorithm chart model, I am an algorithm chart model in development and trader testing for coding phase to be used as an intelligent assistant for our traders (not HFT). My charting model is specifically suitable for the use and purpose of Gold and Gold Miner related.

The charting models are best used decision to decision. In other words, each line on the algorithmic model charts are support and resistance. As trade progresses, weighing algorithmic charting model against conventional charting observations provides an edge over using only conventional charts.

If you need assistance at anytime contact my developers at [email protected].

Updates:

The charting below for Gold now has prospective channel support and resistance, considerable wider time frame quad walls highlighted (thicker orange dotted lines) and key channel direction decision areas noted with purple arrows.

How to Use the Charting Model:

How to Use ROSIE Gold Algorithm: #GOLD, $GLD, $XAUUSD, $GDX, $GDXJ, $NUGT, $DUST, $JNUG, $JDST

Gold / Gold Miner Trade Coaching

Users of this algorithm model charting may opt for private one-on-one coaching with our lead trader and / or an experienced trader that has worked under our lead trader.

On our website there are standard one-on-one online coaching packages you can order (coaching via Skype) or you can request a customized package (reflecting the time you are wanting to invest in your learning). 

To request a custom package most suited to your needs email us at [email protected] or click here for a standard private trade coaching package. Other options for coaching include online webinars for members (from time to time), private on location and in-person coaching sessions at our new trading location(s) and organized trading conference events. 

Primary Trade Indications:

Live Twitter Alert Feed for Gold / Miner Trades: @GoldAlerts_CT

Gold Trade Buy / Sell Short Term Swing Triggers

For short term trading the following are support and resistance areas for trade that can be used as buy / sell triggers for Gold.

1300.96

1311.07

1321.30

1331.51

1341.61

1351.86

1362.03

1372.72

1383.43

1384.79

The primary method of trade our traders are reporting works with the most predictability is to wait for Gold to breach the trading range (grey lines marked with arrows) up or down and then have it confirm as it leaves the corresponding trading quadrant to the up or downside. See video above.

As it is a model in development, if you find more predictable methods please report same.

Resistance and Support Clusters: Blue and Yellow horizontal (may be sloped) lines (marked with arrows). The thicker they are the more significant they are. Blue are conventional indicators and Yellow are calculated historical algorithmic points of significance. If the cluster is significant our charting techs will shade the area in white to bring this to your attention. The most recent cluster has proven to be significant resistance in recent trade.

Trading Range: Grey Lines (marked with grey arrows). Trade above or below creates bias and bias is confirmed to a high probability when trade then leaves a quadrant (geometric diamond shape formed with diagonal Fib trend lines for time – frame) after gaining or losing a trading range horizontal support / resistance line (grey horizontal line).

Quadrants: Diagonal Orange Lines that form diamond shapes. Based on diagonal Fibonacci trend lines act as important support and resistance. The wider the time frame the thicker the line.

Channel Decisions: Purple arrows note critical uptrend and downtrend channel decisions.

Fibonacci Support and Resistance: Horizontal lines on charting (various colors).

Targets: Red circles on charting. The least of the indicators and should be used for observation purpose only. The targets are in very early stage development / testing. Two are provided for each quadrant time frame – the upper scenario targets should be considered if trend is up and likewise for the lower. Only either are expected to hit (if at all – very low probability of a hit is expected at this point).

Conventional Charting: All decisions should be weighed against conventional charting (as may be provided below also).

Gold Algorithm Live Charting Link: Click on share button bottom right (beside flag) and then click on “Make it Mine”.

Gold Live Chart Link Mar 26, 2018:

https://www.tradingview.com/chart/GOLD/1n9xZtow-Current-trade-Rosie-Gold-Algorithm-Chart-Model-Mar-26-920-PM-G/

Current trade. Rosie Gold Algorithm Chart Model Mar 26 920 PM #Gold $GLD $GC_F $XAUUSD $NUGT $DUST

Current, trade, Gold, algorithm
Current trade. Rosie Gold Algorithm Chart Model Mar 26 920 PM #Gold $GLD $GC_F $XAUUSD $NUGT $DUST

Up trend channel scenario. Rosie Gold Algorithm Chart Model Mar 26 919 PM #Gold $GLD $GC_F $XAUUSD $NUGT $DUST

Gold, uptrend, chart, algorithm
Up trend channel scenario. Rosie Gold Algorithm Chart Model Mar 26 919 PM #Gold $GLD $GC_F $XAUUSD $NUGT $DUST

Down trend channel scenario. Rosie Gold Algorithm Chart Model Mar 26 916 PM #Gold $GLD $GC_F $XAUUSD $NUGT $DUST

Gold, algorithm, chart, downtrend
Down trend channel scenario. Rosie Gold Algorithm Chart Model Mar 26 916 PM #Gold $GLD $GC_F $XAUUSD $NUGT $DUST

Conventional Charting Considerations:

GOLD MACD and Squeeze Momentum indicators are turned up on daily. Bullish.

Current trading bias is long considering.

Gold, MACD, chart
GOLD MACD and Squeeze Momentum indicators are turned up on daily. Bullish.

Gold up over 50 MA and quad diagonal trendline res in to mid quad res. Targets in play.

Resistance here at the mid quad would be a reasonable expectation, and if not for sure at the diagonal trendline resistance above.

https://www.tradingview.com/chart/GOLD/7Fc0aXKz-Gold-up-over-50-MA-and-quad-diagonal-trendline-res-in-to-mid-qua/

Gold, chart, price, targets, resistance
Gold up over 50 MA and quad diagonal trendline res in to mid quad res. Targets in play.

Per recent;

Gold failed 50 MA test last week, targets in play. Chart notes. – $GOLD chart

Targets are in play and a decision should be made soon now for broader directional trade in to the targets.

Will update as the trade plays out. Per the Gold -0.07% member report there is a significant time price cycle peak Mar 21 at 3:00 AM so I suspect the near term trend decision will come out the other side of that time price cycle peak.

https://www.tradingview.com/chart/GOLD/EpWG14y1-Gold-failed-50-MA-test-last-week-targets-in-play-Chart-notes/

Gold, Chart, Daily, 50MA, Resistance, test
Gold failed the 50 MA test on daily last week and is at mid quad decision for upside or downside targets. $GC_F $XAUUSD $GLD

Per recent;

Gold under 50 MA coming in to compressed part of quad – targets in play. $XAUUSD #Gold $GLD $GC_F

https://www.tradingview.com/chart/GOLD/pNlwp44A-Gold-under-50-MA-coming-in-to-compressed-part-of-quad-targets/

Gold against underside of 50 MA on Daily Chart. Decision coming… $XAUUSD #Gold $GLD $GC_F

https://www.tradingview.com/chart/GOLD/YHkeMZYy-Gold-against-underside-of-50-MA-on-Daily-Chart-Decision-coming/

Gold, daily, chart, 50 MA, Resistance
Gold against underside of 50 MA on Daily Chart. Decision coming… $XAUUSD #Gold $GLD $GC_F

Gold Miner $GDX:

$GDX Gold miners once again bouncing at the recent support.

https://www.tradingview.com/chart/GDX/rGrPWcfs-GDX-Gold-miners-once-again-bouncing-at-the-recent-support/

$GDX, chart
$GDX Gold miners once again bouncing at the recent support.

Per recent;

Gold Miners $GDX break down of recent monthly lows possible here in to lower target. $NUGT $DUST $JDST $JNUG

https://www.tradingview.com/chart/GDX/2qXL8Us8-Gold-Miners-GDX-break-down-of-recent-monthly-lows-possible-here/

GDX, Gold, Miners, Chart, Targets
Gold Miners $GDX break down of recent monthly lows possible here in to lower target. $NUGT $DUST $JDST $JNUG

$GDX Gold Miner PT in play – price above 21.06 targets 2315 below 21.06 targets 18.90 June 4. $NUGT $DUST $JDST $JNUG

https://www.tradingview.com/chart/GDX/9Wa5xCJK-GDX-Gold-Miner-PT-in-play-price-above-21-06-targets-2315-belo/

$GDX, chart, in play, price, targets
$GDX Gold Miner PT in play – price above 21.06 targets 2315 below 21.06 targets 18.90 June 4. $NUGT $DUST $JDST $JNUG

Per recent;

$GDX Gold Miner price above 21.06 targets 2315 and below 21.06 targets 18.90 June 4. $NUGT $DUST $JDST $JNUG

https://www.tradingview.com/chart/GDX/32aRl68H-GDX-Gold-Miner-price-above-21-06-targets-2315-and-below-21-06-t/

$GDX, Miner, chart, price, targets
$GDX Gold Miner price above 21.06 targets 2315 and below 21.06 targets 18.90 June 4. $NUGT $DUST $JDST $JNUG

$GDX Gold Miner perfect hit to price time target published to reports weeks prior. $NUGT $DUST $JDST $JNUG

$GDX, chart, price, target
$GDX Gold Miner perfect hit to price time target published to reports weeks prior. $NUGT $DUST $JDST $JNUG

Per recent;

$GDX miner price path of least resistance is 21.00 on Feb 28. $NUGT $DUST $JNUG $JDST #Gold

GDX, chart, price, prediction
$GDX miner price path of least resistance is 21.00 on Feb 28. $NUGT $DUST $JNUG $JDST #Gold

Per recent;

$GDX miner trade somehow held the all important support area on the chart again. $NUGT $DUST $JNUG $JDST

https://www.tradingview.com/chart/GDX/CnSLCeke-GDX-miner-trade-somehow-held-the-all-important-support-area-on/

$GDX, miner, chart, support
$GDX miner trade somehow held the all important support area on the chart again. $NUGT $DUST $JNUG $JDST

Gold Price Targets:

Gold price target 1800 Sun lined up to price target time and price provided on report 6 days prior. $GC_F $GLD $XAUUSD $DUST $NUGT

Gold, price, target, hit, algorithm
Gold price target 1800 Sun lined up to price target time and price provided on report 6 days prior. $GC_F $GLD $XAUUSD $DUST $NUGT

Per recent;

Gold price target 1800 Mar 4 hit perfect to time and price provided on report 6 days prior. $GC_F $GLD $XAUUSD $DUST $NUGT

Gold, algorithm, price, target
Gold price target 1800 Mar 4 hit perfect to time and price provided on report 6 days prior. $GC_F $GLD $XAUUSD $DUST $NUGT

Per recent;

Gold price target 1800 Feb 4 hit perfect to time and price provided on report 7 days prior. $GC_F $GLD $XAUUSD $DUST $NUGT

Gold, algorithm, price, target, hit
Gold price target 1800 Feb 4 hit perfect to time and prce provided on report 7 days prior. $GC_F $GLD $XAUUSD $DUST $NUGT

All the best with your trades and look forward to seeing you in the room!

Rosie the Gold Algo

Tweets by ROSIEtheAlgo

Article Topics: Rosie, Gold, Algorithm, Chart, Trading, Gold, $XAUUSD, $GOLD, $GLD, $UGLD, $DGLD, Miners, $GDX, $NUGT, $DUST, $JDST, $JNUG

Read More

Posts navigation

Older posts
Newer posts
Proudly powered by WordPress | Theme: sharksdesign by reviewexchanger.
 

Loading Comments...