Tag: price targets
Best Trading Week in Months! Trade Alert Set-Ups: $NBEV, $CRON, Oil, $AAPL, $NFLX, $FB, $AMD, $BABA, $BLDP, $CARA, $EDIT, $BZUN and more.
Trade Alerts. Trade Set-ups Report and Video from Live Day Trading Room September 20: $NBEV, $CRON, Oil, $AAPL, $NFLX, $FB, $AMD, $BABA, $CARA, $BLDP, $EDIT, $BZUN and more. #daytrading #swingtrading
#TradeAlerts
Trading alerts and Swing Trading and Day Trading set-ups raw video from Live Trading Room mid-day review Sept 20, 2018. Some of the trade set-ups in this video are from the Trading Boot-Camp.
Stocks and Commodities Reviewed: Crude Oil Trading Algorithm, $WTI, $CL_F, $USOIL, $USO, SP500, $SPY, $AAPL, $NFLX, $FB, $EDIT, $CRON, $NBEV, $BLDP, $BZUN, $AMD, $OSIS, $CARA, $BABA, $LVEB, $XBIO, $NIHD, $ICCC and more.
It has been excellent this week! I had reported last week that I seen an inflection coming early this week and we nailed it! Continued market momentum if very possible in to next week. Many of the set-ups I have been posting the last week are firing trade signals consistently.
ITS SEEMS WE HAVE SOLVED THE BROADCASTING ISSUES WITH HARD WIRED FIBER INTERNET.
BE SURE TO LOOK AT THE CHART DATE AND TIME IN TOP LEFT HAND CORNER OF EACH CHART.
September 20, 2018
Crude Oil Trading Update ($USOIL, $WTI, $CL_F, $USO) – I review the crude oil algorithm on the video. Twice this week I took trades that I closed only to have them run after closing (I was away from monitors at each time). Execution of trades at the support and resistance of the crude oil trading algorithm (EPIC) has been excellent.
The weekly oil price targets from the weekly crude oil trading report and the charting provided in the reports have been really predictable lately also.
The crude oil trading alerts feed has been quieter this week because the trading plan in oil was to take the trades at the wider ranges to leg in to the trades, I did however alert the channel support and channel resistance and following through those trades would have been very profitable for oil trading members.
SP500 $SPY $SPXL $SPXS – On the SPY algorithm charting for 60 minute time-frame I have been watching for a break over the test area resistance 291.60 (trade alert on SPY went to swing trading alerts feed). Sept 24 time cycle 288.88 283.77 and uptrend 299.50 would be most bullish scenario. 294.33 resistance intra and main support on SPY intra-day 293.00.

APPLE $APPL – Apple’s stock is over 50 ma on 240 minute chart, trade alert went out on swing trading alert feed for Apple today. Testing the 20 MA, 224.70 resistance, 229.70 resistance, 236.75 is heavy resistance. Support 215.60 area intra-day and 219.02.

NETFLIX $NFLX – The long side trade that alerted that some members took has been very good at main support on the Apple chart. The trading support and resistance areas are discussed on video. Review of the chart model and video are important to understand the trading signals for Apple. 364.00 362.14 support areas, 395.59 397.90 are resistance areas. Really important to look at the chart and video explanation however.


FACEBOOK $FB – One of my favorite trade set-ups, especially for wash-out snap back trades. Facebook is currently under significant government pressure now so I am not expecting the same as previous. The horizontal red and blue support and resistance areas (forming the test area box on the charts) is reviewed and the diagonal Fibonacci trend lines. Here again review of the video and chart is really important. 167.51 mid quad resistance caution here, 100 MA resistance 169.40, diagonal Fib resistance, 173.51 is upside possible, 169.03 downside possible. The trading box is reviewed on the model. Buy sell triggers for trading signals on Facebook are also reviewed.
There is a previous special report on how to trade Facebook on our website.

EDITAS $EDIT – The value of structured set-ups with symmetry in the algorithmic stock chart models is discussed here. Examples are $GDX, $BLDP, $NBEV, $AGN, $EDIT and many more. The symmetry on EDIT chart has hit five times and typically you will see it stretched at that point. A trade alert went out today on $EDIT to watch closely going in to this time cycle. The video explains the details.

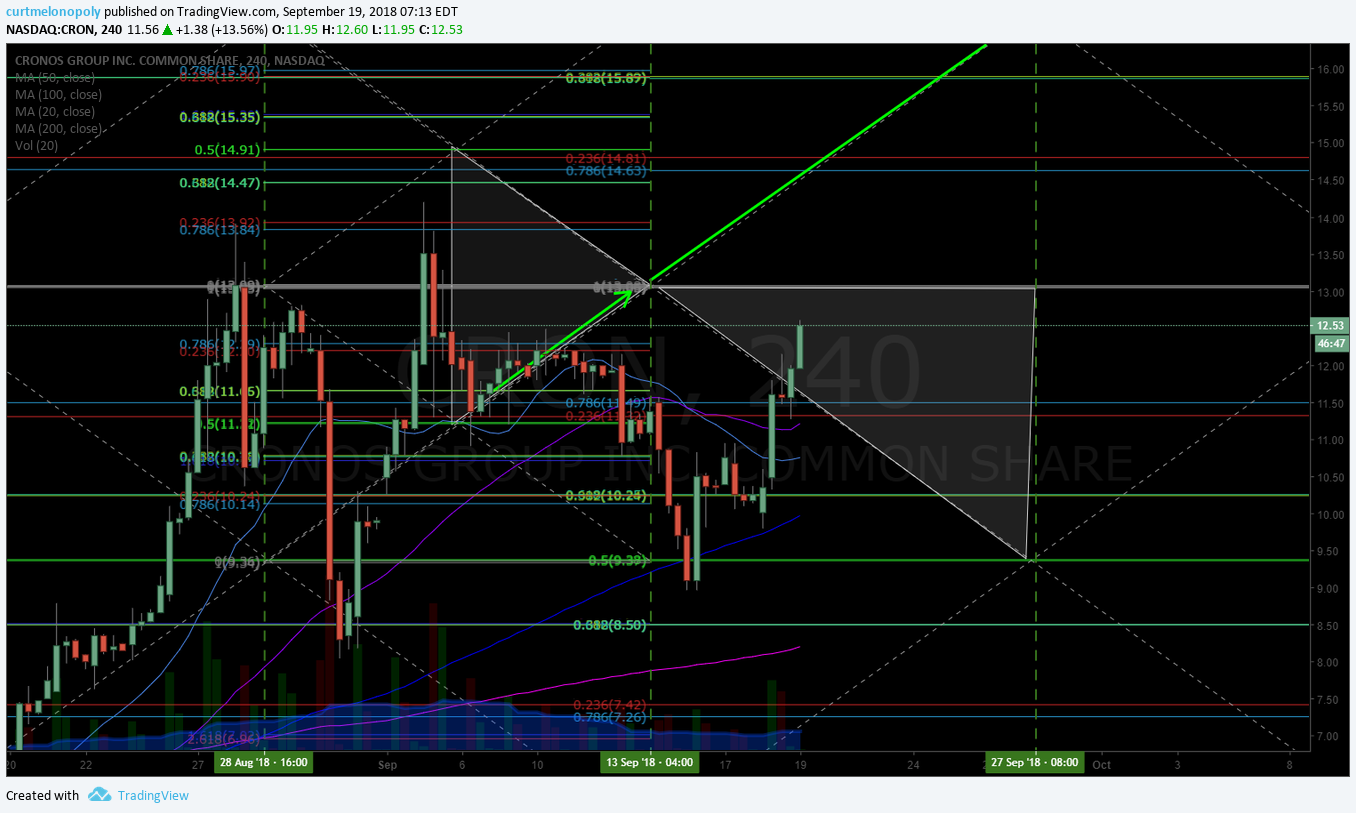
CRONOS $CRON – I have reviewed CRON chart set-ups many times this week. There is a light sidewinder trade set-up with the 50 MA and 20 MA on the CRON charting. You can expect a fairly decent move when the 20 MA breaches the 50 MA upside. It’s a lower time-frame being on a 240 minute chart, but it still may be enough to get price over that key resistance area reviewed on the chart and video. Pivots support and resistance areas also reviewed on video.

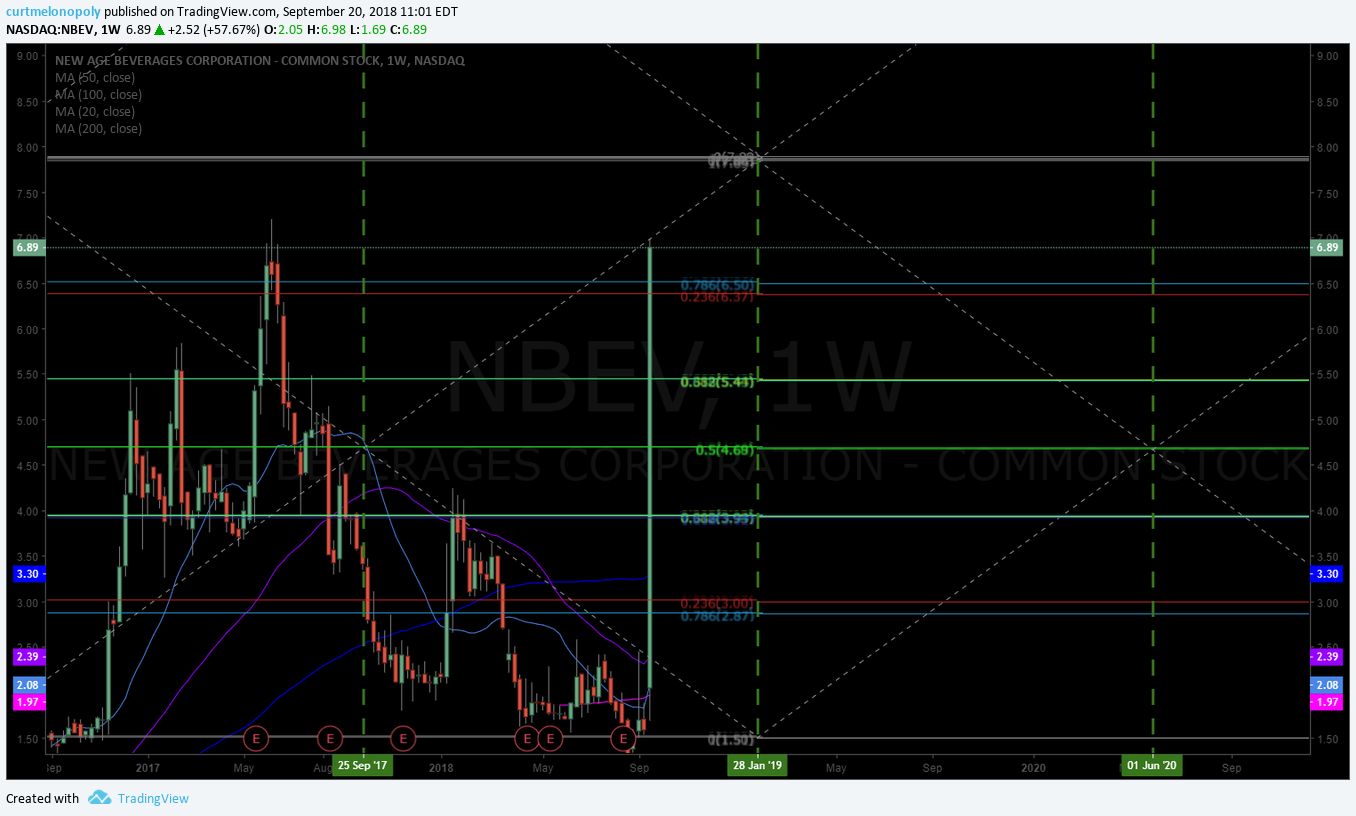
NEW AGE BEVERAGES $NBEV – I put out a special report to members today on NBEV and the trade has been fantastic since. The resistance areas and time cycles are reviewed on the video. The testing area (trading box) are reviewed. Also the price extensions (price targets) are reviewed. If price holds and price moves bullish in to time-cycle discussed on video the upside price targets for NBEV are extremely positive and reviewed on video. 9.38 is a very critical resistance and support area in to the key time cycle peak on the NBEV chart.


BALLARD POWER $BLDP – On the swing trading alert feed today a special alert went out on the fact that the last five time cycle completions in Ballard Power stock charting the price reversed in trade of Ballard. This is a symmetrical stock trade set-up that traders should not ignore. BLDP trading 4.50 up 7.42% intra-day spiking in to time cycle completion Oct 10, resistance 4.50 and the test range on the chart is reviewed.

BOAZUN $BZUN – Holding key support intra-day, if it holds a run up in price is possible. Termination of time cycle on 4 hour chart is near so get ready soon. High probability set-up. Details of trade set-up for BZUN reviewed in video. My bias is that this runs up.
ADVANCED MICRO $AMD – key support hit on chart and bounced, Oct 2 price target in bullish scenario is 33.62 and bearish scenario 22.87 in sell-off, mid quad on chart is discussed on video with various price target scenarios like 31.40 range being indecisive price target on Oct 2.

OSI SYSTEMS $OSIS – trading 77.55 testing 50 MA and key Fibonacci resistance on diagonal Fibonacci trend line, price target 84.21 Dec 28 is possible in uptrend trading. Resistance and support lines and how to trade the chart is reviewed on the model in video.

CARA THERAPEUTICS $CARA – I knew this one was going to get going, you don’t get many trade set-ups this strong.
There is a trade coaching bit of advice at this point on the video with reference to trading structured charting and its benefits to traders. Also market inflections and how to trade for your profit and loss and associated sizing in market inflections is also reviewed.
CARA is a great case study, going back to NBEV chart is reviewed on video – how price was getting bullish in to time cycle and how that relates to symmetry and price targets that can be traded.
28.20 is very likely fast in CARA trading if trade gets above key resistance. I put a trade alert out while recording video.

ALIBABA $BABA – this is the swing trade that I was under water on, bounced of 100 MA, now back in it’s structure, has a number of tests, 206.85 price target to upside with 237.62 most bullish scenario May 27, 2019. See chart review in video.

LEVEL BRANDS $LVEB – anything over 6.00 will confirm an upside trend and if that triggers we’ll structure the charting for you and go from there.
ALTIMMUNE $ALT – hit 50 MA resistance today, alarmed for a breach above the 50 MA and a possible run to 100 MA. Will alert the trade in ALT if it breaches the 50 MA and structure the chart model for members.
$CRBP – chart is too choppy.
COOL HOLDINGS $AWSM – garbage chart.
$YGYI – trade never holds gains.
$AYTU – choppy trading, garbage chart.
XENETIC BIOSCIENCES $XBIO – there is a special trade set-up report out on this set-up in XENETIC BIOSCIENCESS (XBIO) chart, trading up 23% today.
$OSN – over 200 MA, no good, no structure.
NII HOLDINGS $NIHD – up 19% in trading today, aggressive chart, bounced off 20 MA, trading 5.06, good argument 5.60 as a watch area on other side of the bowl, 6.25 is a safer region to look at a possible big run to 9.00. A double upside extension is possible. It is a structured trading chart. I alarmed NIHD for a trade.
$ICCC – trading 9.13 up 20%, swing trading service provider dream, signal long when price is over 200 MA and win almost every trade, you would take the odd cut but the moves would make up any cuts taken.
$VXRT – trading 2.85, terrible chart.
$COE – bad chart.
$KNDI – not a bad chart, testing the 50 MA, over 200 MA you could start to look at it, this will likely go on a run upside over 200 MA, possible reversal setting up on this chart.
$FTNW – bad chart.
$COCP – bad chart.
$LOMA – bad chart.
TRADING ROOM VIDEO Trade Alerts: #daytrading #swingtrading
Register to free email list for trade set-ups, webinars, special events: https://compoundtrading.com/contact/
Website: https://compoundtrading.com
Free chat room: https://discord.gg/2HRTk6n
Subscribe: https://compoundtrading.com/overview-…
Twitter: https://twitter.com/CompoundTrading
Lead Trader: https://twitter.com/curtmelonopoly
Tradingview: https://www.tradingview.com/u/curtmel…
Facebook: https://www.facebook.com/compoundtrad…
StockTwits: https://stocktwits.com/compoundtrading
Email: https://[email protected]
#tradealerts #swingtrading #daytrading
Article Topics; Trade Alerts, Trading, SwingTrading, DayTrading, Chart, Trade, Set-Ups, Signals, Price Targets, $NBEV, $CRON, Oil, $AAPL, $NFLX, $FB, $AMD, $BABA, $BLDP, $CARA, $EDIT, $BZUN
Trade Alerts (w/ video): $NBEV, $TLRY, $CGC, $CRON, $VKTX, $MOMO, $ROKU, $NVTA, $CRC, $THO, $DGLY, $YELP, $XXII, $CVM, $SHOP #daytrading #swingtrading
Trade Alerts Report and Video from Live Day Trading Room: $NBEV, $TLRY, $CGC, $CRON, $VKTX, $MOMO, $ROKU, $NVTA, $CRC, $THO, $DGLY, $YELP, $XXII, $CVM, $SHOP, OIL, $DXY, $SPY #daytrading #swingtrading
#TradeAlerts
Trading alerts and trading set-ups raw video from Live Trading Room mid-day review Sept 18, 2018. Some of the trade set-ups in this video are from the Trading Boot-Camp.
Stocks Reviewed: $NBEV, $TLRY, $CGC, $CRON, $VKTX, $MOMO, $ROKU, $NVTA, $CRC, $THO, $DGLY, $YELP, $XXII, $CVM, $SHOP, OIL, $DXY, $SPY and more.
Sept 18, 2018 Mid Day Trading Room Review.
Again, the sound upload quality struggled, today we’ll test the hardwired set-up and see if it’s better.
Reviewed the PL for 2017 and 2018 along with goals for Q4 2018 and Q1 2019 – gearing up for a big Q4 this year and Q1 2019 (getting back to basics of trading vs software development because development funds come from trading of course).
BE SURE TO LOOK AT THE CHART DATE AND TIME IN TOP LEFT HAND CORNER OF EACH CHART.
Crude Oil $WTI $CL_F $USO – review of crude oil algorithm and crude oil trading alert at channel support that I should have held, anyway I cut and missed it. Also the top channel resistance crude oil trade set-up was good (missed it, but some of the members reporting they nailed it). Opportunities this week with trading range and EIA reviewed. Crude oil machine trading price targets reviewed also (for last week’s trade). Only 1 minute chart below showing intra day resistance on second trade attempt on day (algorithm models not below).

VIKING THERAPEUTICS $VKTX – we had this lined up in premarket, retraced intra-day.

TILRAY $TLRY – trading at only 420 x earnings or something like that. Weekly chart gap on gap on weekly body of candles. Only way I would long this is on short time frames, and I likely will when the pot stocks settle a bit – working on the charting for all the pot stocks right now (hopefully released this weekend in prep for a sector pull back when it happens).
SP500 $SPY $SPXS $SPXL – 60 minute chart reviewed, over 291.70 is the upside break resistance, above the box price targets for Sept 27 reviewed on video, various support and resistance areas reviewed.

MOMO $MOMO – signalling a long or add long over 48.50 (if it holds, you always trim in to resistance areas and then add above or wait for a pull back and add to your long trade), expected trading trajectory reviewed on video, price targets for between now and Feb 5, 2019 large time cycle peak conclusion reviewed on video. This is a very structured chart.
https://www.tradingview.com/chart/MOMO/zkLs91ot-MOMO/

22nd Century Group $XXII – price targets reviewed on video. Very structured equity that has excellent ROI ROE. Not a chart or trade set-up to ignore IMO.

SHOPIFY $SHOP – bulls pressing the upside diagonal Fibonacci resistance, price targets reviewed. Great alert from Sean for an excellent swing trade. Could see previous highs in 177.00s really fast.

CEL SCI Corp $CVM – targets at 5.00 and 6.00 reviewed on chart on video and more is possible, liquidity is my issue. A double upside extension move is possible with this bullish scenario, bottom bounce structure coming out of bowl.

ROKU $ROKU – was at resistance 73.55 and price targets reviewed on video. As price nears the peak of the time cycle on the chart prepare for possible double extension blow-through on this one.
https://www.tradingview.com/chart/ROKU/7dzcNyBE-ROKU/

Note: CARA, BOX, BABA, POQR, SSW, VIX, OIL, SPY and others reviewed on yesterday’s video BTW.
CARA THERAPEUTICS $CARA – price targets etc reviewed on yesterday’s video.
https://www.tradingview.com/chart/CARA/DtYzRa8p-CARA/

US Dollar $DXY – decision October 3, 2018 that is important on the US Dollar DXY charting (parallel to many other peak time cycles in broad markets). Probability is up at or prior to time cycle completion.
$RLM – no.
$OASM – if you’re a risk taking trader this is a real aggressive chart structure, top of bowl is where it is trading now but it has a nature of coming off hard and it is thinly traded.
$NBEV NEW AGE BEVERAGES – weekly chart over 50 MA targeting 100 MA not a great ROI there in that set-up, chart is hard read. On daily up over 200 MA, does respect the 200 MA on daily, Showing bullish initial signals of a return. This one should go. Volume is good, Initial view I was not too interested but as I looked closer at the NBEV chart I realized this on should be on high watch. I went in to great detail of the pivots on the chart, buy sell triggers and price targets for NBEV.
NEW AGE BEVERAGES (NBEV) Above 2.80, targets 3.27, 4.17, 4.89.

$BHTG – no.
$RDCM – sitting on previous trading range support. 16.00 is reasonable, decent chart.
CRONOS GROUP (CRON) $CRON – reviewed on video, on the fly chart structure model reviewed. On high watch, expect a possible upside trading scenario with CRONOS. A trendline resistance was reviewed and important support and resistance and price targets reviewed on video (while we are processing this report the morning of Sept 19 it is moving in premarket trading up 8.39% at 12.53 in premarket this morning nearing its upside trading test area, the trendline resistance was broke to upside and the 13.00 area resistance in next). Over trendline sees the next test fast and the other price targets reviewed on video.

Updated set-up and trade alert for $CRON in premarket today while we process this video report.
CRONOS – per yesterday’s trade alert and review video over trendline on way to resistance test in premarket $CRONO #tradealert #premarket https://www.tradingview.com/chart/CRON/klRhec02-CRONOS-per-yesterday-s-trade-alert-and-review-video-over-trend/

AVON – Daily chart for AVON reviewed, likes the 200 MA with some room, testing resistance right now, I can’t touch it until it’s up for 3.00, needs to see recent highs first and then still some challenges.
$PYX – weekly chart reviewed, no structure I can work with.
$NVTA – aggressive structure, 18.90 alarmed on chart, has potential for a rip upside.
$EPM – not enough there. Doesn’t have margin, widths.
$CL – bad structure on chart.
YELP $YELP – technical bounce off 200 MA on the weekly chart in to resistance area on chart, if you’re long go to previous steps shown on chart in video, not taking the trade but it may work, not my thing – not enough range for ROI ROE for me.
$SRT – no.
$JONE – no.
$DEQ – no.
CANOPY GROWTH $CGC – had the opportunity to be in ground floor of this industry in Canada and turned it down jeez, getting close to previous candle high on weekly chart, could see a large a move there. Chart for Canopy Growth reviewed on the video. Can’t chase it here where it is on the chart and I’ll watch. Working on the structure of all the charts on our equities covered in our swing trading platform and when we’re done I’ll get more day trade aggressive.
CALIFORNIA RESOURCES $CRC – Aggressive chart and trade set-ups, coming out of bowl, 39.32 an 39.86 pivots on chart reviewed on video. Start watching it at 40.00 and see how it does.
THOR INDUSTRIES $THO – resting on the 200 MA trading about half way between it and 100 MA, it will likely turn here, price above moving averages on chart with 20MA breaching the 50 MA is a good entry long on this chart. The sidewinder set-up will be key on this one (reviewed on video) – that’s where the good returns are.
$MRSN – no chart structure, junk.
DIGITAL ALLEY $DGLY – trading 4.05, daily chart, getting in to diagonal trendline resistance at 12.20 right now, over 12.31 is a nice confirmation to the long side of this trade. Nice chart.
$CCXI – swing traders service type of trending stock that has way to many steps and not enough ROI, the step type that chop up a trader I’m not interested in.
$MHLD – no.
$BRID – no.
$NXIO – chart structure can get aggressive, gapping through chart structure makes me nervous.
There were many more of the momentum stocks for the day reviewed and the stocks selling-off on the day were also reviewed.
TRADING ROOM VIDEO Trade Alerts: #daytrading #swingtrading
Register to free email list for trade set-ups, webinars, special events: https://compoundtrading.com/contact/
Website: https://compoundtrading.com
Free chat room: https://discord.gg/2HRTk6n
Subscribe: https://compoundtrading.com/overview-…
Twitter: https://twitter.com/CompoundTrading
Lead Trader: https://twitter.com/curtmelonopoly
Tradingview: https://www.tradingview.com/u/curtmel…
Facebook: https://www.facebook.com/compoundtrad…
StockTwits: https://stocktwits.com/compoundtrading
Email: https://[email protected]
#tradealerts #swingtrading #daytrading
Article Topics; Trade Alerts, Trading, SwingTrading, DayTrading, Chart, Trade, Set-Ups, Signals, Price Targets, $NBEV, $TLRY, $CGC, $CRON, $VKTX, $MOMO, $ROKU, $NVTA, $CRC, $THO, $DGLY, $YELP, $XXII, $CVM, $SHOP, OIL, $DXY, $SPY
Bitcoin Algorithm (Crypto). Thurs July 26. $BTC $XBTUSD $XBT $ETH $LTC $XRP #Bitcoin #Algorithm
Bitcoin Algorithm Report (Crypto). Thursday July 26, 2018. Includes Time Cycles, Price Targets and Buy / Sell Triggers.
$BTC $BTCUSD $XBTUSD $XBT $BTC.X $ETH $LTC $XRP #Bitcoin #Crypto
Hello, my name is Crypto the Bitcoin Algorithm. Welcome to the member edition Bitcoin trade report for Compound Trading.
Like our other algorithmic chart models, I am in development and testing for coding phase to be used as an intelligent assistant for our traders. My algorithm charting model is specifically suitable for the use and purpose of trading Bitcoin $BTCUSD, Bitcoin/USD perpetual swaps $XBTUSD, Bitcoin related equities and you will find additional preliminary algorithmic modeling for $ETH, $LTC and $XRP in this report.
Note: The $XBTUSD (Bitcoin swaps) model is built on a chart from BitMEX. Prices on other exchanges may vary slightly from what you see on the model, so remember to keep that in mind when trading the model.
Notices:
- More extensive chart models for $BTCUSD, $ETHUSD, $XRPUSD, $LTCUSD and others (such as a few bitcoin related equities) will be featured in future reporting.
- Join us in our private Crypto Trading room server on discord!
- For newer users – read the blog post about how to trade Bitcoin here.
Primary Methods of Bitcoin Trade:
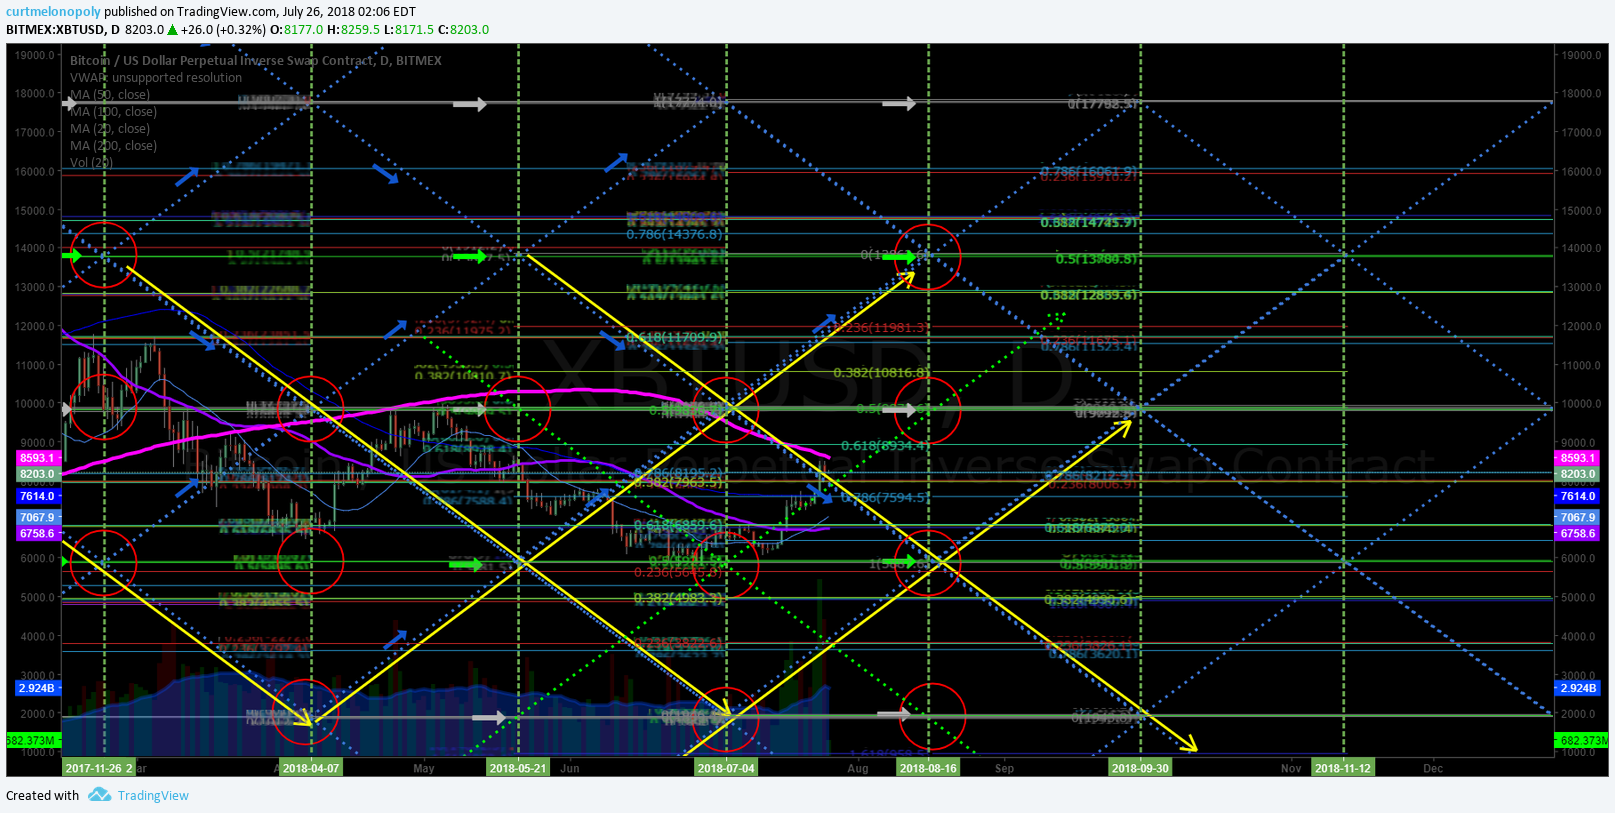
The primary method of trade we have found works with the most predictability is to wait for bitcoin to breach the upper right wall of a quadrant (the orange, blue or grey diagonal dotted lines – the thicker lines are more significant as they represent wider time-frames) and confirm over the next horizontal Fibonacci resistance. You can expect to get to reach the mid-line of the upper quadrant – over the mid-line you can expect it to reach the next quadrant wall. Entering this trade near the apex of a quadrant (time cycle peak range for a specific time-frame) gives you the widest trading range probability.
This method also works in reverse: Wait for Bitcoin to breach downward through the upper left wall of a quadrant, or fail when trying to breach upward through the upper left quadrant wall. Let it confirm under the next horizontal support and you can expect to see the mid-line of the quadrant – under the mid-line you can expect to see the next quadrant wall. Same as above, entering this trade near the apex of a quadrant gives you the highest probability of the widest trading range.
Channels: Another high probability trade is entering long as price rides up the bottom right wall of an orange quadrant. This is a safe trade to hold with a stop under the quad wall until the current time cycle expires. This trade works in reverse as well. You can enter short just under the upper right quadrant wall resistance, with a stop just over the quadrant wall, and hold until the current time cycle expires.
Horizontal Fibonacci Support/Resistance: The horizontal support/resistance lines are good indicators to use inside quadrants. The light green 0.5 Fibonacci line and the grey 1.0 or 0 Fibonacci levels (mid-lines) are the most significant. Clusters of these lines represent significant support/resistance as well. Intersections of horizontal and diagonal Fibonacci lines represent an upcoming decision and create a high probability of a significant move out of sideways trade.
Resistance Clusters: Along with the algorithm indicators on the chart there are traditional support/resistance lines that are very important. When these lines converge volatility tends to increase. Under the cluster is a high probability short. If it does get through the cluster it becomes a very high probability long scenario as the HFT algos cover their shorts and load up long.
Targets: Red circles on charting. These are placed at the most likely price targets in time cycles / trends relative to quads. These are still in very early stage of development/testing and should be used for observation only at this point. Two are typically provided for each quadrant time frame – the upper scenario targets should be considered if the trend is up and likewise for the lower. I do not recommend entering trades based on these targets. Also, at times the mid quad support / resistance line is highlighted with a target if trade is not extremely bullish or bearish.
Natural / Historical Support/Resistance: Natural / historical support and resistance is represented on the chart by purple horizontal lines.
Conventional Charting: Conventional charting should be weighed against the model(s) with all trade decisions.
In summary, our first generation Bitcoin algorithm chart model uses the following indicators (listed from most predictable to least in terms of win rate):
- Trading range created by long term algorithmic modeled quadrant support and resistance (blue dotted lines)
- Trading range between buy/sell trigger levels (grey/green arrows and solid lines)
- Directional channels formed by long term algorithmic modeled support and resistance
- Horizontal Fibonacci support and resistance (multi-colored horizontal lines)
- Conventional Natural support and resistance (purple horizontal lines)
- Long term conventional trend lines (red diagonal lines)
- Conventional MA’s
Bitcoin Algorithm – Daily Chart (Suitable for Swing Trading):
Click link to open initial chart viewer screen, then share button at bottom right of screen, then make it mine, then double click on chart body to hide or reveal indicators at bottom of chart (MACD etc).
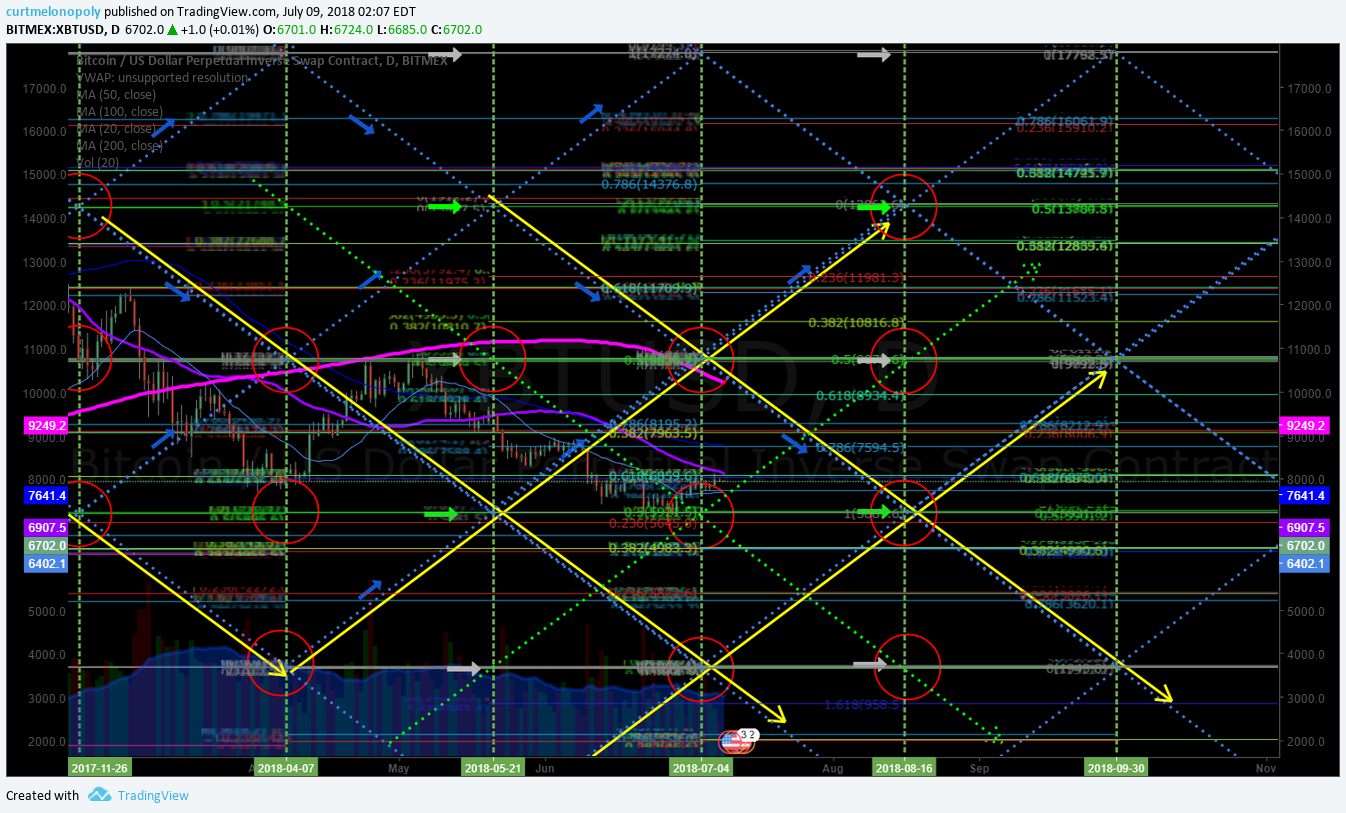
Bitcoin Algorithm. Daily chart model testing 50 MA resistance in possible turn up channel. 207 AM July 26 $BTC $XBTUSD #Bitcoin #Algorithm

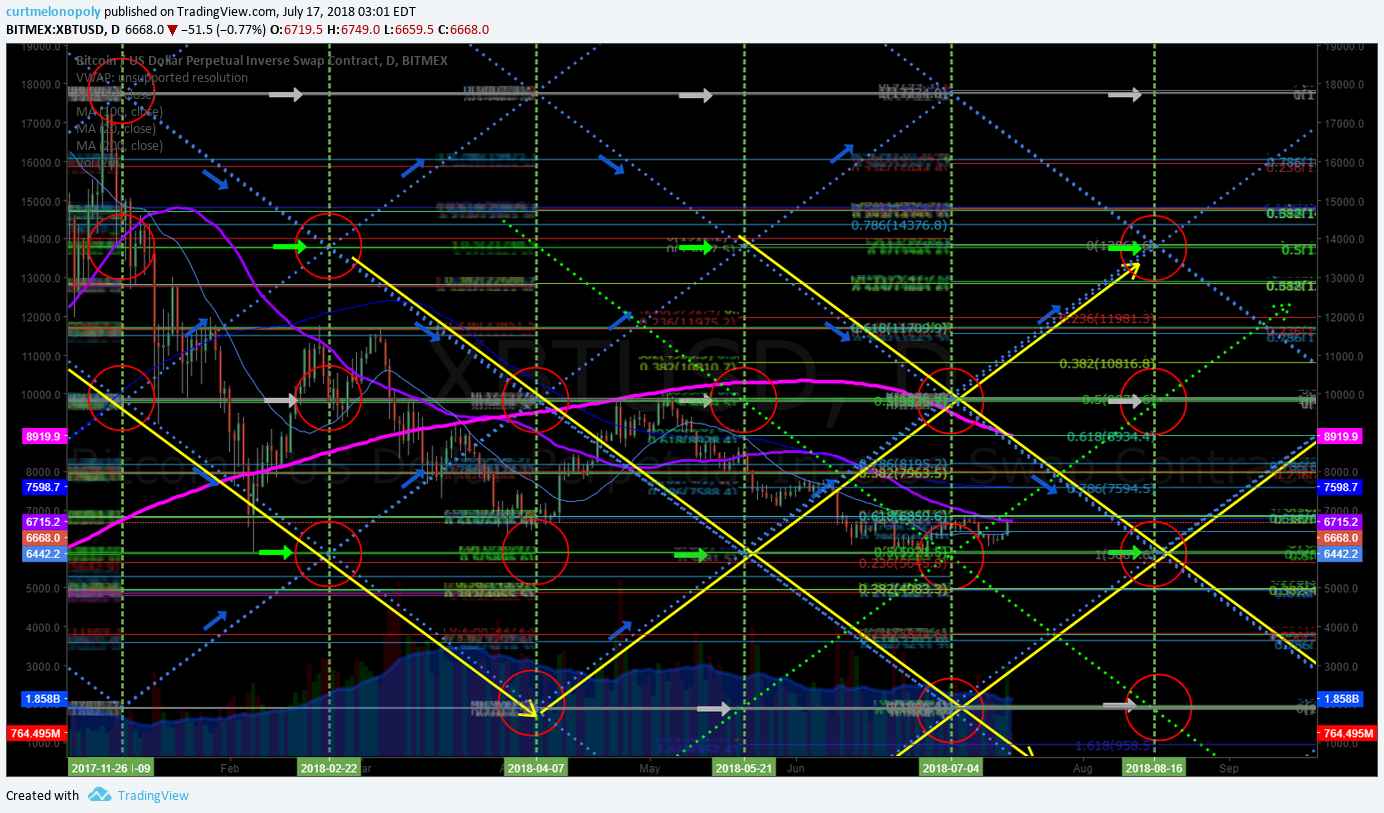
Bitcoin Algorithm. Daily chart model testing 50 MA resistance in possible turn. 302 AM July 17 $BTC $XBTUSD #Bitcoin #Algorithm

Bitcoin Trading Plan (Observations / Chart Indicators):
July 26 – As with the last two previous reports, it is a 50 MA resistance test but the trajectory of downdraft is changing and a turn is possible soon. Watching.
July 17 – As with previous, it is a 50 MA test but the trajectory of downdraft is changing and a turn is possible soon. Patiently watching.
July 9 – Trading just under 50 MA, watching for a decision at the 50 MA test for direction.
June 26 – Range bound trade – waiting for a direction.
June 19 – My current bias and trading plan is exactly what it was last report (range bound trade)
June 11 – If Bitcoin $XBTUSD dumps lower than 5900.00 then high probability it continues in down channel (illustrated down channel with yellow arrows). It holds and up channel is in play (also illustrated on charting).
On the daytrading chart below it seems too early to comment on a bias… looking for structure to build.
My personal bias is it should turn up channel, conventionally that makes sense in trading after a dump, however, the 5900.00 is key as a mid quad area.
A few tweets / comments in private Bitcoin member serve recently reflecting my bias:
And we’re there 🙂 Bitcoin $BTC #BTCUSD #Bitcoin #Charting #crypto
And we're there 🙂 Bitcoin $BTC #BTCUSD #Bitcoin #Charting #crypto pic.twitter.com/fK3u1dM7mx
— Melonopoly (@curtmelonopoly) June 10, 2018
Bitcoin Algorithm. 30 Minute Charting (Suitable for Daytrading BTC).
Bitcoin Algorithm. Daytrading 30 min chart with buy sell triggers (white arrows) 324 AM July 26 $BTC $XBTUSD #Bitcoin #Algorithm

Bitcoin Algorithm. Daytrading 30 min chart with buy sell triggers (white arrows) 327 AM July 17 $BTC $XBTUSD #Bitcoin #Algorithm

Bitcoin Algorithm. Daytrading 30 min chart with buy sell triggers (white arrows) 136 AM July 9 $BTC $XBTUSD #Bitcoin #Algorithm

Recent Bitcoin Real-Time Trade Alerts / Charting Set-up Alerts
If you are reviewing this newsletter (as a historical unlocked post) and not a member of our service and would like a tour of our private discord server (trading chat / alerts etc) or our private Twitter member $BTC alert feed let us know. You can check out our call rate for yourself. Transparent trading is important to us.
July 26 – Alert examples will be updated soon.
Intra bottom call. White arrow – alert sent. Green arrow – buy trigger. Red arrow – resistance (mid quad) on chart per alert sent. $BTC $XTUSD #Bitcoin #Cryptotrading
Intra bottom call. White arrow – alert sent. Green arrow – buy trigger. Red arrow – resistance (mid quad) on chart per alert sent. $BTC $XTUSD #Bitcoin #Cryptotrading pic.twitter.com/RM68yktgur
— Melonopoly (@curtmelonopoly) May 20, 2018
May 13 – Will post recent alerts soon when time allows.
Per recent;
April 29 – There have been many calls since bottom on our private server and private twitter feed… I’m not going to take the time to post them here right now but I will post this rant of tweets… the private member alerts I’ll post next report if time (they were all spot on alerts).
I even told ya how I knew where the bottom was. $BTC #Bitcoin #algorithm

Next should be insane trading in crypto space. Could be wrong… but I’m feelin it. #crypto $BTC $XBT $ETH $LTC #trading screenshot

Next should be insane trading in crypto space. Could be wrong… but I’m feelin it. #crypto $BTC $XBT $ETH $LTC #trading

$BTC near HOD and some bullish action on intra. Tweet screen shot.

$BTC near HOD and some bullish action on intra. $BTC #bitcoin #calls

Technical precision trading. Price target hit perfect on daytrading algorithm model charting. $BTC $XBT #Bitcoin #Crypto #Trading

Technical precision trading. Price target hit perfect on daytrading algorithm model charting. $BTC $XBT #Bitcoin #Crypto #Trading pic.twitter.com/l1pafs56QD
— Crypto the BTC Algo (@CryptotheAlgo) April 18, 2018
Bitcoin coming in to a possible buy trigger zone on daytrading chart. $BTC #Bitcoin
https://twitter.com/BTCAlerts_CT/status/978317583987429376

$BTC Bitcoin popped now 400 points since alert of support. Not a bad RR here for long test. If nothing else a day trade.
https://twitter.com/BTCAlerts_CT/status/978397655796801538
Bitcoin time price cycle peak coming April 7 – path of least resistance down target but my bias is to up. Trade price. We start trading live again Monday so I’ll broadcast our trading group moves live for this setup. $BTC #Bitcoin #trading #crypto (alerted in private member Discord server)

And the result…. price is dumping in to lower target identified on trade alert…. intrad-day getting close. Charting wins. Trader bias not so good on this one.

Ethereum Algorithm. Basic Charting Model on Daily Time Frame:
Ethereum Algorithm. Daily Chart. Price testing 50 MA resistance, in channel. On watch. July 26 26 332 AM $ETH $ETHUSD #Ethereum #Algorithm

Ethereum Algorithm. Daily Chart. 625 resistance 418 support July 9 316 AM $ETH $ETHUSD #Ethereum #Algorithm

Ethereum Algorithm. Daily Chart. Price in channel, with weak trade. On watch. June 26 434 AM $ETH $ETHUSD #Ethereum #Algorithm

Litecoin Algorithm. Basic Charting Model.
Primary buy sell triggers on Litecoin daily chart:
475.00
381.00
287.00
192.00
98.00
July 26 – No significant change to below;
Litecoin Algorithm. LTC showing signs of possible bottom turn reversal. July 17 332 AM $LTCUSD #Litecoin #Algorithm

Litecoin Algorithm. LTC still in down trend channel. July 9 324 AM $LTCUSD #Litecoin #Algorithm

Ripple Basic Algorithm Charting Model $XRP
July 26 – No noteworthy change.
July 17 – No noteworthy change.
July 9 – No noteworthy change.
May 13 – Ripple needs .932 for a chance for a bullish structured run. $XRP $XRPUSD.
I put some tighter time from Fib structure in the model for those that asked for daytrading signals.

Per recent;
May 10 – Nothing to report. Flat.
April 29 – $XRP flat but over 200 MA on daily.
BUT still great returns from 40s to near 90s WOW.
https://www.tradingview.com/chart/XRPUSD/0aDABOJz-XRP-flat-but-over-200-MA-on-daily/

Per recent;
April 22 – $XRP over .888 targets 1.31 then 1.65 mid term. Daytrading model on -deck. #ripple

Crypto News:
Crypto Markets Recover After Weekend Losses Saw Bitcoin at Lowest 2018 Level
< End of report >
Any questions give us a shout anytime!
Follow Me:
Live Twitter Alert Feed for Bitcoin Trade Set-ups: @BTCAlerts_CT, Public Feed: @cryptothealgo
To Subscribe to our Crypto Services:
Link to Services and Pricing Overview (master list).
Link to Standalone $BTC Crypto Newsletter.
Link to Real-Time Live Bitcoin Alerts (Twitter).
Link to Crypto Bundle (Alerts, Private Trading Discord Server, Newsletter).
Review historical (unlocked to public) Weekly Bitcoin Newsletter Algorithm Reporting. Scroll down landing page to get to historical reports.
Post topics; Crypto, Algorithm, BTC, Bitcoin, chart, $BTC, $BTCUSD, $XBTUSD, $BTC.X, $ETH, $LTC, $XRP, trade, price targets, time cycles
Bitcoin Algorithm (Crypto). Tues July 17. $BTC $XBTUSD $XBT $ETH $LTC $XRP #Bitcoin #Algorithm
Bitcoin Algorithm Report (Crypto). Tuesday July 17, 2018. Includes Time Cycles, Price Targets and Buy / Sell Triggers.
$BTC $BTCUSD $XBTUSD $XBT $BTC.X $ETH $LTC $XRP #Bitcoin #Crypto
Hello, my name is Crypto the Bitcoin Algorithm. Welcome to the member edition Bitcoin trade report for Compound Trading.
Like our other algorithmic chart models, I am in development and testing for coding phase to be used as an intelligent assistant for our traders. My algorithm charting model is specifically suitable for the use and purpose of trading Bitcoin $BTCUSD, Bitcoin/USD perpetual swaps $XBTUSD, Bitcoin related equities and you will find additional preliminary algorithmic modeling for $ETH, $LTC and $XRP in this report.
Note: The $XBTUSD (Bitcoin swaps) model is built on a chart from BitMEX. Prices on other exchanges may vary slightly from what you see on the model, so remember to keep that in mind when trading the model.
Notices:
- More extensive chart models for $BTCUSD, $ETHUSD, $XRPUSD, $LTCUSD and others (such as a few bitcoin related equities) will be featured in future reporting.
- Join us in our private Crypto Trading room server on discord!
- For newer users – read the blog post about how to trade Bitcoin here.
Primary Methods of Bitcoin Trade:
The primary method of trade we have found works with the most predictability is to wait for bitcoin to breach the upper right wall of a quadrant (the orange, blue or grey diagonal dotted lines – the thicker lines are more significant as they represent wider time-frames) and confirm over the next horizontal Fibonacci resistance. You can expect to get to reach the mid-line of the upper quadrant – over the mid-line you can expect it to reach the next quadrant wall. Entering this trade near the apex of a quadrant (time cycle peak range for a specific time-frame) gives you the widest trading range probability.
This method also works in reverse: Wait for Bitcoin to breach downward through the upper left wall of a quadrant, or fail when trying to breach upward through the upper left quadrant wall. Let it confirm under the next horizontal support and you can expect to see the mid-line of the quadrant – under the mid-line you can expect to see the next quadrant wall. Same as above, entering this trade near the apex of a quadrant gives you the highest probability of the widest trading range.
Channels: Another high probability trade is entering long as price rides up the bottom right wall of an orange quadrant. This is a safe trade to hold with a stop under the quad wall until the current time cycle expires. This trade works in reverse as well. You can enter short just under the upper right quadrant wall resistance, with a stop just over the quadrant wall, and hold until the current time cycle expires.
Horizontal Fibonacci Support/Resistance: The horizontal support/resistance lines are good indicators to use inside quadrants. The light green 0.5 Fibonacci line and the grey 1.0 or 0 Fibonacci levels (mid-lines) are the most significant. Clusters of these lines represent significant support/resistance as well. Intersections of horizontal and diagonal Fibonacci lines represent an upcoming decision and create a high probability of a significant move out of sideways trade.
Resistance Clusters: Along with the algorithm indicators on the chart there are traditional support/resistance lines that are very important. When these lines converge volatility tends to increase. Under the cluster is a high probability short. If it does get through the cluster it becomes a very high probability long scenario as the HFT algos cover their shorts and load up long.
Targets: Red circles on charting. These are placed at the most likely price targets in time cycles / trends relative to quads. These are still in very early stage of development/testing and should be used for observation only at this point. Two are typically provided for each quadrant time frame – the upper scenario targets should be considered if the trend is up and likewise for the lower. I do not recommend entering trades based on these targets. Also, at times the mid quad support / resistance line is highlighted with a target if trade is not extremely bullish or bearish.
Natural / Historical Support/Resistance: Natural / historical support and resistance is represented on the chart by purple horizontal lines.
Conventional Charting: Conventional charting should be weighed against the model(s) with all trade decisions.
In summary, our first generation Bitcoin algorithm chart model uses the following indicators (listed from most predictable to least in terms of win rate):
- Trading range created by long term algorithmic modeled quadrant support and resistance (blue dotted lines)
- Trading range between buy/sell trigger levels (grey/green arrows and solid lines)
- Directional channels formed by long term algorithmic modeled support and resistance
- Horizontal Fibonacci support and resistance (multi-colored horizontal lines)
- Conventional Natural support and resistance (purple horizontal lines)
- Long term conventional trend lines (red diagonal lines)
- Conventional MA’s
Bitcoin Algorithm – Daily Chart (Suitable for Swing Trading):
Click link to open initial chart viewer screen, then share button at bottom right of screen, then make it mine, then double click on chart body to hide or reveal indicators at bottom of chart (MACD etc).
Bitcoin Algorithm. Daily chart model testing 50 MA resistance in possible turn. 302 AM July 17 $BTC $XBTUSD #Bitcoin #Algorithm
Bitcoin Algorithm. Daily chart model. 208 AM July 9 $BTC $XBTUSD #Bitcoin #Algorithm

Bitcoin Trading Plan (Observations / Chart Indicators):
July 17 – As with previous, it is a 50 MA test but the trajectory of downdraft is changing and a turn is possible soon. Patiently watching.
July 9 – Trading just under 50 MA, watching for a decision at the 50 MA test for direction.
June 26 – Range bound trade – waiting for a direction.
June 19 – My current bias and trading plan is exactly what it was last report (range bound trade)
June 11 – If Bitcoin $XBTUSD dumps lower than 5900.00 then high probability it continues in down channel (illustrated down channel with yellow arrows). It holds and up channel is in play (also illustrated on charting).
On the daytrading chart below it seems too early to comment on a bias… looking for structure to build.
My personal bias is it should turn up channel, conventionally that makes sense in trading after a dump, however, the 5900.00 is key as a mid quad area.
A few tweets / comments in private Bitcoin member serve recently reflecting my bias:
And we’re there 🙂 Bitcoin $BTC #BTCUSD #Bitcoin #Charting #crypto
And we're there 🙂 Bitcoin $BTC #BTCUSD #Bitcoin #Charting #crypto pic.twitter.com/fK3u1dM7mx
— Melonopoly (@curtmelonopoly) June 10, 2018
Bitcoin Algorithm. 30 Minute Charting (Suitable for Daytrading BTC).
Bitcoin Algorithm. Daytrading 30 min chart with buy sell triggers (white arrows) 327 AM July 17 $BTC $XBTUSD #Bitcoin #Algorithm
Bitcoin Algorithm. Daytrading 30 min chart with buy sell triggers (white arrows) 136 AM July 9 $BTC $XBTUSD #Bitcoin #Algorithm
Bitcoin Algorithm. Daytrading chart with buy sell triggers (white arrows) 428 AM June 26 $BTC $XBTUSD #Bitcoin #Algorithm

Recent Bitcoin Real-Time Trade Alerts / Charting Set-up Alerts
If you are reviewing this newsletter (as a historical unlocked post) and not a member of our service and would like a tour of our private discord server (trading chat / alerts etc) or our private Twitter member $BTC alert feed let us know. You can check out our call rate for yourself. Transparent trading is important to us.
July 17 – Alert examples will be updated soon.
Intra bottom call. White arrow – alert sent. Green arrow – buy trigger. Red arrow – resistance (mid quad) on chart per alert sent. $BTC $XTUSD #Bitcoin #Cryptotrading
Intra bottom call. White arrow – alert sent. Green arrow – buy trigger. Red arrow – resistance (mid quad) on chart per alert sent. $BTC $XTUSD #Bitcoin #Cryptotrading pic.twitter.com/RM68yktgur
— Melonopoly (@curtmelonopoly) May 20, 2018
May 13 – Will post recent alerts soon when time allows.
Per recent;
April 29 – There have been many calls since bottom on our private server and private twitter feed… I’m not going to take the time to post them here right now but I will post this rant of tweets… the private member alerts I’ll post next report if time (they were all spot on alerts).
I even told ya how I knew where the bottom was. $BTC #Bitcoin #algorithm
Next should be insane trading in crypto space. Could be wrong… but I’m feelin it. #crypto $BTC $XBT $ETH $LTC #trading screenshot
Next should be insane trading in crypto space. Could be wrong… but I’m feelin it. #crypto $BTC $XBT $ETH $LTC #trading
$BTC near HOD and some bullish action on intra. Tweet screen shot.
$BTC near HOD and some bullish action on intra. $BTC #bitcoin #calls
Technical precision trading. Price target hit perfect on daytrading algorithm model charting. $BTC $XBT #Bitcoin #Crypto #Trading
Technical precision trading. Price target hit perfect on daytrading algorithm model charting. $BTC $XBT #Bitcoin #Crypto #Trading pic.twitter.com/l1pafs56QD
— Crypto the BTC Algo (@CryptotheAlgo) April 18, 2018
Bitcoin coming in to a possible buy trigger zone on daytrading chart. $BTC #Bitcoin
https://twitter.com/BTCAlerts_CT/status/978317583987429376
$BTC Bitcoin popped now 400 points since alert of support. Not a bad RR here for long test. If nothing else a day trade.
https://twitter.com/BTCAlerts_CT/status/978397655796801538
Bitcoin time price cycle peak coming April 7 – path of least resistance down target but my bias is to up. Trade price. We start trading live again Monday so I’ll broadcast our trading group moves live for this setup. $BTC #Bitcoin #trading #crypto (alerted in private member Discord server)
And the result…. price is dumping in to lower target identified on trade alert…. intrad-day getting close. Charting wins. Trader bias not so good on this one.
Ethereum Algorithm. Basic Charting Model on Daily Time Frame:
Ethereum Algorithm. Daily Chart. 625 resistance 418 support July 9 316 AM $ETH $ETHUSD #Ethereum #Algorithm
Ethereum Algorithm. Daily Chart. Price in channel, with weak trade. On watch. June 26 434 AM $ETH $ETHUSD #Ethereum #Algorithm
Per recent;
Ethereum Algorithm. Daily Chart. Price may test upside moving averages resistance. On watch. June 19 350 AM $ETH $ETHUSD #Ethereum #Algorithm

Litecoin Algorithm. Basic Charting Model.
Primary buy sell triggers on Litecoin daily chart:
475.00
381.00
287.00
192.00
98.00
Litecoin Algorithm. LTC showing signs of possible bottom turn reversal. July 17 332 AM $LTCUSD #Litecoin #Algorithm
Litecoin Algorithm. LTC still in down trend channel. July 9 324 AM $LTCUSD #Litecoin #Algorithm
Ripple Basic Algorithm Charting Model $XRP
July 17 – No noteworthy change.
July 9 – No noteworthy change.
May 13 – Ripple needs .932 for a chance for a bullish structured run. $XRP $XRPUSD.
I put some tighter time from Fib structure in the model for those that asked for daytrading signals.
Per recent;
May 10 – Nothing to report. Flat.
April 29 – $XRP flat but over 200 MA on daily.
BUT still great returns from 40s to near 90s WOW.
https://www.tradingview.com/chart/XRPUSD/0aDABOJz-XRP-flat-but-over-200-MA-on-daily/
Per recent;
April 22 – $XRP over .888 targets 1.31 then 1.65 mid term. Daytrading model on -deck. #ripple
Crypto News:
Crypto Markets Recover After Weekend Losses Saw Bitcoin at Lowest 2018 Level
< End of report >
Any questions give us a shout anytime!
Follow Me:
Live Twitter Alert Feed for Bitcoin Trade Set-ups: @BTCAlerts_CT, Public Feed: @cryptothealgo
To Subscribe to our Crypto Services:
Link to Services and Pricing Overview (master list).
Link to Standalone $BTC Crypto Newsletter.
Link to Real-Time Live Bitcoin Alerts (Twitter).
Link to Crypto Bundle (Alerts, Private Trading Discord Server, Newsletter).
Review historical (unlocked to public) Weekly Bitcoin Newsletter Algorithm Reporting. Scroll down landing page to get to historical reports.
Post topics; Crypto, Algorithm, BTC, Bitcoin, chart, $BTC, $BTCUSD, $XBTUSD, $BTC.X, $ETH, $LTC, $XRP, trade, price targets, time cycles
Bitcoin Algorithm (Crypto). Mon July 9. $BTC $XBTUSD $XBT $ETH $LTC $XRP #Bitcoin #Algorithm
Bitcoin Algorithm Report (Crypto). Monday July 9, 2018. Includes Time Cycles, Price Targets and Buy / Sell Triggers.
$BTC $BTCUSD $XBTUSD $XBT $BTC.X $ETH $LTC $XRP #Bitcoin #Crypto
Hello, my name is Crypto the Bitcoin Algorithm. Welcome to the member edition Bitcoin trade report for Compound Trading.
Like our other algorithmic chart models, I am in development and testing for coding phase to be used as an intelligent assistant for our traders. My algorithm charting model is specifically suitable for the use and purpose of trading Bitcoin $BTCUSD, Bitcoin/USD perpetual swaps $XBTUSD, Bitcoin related equities and you will find additional preliminary algorithmic modeling for $ETH, $LTC and $XRP in this report.
Note: The $XBTUSD (Bitcoin swaps) model is built on a chart from BitMEX. Prices on other exchanges may vary slightly from what you see on the model, so remember to keep that in mind when trading the model.
Notices:
- Our 24 hour crypto trading desk is live and this team will be alerting to feeds this week. This team of three is also responsible for the development and coding of our algorithms and alerting to realtime Twitter alert feeds. Read more here; https://compoundtrading.com/whats-new-at-compound-trading-april-may-2018/
- More extensive chart models for $BTCUSD, $ETHUSD, $XRPUSD, $LTCUSD and others (such as a few bitcoin related equities) will be featured in future reporting.
- Join us in our private Crypto Trading room server on discord!
- For newer users – read the blog post about how to trade Bitcoin here.
Primary Methods of Bitcoin Trade:
The primary method of trade we have found works with the most predictability is to wait for bitcoin to breach the upper right wall of a quadrant (the orange, blue or grey diagonal dotted lines – the thicker lines are more significant as they represent wider time-frames) and confirm over the next horizontal Fibonacci resistance. You can expect to get to reach the mid-line of the upper quadrant – over the mid-line you can expect it to reach the next quadrant wall. Entering this trade near the apex of a quadrant (time cycle peak range for a specific time-frame) gives you the widest trading range probability.
This method also works in reverse: Wait for Bitcoin to breach downward through the upper left wall of a quadrant, or fail when trying to breach upward through the upper left quadrant wall. Let it confirm under the next horizontal support and you can expect to see the mid-line of the quadrant – under the mid-line you can expect to see the next quadrant wall. Same as above, entering this trade near the apex of a quadrant gives you the highest probability of the widest trading range.
Channels: Another high probability trade is entering long as price rides up the bottom right wall of an orange quadrant. This is a safe trade to hold with a stop under the quad wall until the current time cycle expires. This trade works in reverse as well. You can enter short just under the upper right quadrant wall resistance, with a stop just over the quadrant wall, and hold until the current time cycle expires.
Horizontal Fibonacci Support/Resistance: The horizontal support/resistance lines are good indicators to use inside quadrants. The light green 0.5 Fibonacci line and the grey 1.0 or 0 Fibonacci levels (mid-lines) are the most significant. Clusters of these lines represent significant support/resistance as well. Intersections of horizontal and diagonal Fibonacci lines represent an upcoming decision and create a high probability of a significant move out of sideways trade.
Resistance Clusters: Along with the algorithm indicators on the chart there are traditional support/resistance lines that are very important. When these lines converge volatility tends to increase. Under the cluster is a high probability short. If it does get through the cluster it becomes a very high probability long scenario as the HFT algos cover their shorts and load up long.
Targets: Red circles on charting. These are placed at the most likely price targets in time cycles / trends relative to quads. These are still in very early stage of development/testing and should be used for observation only at this point. Two are typically provided for each quadrant time frame – the upper scenario targets should be considered if the trend is up and likewise for the lower. I do not recommend entering trades based on these targets. Also, at times the mid quad support / resistance line is highlighted with a target if trade is not extremely bullish or bearish.
Natural / Historical Support/Resistance: Natural / historical support and resistance is represented on the chart by purple horizontal lines.
Conventional Charting: Conventional charting should be weighed against the model(s) with all trade decisions.
In summary, our first generation Bitcoin algorithm chart model uses the following indicators (listed from most predictable to least in terms of win rate):
- Trading range created by long term algorithmic modeled quadrant support and resistance (blue dotted lines)
- Trading range between buy/sell trigger levels (grey/green arrows and solid lines)
- Directional channels formed by long term algorithmic modeled support and resistance
- Horizontal Fibonacci support and resistance (multi-colored horizontal lines)
- Conventional Natural support and resistance (purple horizontal lines)
- Long term conventional trend lines (red diagonal lines)
- Conventional MA’s
Bitcoin Algorithm – Daily Chart (Suitable for Swing Trading):
Click link to open initial chart viewer screen, then share button at bottom right of screen, then make it mine, then double click on chart body to hide or reveal indicators at bottom of chart (MACD etc).
Bitcoin Algorithm. Daily chart model. 208 AM July 9 $BTC $XBTUSD #Bitcoin #Algorithm
Per recent;
Bitcoin Algorithm. Trading just above a buy sell trigger, awaiting decision. 412 AM June 26 $BTC $XBTUSD #Bitcoin #Algorithm

Bitcoin Trading Plan (Observations / Chart Indicators):
July 9 – Trading just under 50 MA, watching for a decision at the 50 MA test for direction.
June 26 – Range bound trade – waiting for a direction.
June 19 – My current bias and trading plan is exactly what it was last report (range bound trade)
June 11 – If Bitcoin $XBTUSD dumps lower than 5900.00 then high probability it continues in down channel (illustrated down channel with yellow arrows). It holds and up channel is in play (also illustrated on charting).
On the daytrading chart below it seems too early to comment on a bias… looking for structure to build.
My personal bias is it should turn up channel, conventionally that makes sense in trading after a dump, however, the 5900.00 is key as a mid quad area.
A few tweets / comments in private Bitcoin member serve recently reflecting my bias:
And we’re there 🙂 Bitcoin $BTC #BTCUSD #Bitcoin #Charting #crypto
And we're there 🙂 Bitcoin $BTC #BTCUSD #Bitcoin #Charting #crypto pic.twitter.com/fK3u1dM7mx
— Melonopoly (@curtmelonopoly) June 10, 2018
June 4 – No change.
Bitcoin Algorithm. 30 Minute Charting (Suitable for Daytrading BTC).
Bitcoin Algorithm. Daytrading 30 min chart with buy sell triggers (white arrows) 136 AM July 9 $BTC $XBTUSD #Bitcoin #Algorithm
Bitcoin Algorithm. Daytrading chart with buy sell triggers (white arrows) 428 AM June 26 $BTC $XBTUSD #Bitcoin #Algorithm
Per recent;
Bitcoin Algorithm. Daytrading chart with buy sell triggers (white arrows) 325 AM June 19 2018 $BTC $XBTUSD #Bitcoin #Algorithm
Per last report the main watch here was the 200 MA – price now has the ma so this is on high watch now.

Recent Bitcoin Real-Time Trade Alerts / Charting Set-up Alerts
If you are reviewing this newsletter (as a historical unlocked post) and not a member of our service and would like a tour of our private discord server (trading chat / alerts etc) or our private Twitter member $BTC alert feed let us know. You can check out our call rate for yourself. Transparent trading is important to us.
July 9 – Alert examples will be updated soon.
June 26 – Alert examples will be updated soon.
Intra bottom call. White arrow – alert sent. Green arrow – buy trigger. Red arrow – resistance (mid quad) on chart per alert sent. $BTC $XTUSD #Bitcoin #Cryptotrading
Intra bottom call. White arrow – alert sent. Green arrow – buy trigger. Red arrow – resistance (mid quad) on chart per alert sent. $BTC $XTUSD #Bitcoin #Cryptotrading pic.twitter.com/RM68yktgur
— Melonopoly (@curtmelonopoly) May 20, 2018
May 13 – Will post recent alerts soon when time allows.
Per recent;
April 29 – There have been many calls since bottom on our private server and private twitter feed… I’m not going to take the time to post them here right now but I will post this rant of tweets… the private member alerts I’ll post next report if time (they were all spot on alerts).
I even told ya how I knew where the bottom was. $BTC #Bitcoin #algorithm
Next should be insane trading in crypto space. Could be wrong… but I’m feelin it. #crypto $BTC $XBT $ETH $LTC #trading screenshot
Next should be insane trading in crypto space. Could be wrong… but I’m feelin it. #crypto $BTC $XBT $ETH $LTC #trading
$BTC near HOD and some bullish action on intra. Tweet screen shot.
$BTC near HOD and some bullish action on intra. $BTC #bitcoin #calls
Technical precision trading. Price target hit perfect on daytrading algorithm model charting. $BTC $XBT #Bitcoin #Crypto #Trading
Technical precision trading. Price target hit perfect on daytrading algorithm model charting. $BTC $XBT #Bitcoin #Crypto #Trading pic.twitter.com/l1pafs56QD
— Crypto the BTC Algo (@CryptotheAlgo) April 18, 2018
Bitcoin coming in to a possible buy trigger zone on daytrading chart. $BTC #Bitcoin
https://twitter.com/BTCAlerts_CT/status/978317583987429376
$BTC Bitcoin popped now 400 points since alert of support. Not a bad RR here for long test. If nothing else a day trade.
https://twitter.com/BTCAlerts_CT/status/978397655796801538
Bitcoin time price cycle peak coming April 7 – path of least resistance down target but my bias is to up. Trade price. We start trading live again Monday so I’ll broadcast our trading group moves live for this setup. $BTC #Bitcoin #trading #crypto (alerted in private member Discord server)
And the result…. price is dumping in to lower target identified on trade alert…. intrad-day getting close. Charting wins. Trader bias not so good on this one.
Ethereum Algorithm. Basic Charting Model on Daily Time Frame:
Ethereum Algorithm. Daily Chart. 625 resistance 418 support July 9 316 AM $ETH $ETHUSD #Ethereum #Algorithm
Ethereum Algorithm. Daily Chart. Price in channel, with weak trade. On watch. June 26 434 AM $ETH $ETHUSD #Ethereum #Algorithm
Per recent;
Ethereum Algorithm. Daily Chart. Price may test upside moving averages resistance. On watch. June 19 350 AM $ETH $ETHUSD #Ethereum #Algorithm
Litecoin Algorithm. Basic Charting Model.
Primary buy sell triggers on Litecoin daily chart:
475.00
381.00
287.00
192.00
98.00
Litecoin Algorithm. LTC still in down trend channel. July 9 324 AM $LTCUSD #Litecoin #Algorithm
Litecoin Algorithm. LTC channel trade so far here. June 26 438 AM $LTCUSD #Litecoin #Algorithm

Per recent;
Litecoin Algorithm. LTC testing mid quad support. On high watch here. June 19 359 AM $LTCUSD #Litecoin #Algorithm

Ripple Basic Algorithm Charting Model $XRP
July 9 – No noteworthy change.
May 13 – Ripple needs .932 for a chance for a bullish structured run. $XRP $XRPUSD.
I put some tighter time from Fib structure in the model for those that asked for daytrading signals.
Per recent;
May 10 – Nothing to report. Flat.
April 29 – $XRP flat but over 200 MA on daily.
BUT still great returns from 40s to near 90s WOW.
https://www.tradingview.com/chart/XRPUSD/0aDABOJz-XRP-flat-but-over-200-MA-on-daily/
Per recent;
April 22 – $XRP over .888 targets 1.31 then 1.65 mid term. Daytrading model on -deck. #ripple
Crypto News:
Crypto Markets Recover After Weekend Losses Saw Bitcoin at Lowest 2018 Level
< End of report >
Any questions give us a shout anytime!
Follow Me:
Live Twitter Alert Feed for Bitcoin Trade Set-ups: @BTCAlerts_CT, Public Feed: @cryptothealgo
To Subscribe to our Crypto Services:
Link to Services and Pricing Overview (master list).
Link to Standalone $BTC Crypto Newsletter.
Link to Real-Time Live Bitcoin Alerts (Twitter).
Link to Crypto Bundle (Alerts, Private Trading Discord Server, Newsletter).
Review historical (unlocked to public) Weekly Bitcoin Newsletter Algorithm Reporting. Scroll down landing page to get to historical reports.
Post topics; Crypto, Algorithm, BTC, Bitcoin, chart, $BTC, $BTCUSD, $XBTUSD, $BTC.X, $ETH, $LTC, $XRP, trade, price targets, time cycles
Bitcoin Algorithm (Crypto). Tues June 26. Crypto Recovers After Weekend Losses $BTC $XBTUSD $XBT $ETH $LTC $XRP #Bitcoin #Algorithm
Bitcoin Algorithm Report (Crypto). Tuesday June 26, 2018. Includes Time Cycles, Price Targets and Buy / Sell Triggers.
$BTC $BTCUSD $XBTUSD $XBT $BTC.X $ETH $LTC $XRP #Bitcoin #Crypto
Hello, my name is Crypto the Bitcoin Algorithm. Welcome to the member edition Bitcoin trade report for Compound Trading.
Like our other algorithmic chart models, I am in development and testing for coding phase to be used as an intelligent assistant for our traders. My algorithm charting model is specifically suitable for the use and purpose of trading Bitcoin $BTCUSD, Bitcoin/USD perpetual swaps $XBTUSD, Bitcoin related equities and you will find additional preliminary algorithmic modeling for $ETH, $LTC and $XRP in this report.
Note: The $XBTUSD (Bitcoin swaps) model is built on a chart from BitMEX. Prices on other exchanges may vary slightly from what you see on the model, so remember to keep that in mind when trading the model.
Notices:
- Our 24 hour crypto trading desk was launched May 15 – over time this team will start alerting to feeds. This team of three is also responsible for the development and coding of our algorithms and alerting to realtime Twitter alert feeds. Read more here; https://compoundtrading.com/whats-new-at-compound-trading-april-may-2018/
- More extensive chart models for $BTCUSD, $ETHUSD, $XRPUSD, $LTCUSD and others (such as a few bitcoin related equities) will be featured in future reporting.
- Join us in our private Crypto Trading room server on discord!
- For newer users – read the blog post about how to trade Bitcoin here.
Primary Methods of Bitcoin Trade:
The primary method of trade we have found works with the most predictability is to wait for bitcoin to breach the upper right wall of a quadrant (the orange, blue or grey diagonal dotted lines – the thicker lines are more significant as they represent wider time-frames) and confirm over the next horizontal Fibonacci resistance. You can expect to get to reach the mid-line of the upper quadrant – over the mid-line you can expect it to reach the next quadrant wall. Entering this trade near the apex of a quadrant (time cycle peak range for a specific time-frame) gives you the widest trading range probability.
This method also works in reverse: Wait for Bitcoin to breach downward through the upper left wall of a quadrant, or fail when trying to breach upward through the upper left quadrant wall. Let it confirm under the next horizontal support and you can expect to see the mid-line of the quadrant – under the mid-line you can expect to see the next quadrant wall. Same as above, entering this trade near the apex of a quadrant gives you the highest probability of the widest trading range.
Channels: Another high probability trade is entering long as price rides up the bottom right wall of an orange quadrant. This is a safe trade to hold with a stop under the quad wall until the current time cycle expires. This trade works in reverse as well. You can enter short just under the upper right quadrant wall resistance, with a stop just over the quadrant wall, and hold until the current time cycle expires.
Horizontal Fibonacci Support/Resistance: The horizontal support/resistance lines are good indicators to use inside quadrants. The light green 0.5 Fibonacci line and the grey 1.0 or 0 Fibonacci levels (mid-lines) are the most significant. Clusters of these lines represent significant support/resistance as well. Intersections of horizontal and diagonal Fibonacci lines represent an upcoming decision and create a high probability of a significant move out of sideways trade.
Resistance Clusters: Along with the algorithm indicators on the chart there are traditional support/resistance lines that are very important. When these lines converge volatility tends to increase. Under the cluster is a high probability short. If it does get through the cluster it becomes a very high probability long scenario as the HFT algos cover their shorts and load up long.
Targets: Red circles on charting. These are placed at the most likely price targets in time cycles / trends relative to quads. These are still in very early stage of development/testing and should be used for observation only at this point. Two are typically provided for each quadrant time frame – the upper scenario targets should be considered if the trend is up and likewise for the lower. I do not recommend entering trades based on these targets. Also, at times the mid quad support / resistance line is highlighted with a target if trade is not extremely bullish or bearish.
Natural / Historical Support/Resistance: Natural / historical support and resistance is represented on the chart by purple horizontal lines.
Conventional Charting: Conventional charting should be weighed against the model(s) with all trade decisions.
In summary, our first generation Bitcoin algorithm chart model uses the following indicators (listed from most predictable to least in terms of win rate):
- Trading range created by long term algorithmic modeled quadrant support and resistance (blue dotted lines)
- Trading range between buy/sell trigger levels (grey/green arrows and solid lines)
- Directional channels formed by long term algorithmic modeled support and resistance
- Horizontal Fibonacci support and resistance (multi-colored horizontal lines)
- Conventional Natural support and resistance (purple horizontal lines)
- Long term conventional trend lines (red diagonal lines)
- Conventional MA’s
Bitcoin Algorithm – Daily Chart (Suitable for Swing Trading):
Click link to open initial chart viewer screen, then share button at bottom right of screen, then make it mine, then double click on chart body to hide or reveal indicators at bottom of chart (MACD etc).
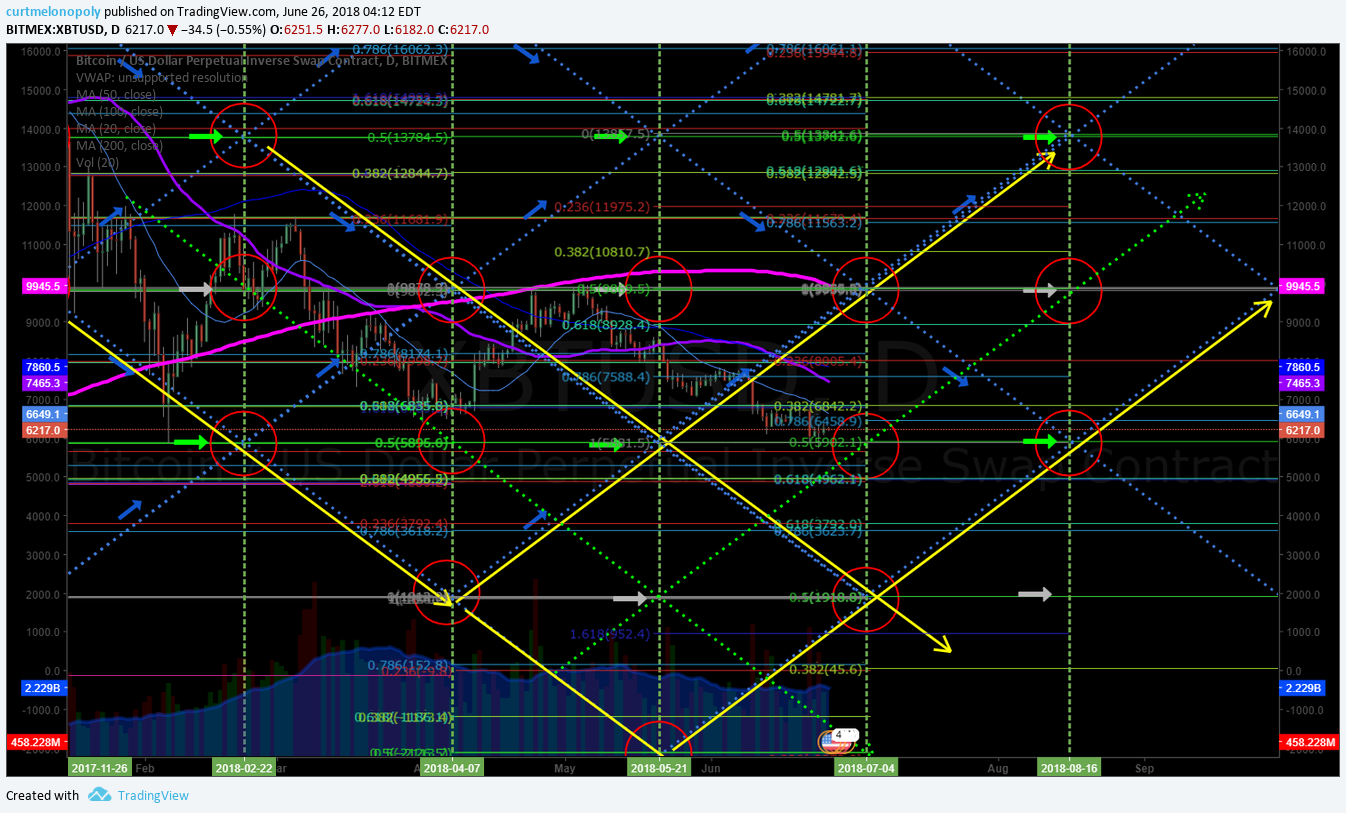
Bitcoin Algorithm. Trading just above a buy sell trigger, awaiting decision. 412 AM June 26 $BTC $XBTUSD #Bitcoin #Algorithm
Per recent;
Bitcoin Algorithm. Watching for a turn up prospective channel.. 247 AM June 19 2018 $BTC $XBTUSD #Bitcoin #Algorithm

Bitcoin Price Targets on Daily Chart Model ($XBTUSD):
Trading 6688.50 intraday;
July 4 Bitcoin Price Targets:
Bearish 5902.00 (out of current algorithmic channel not yet tested)
Moderate 9808.00
Bullish 13821.00
Extreme Bullish 17745.00
Bitcoin Trading Plan (Observations / Chart Indicators):
June 26 – Range bound trade – waiting for a direction.
June 19 – My current bias and trading plan is exactly what it was last report (range bound trade)
June 11 – If Bitcoin $XBTUSD dumps lower than 5900.00 then high probability it continues in down channel (illustrated down channel with yellow arrows). It holds and up channel is in play (also illustrated on charting).
On the daytrading chart below it seems too early to comment on a bias… looking for structure to build.
My personal bias is it should turn up channel, conventionally that makes sense in trading after a dump, however, the 5900.00 is key as a mid quad area.
A few tweets / comments in private Bitcoin member serve recently reflecting my bias:
And we’re there 🙂 Bitcoin $BTC #BTCUSD #Bitcoin #Charting #crypto
And we're there 🙂 Bitcoin $BTC #BTCUSD #Bitcoin #Charting #crypto pic.twitter.com/fK3u1dM7mx
— Melonopoly (@curtmelonopoly) June 10, 2018
June 4 – No change.
Bitcoin Algorithm. 30 Minute Charting (Suitable for Daytrading BTC).
Bitcoin Algorithm. Daytrading chart with buy sell triggers (white arrows) 428 AM June 26 $BTC $XBTUSD #Bitcoin #Algorithm
Per recent;
Bitcoin Algorithm. Daytrading chart with buy sell triggers (white arrows) 325 AM June 19 2018 $BTC $XBTUSD #Bitcoin #Algorithm
Per last report the main watch here was the 200 MA – price now has the ma so this is on high watch now.
Per recent;
Bitcoin Algorithm. Daytrading chart a bit sloppy but levels in play. Watch the buy sell triggers (white arrows) 848 PM June 11 2018 $BTC $XBTUSD #Bitcoin #Algorithm
The 200 MA coming down to meet price at top of chart (pink line) seems an important watch as it has been tested as resistance in this time-frame and previously failed. If price regains the 200 MA then likely we see a reversal.

Per recent;
Bitcoin Trading Plan – Long adds scenario, trim in to mid quad resistance (white arrows at key Fibonacci resistance lines) add above to next. June 3, 18 714 PM #Bitcoin #Algorithm 2018 $BTC $XBTUSD
https://www.tradingview.com/chart/XBTUSD/fdHYeyER-Bitcoin-Daytrading-Temporary-Chart/

Recent Bitcoin Real-Time Trade Alerts / Charting Set-up Alerts
If you are reviewing this newsletter (as a historical unlocked post) and not a member of our service and would like a tour of our private discord server (trading chat / alerts etc) or our private Twitter member $BTC alert feed let us know. You can check out our call rate for yourself. Transparent trading is important to us.
June 26 – Alert examples will be updated soon.
Intra bottom call. White arrow – alert sent. Green arrow – buy trigger. Red arrow – resistance (mid quad) on chart per alert sent. $BTC $XTUSD #Bitcoin #Cryptotrading
Intra bottom call. White arrow – alert sent. Green arrow – buy trigger. Red arrow – resistance (mid quad) on chart per alert sent. $BTC $XTUSD #Bitcoin #Cryptotrading pic.twitter.com/RM68yktgur
— Melonopoly (@curtmelonopoly) May 20, 2018
May 13 – Will post recent alerts soon when time allows.
Per recent;
April 29 – There have been many calls since bottom on our private server and private twitter feed… I’m not going to take the time to post them here right now but I will post this rant of tweets… the private member alerts I’ll post next report if time (they were all spot on alerts).
I even told ya how I knew where the bottom was. $BTC #Bitcoin #algorithm
Next should be insane trading in crypto space. Could be wrong… but I’m feelin it. #crypto $BTC $XBT $ETH $LTC #trading screenshot
Next should be insane trading in crypto space. Could be wrong… but I’m feelin it. #crypto $BTC $XBT $ETH $LTC #trading
$BTC near HOD and some bullish action on intra. Tweet screen shot.
$BTC near HOD and some bullish action on intra. $BTC #bitcoin #calls
Technical precision trading. Price target hit perfect on daytrading algorithm model charting. $BTC $XBT #Bitcoin #Crypto #Trading
Technical precision trading. Price target hit perfect on daytrading algorithm model charting. $BTC $XBT #Bitcoin #Crypto #Trading pic.twitter.com/l1pafs56QD
— Crypto the BTC Algo (@CryptotheAlgo) April 18, 2018
Bitcoin coming in to a possible buy trigger zone on daytrading chart. $BTC #Bitcoin
https://twitter.com/BTCAlerts_CT/status/978317583987429376
$BTC Bitcoin popped now 400 points since alert of support. Not a bad RR here for long test. If nothing else a day trade.
https://twitter.com/BTCAlerts_CT/status/978397655796801538
Bitcoin time price cycle peak coming April 7 – path of least resistance down target but my bias is to up. Trade price. We start trading live again Monday so I’ll broadcast our trading group moves live for this setup. $BTC #Bitcoin #trading #crypto (alerted in private member Discord server)
And the result…. price is dumping in to lower target identified on trade alert…. intrad-day getting close. Charting wins. Trader bias not so good on this one.
Ethereum Algorithm. Basic Charting Model on Daily Time Frame:
Ethereum Algorithm. Daily Chart. Price in channel, with weak trade. On watch. June 26 434 AM $ETH $ETHUSD #Ethereum #Algorithm
Per recent;
Ethereum Algorithm. Daily Chart. Price may test upside moving averages resistance. On watch. June 19 350 AM $ETH $ETHUSD #Ethereum #Algorithm
Per recent;
Ethereum Algorithm. Daily Chart has exactly the same structural scenario as BTC chart. June 11 911 PM $ETH $ETHUSD #Ethereum #Algorithm

Litecoin Algorithm. Basic Charting Model.
Primary buy sell triggers on Litecoin daily chart:
475.00
381.00
287.00
192.00
98.00
Litecoin Algorithm. LTC channel trade so far here. June 26 438 AM $LTCUSD #Litecoin #Algorithm
Per recent;
Litecoin Algorithm. LTC testing mid quad support. On high watch here. June 19 359 AM $LTCUSD #Litecoin #Algorithm
Per recent;
June 11 – No significant change in Litecoin Algorithm structure on charting model, refer to chart link below for real-time charting.

Ripple Basic Algorithm Charting Model $XRP
June 26 – No noteworthy change as with previous.
June 19 – No noteworthy change as with previous.
June 11 – No noteworthy change as with previous.
June 4 – No noteworthy change as with previous.
May 30 – No noteworthy change in charting – use link below.
May 21 – No noteworthy change in charting – use link below.
May 13 – Ripple needs .932 for a chance for a bullish structured run. $XRP $XRPUSD.
I put some tighter time from Fib structure in the model for those that asked for daytrading signals.
Per recent;
May 10 – Nothing to report. Flat.
April 29 – $XRP flat but over 200 MA on daily.
BUT still great returns from 40s to near 90s WOW.
https://www.tradingview.com/chart/XRPUSD/0aDABOJz-XRP-flat-but-over-200-MA-on-daily/
Per recent;
April 22 – $XRP over .888 targets 1.31 then 1.65 mid term. Daytrading model on -deck. #ripple
Crypto News:
Crypto Markets Recover After Weekend Losses Saw Bitcoin at Lowest 2018 Level
< End of report >
Any questions give us a shout anytime!
Follow Me:
Live Twitter Alert Feed for Bitcoin Trade Set-ups: @BTCAlerts_CT, Public Feed: @cryptothealgo
To Subscribe to our Crypto Services:
Link to Services and Pricing Overview (master list).
Link to Standalone $BTC Crypto Newsletter.
Link to Real-Time Live Bitcoin Alerts (Twitter).
Link to Crypto Bundle (Alerts, Private Trading Discord Server, Newsletter).
Review historical (unlocked to public) Weekly Bitcoin Newsletter Algorithm Reporting. Scroll down landing page to get to historical reports.
Post topics; Crypto, Algorithm, BTC, Bitcoin, chart, $BTC, $BTCUSD, $XBTUSD, $BTC.X, $ETH, $LTC, $XRP, trade, price targets, time cycles