Skip to content

Compound Trading Group

  • About
  • White Paper
  • Returns
  • News
    • NOTICE of Online Information Meetings
  • Order
    • Terms
  • About
  • White Paper
  • Returns
  • News
    • NOTICE of Online Information Meetings
  • Order
    • Terms

Tag Archives: $UWT

  1.   »  
  2. Tag Archives: $UWT

Tag: $UWT

Member Oil Trade Update Thurs Dec 29 Charting Algo FX: $USOIL $WTIC – $USO $CL_F $UWT $DWT $UCO $SCO $ERX $ERY $GUSH $DRIP

Member Oil Trade Update Thurs Dec 29 Charting Algo FX: $USOIL $WTIC – $USO $CL_F $UWT $DWT $UCO $SCO $ERX $ERY $GUSH $DRIP

December 29, 2016January 2, 2017 Epic the AlgoCrude Oil Trading Algorithm (EPIC)$CL_F, $DRIP, $ERX, $ERY, $GUSH, $UCO, $USO, $UWT, Algo, Algorithm, Chart, Crude Oil FX: $USOIL $WTI, DWT, EPIC the Oil Algo, Fibonacci, Indicators, Targets, Trading Room

Thurs Dec 29, 2016 EPIC the Oil Algo Oil Report (Member Edition). FX: $USOIL $WTIC – $USO $CL_F $UWT $DWT $UCO $SCO $ERX $ERY $GUSH $DRIP

Welcome to my new FX: $USOIL $WTI oil trade report. My name is EPIC the Oil Algo.

NOTICES:

NEW SERVICE OPTIONS: My algorithmic modeling daily oil reports are now available separate of the 24 hour oil trade room / oil reports bundle.

CHARTING: Charts will be cluttered for a number of days with technicians processing multiple calculations for 2017 algorithmic models.  

ALERTS: We are having a technical coding issue with SMS text / email alert launch – will be resolved soon! For now we are emailing alerts as time allows.

MUST READ: There is a feature blog post at this link, “Why our Stock Algorithms are Different than Most“. If you are viewing our algorithmic model charting it is a must read.

MULTI-USERS: Institutional / commercial platform now available.

PATENT PHASE: I am now in patent application phase. Stay tuned for agreements concerning disclosure and use coming to members.

24 HOUR TRADE ROOM: My charting transitions from FX $USOIL $WTI to 24hr crude oil futures early 2017. My sub service w incl 24 hr crude oil trade room.

ACCESS: My proprietary services transitioned recently from public inaugural to subscriber only access. All rates for existing members for all service prices (including price increases) will be grandfathered in perpetuity (view website products page for conditions). Early 2017 when my 24 hour futures trading room opens along with 24 hour live charting I will have a rate increase but as with recent the roll-over existing members will be grandfathered at locked-in current rates.

SOFTWARE: My algorithmic charting is going to developer coding phase early 2017 for our trader’s dashboard program. Please review my algorithm development process and about my oil algorithm story on our website www.compoundtrading.com and my oil algo charting posts on my Twitter feed and this blog.

HOW MY ALGORITHM WORKS: I am an algorithm in development. My math is based on traditional indicators (up to fifty at any given time each weighted on win ratio merit – all not shown on chart at any given time) – such as simple math calculations relating to price and volume, Fibonacci, simple pivots, moving averages, Gann, Schiff and various other charting, geometric and mathematical factors. I do not yet have AI or Geo Political integration – only math as it relates to traditional indicators with the primary goal being probabilities. I am not a high frequency or bot type algorithm – I am represented on and used on a traditional trading chart as one would normally use as a probability indicator. The goal is to provide our trader’s with an edge when triggering entries and exits on trades with instruments that rely on the price of crude oil (specifically FX: $USOIL $WTI and transitioning to futures in the new year in our new 24 hour oil trading room).

Below you will find my simplified view of levels that can be used on a traditional chart (both intra-day and as a swing trader or investor). This work, and subsequent trading, should be considered one decision at a time, “if this happens then this or this are my targets”… price – trigger – trade and so on. Questions to; [email protected], message our lead trader on Twitter, or message a lead trader privately in the trade room.

EVERY CALL WE MAKE, EVERY PUBLIC INTERACTION, REPRESENTATION OF TRADE (ON EVERY VENUE) IS VIDEO RECORDED (TRADING ROOM), ON SOCIAL MEDIA OR ON BLOG / WEBSITE TIME-STAMPED FOR PERMANENT RECORD AND ABSOLUTE TRANSPARENCY. PLEASE ALSO REFER TO OUR PUBLIC DISCLOSURE https://compoundtrading.com/disclosure-disclaimer/.

FX: $USOIL $WTI Observations:

Below is the link for the live EPIC the Oil Algo Live Trading Chart for Thursday Dec 29, 2016.

https://www.tradingview.com/chart/USOIL/GYbCMwh8-EPIC-the-OIL-ALGO-MEMBER-CHART/

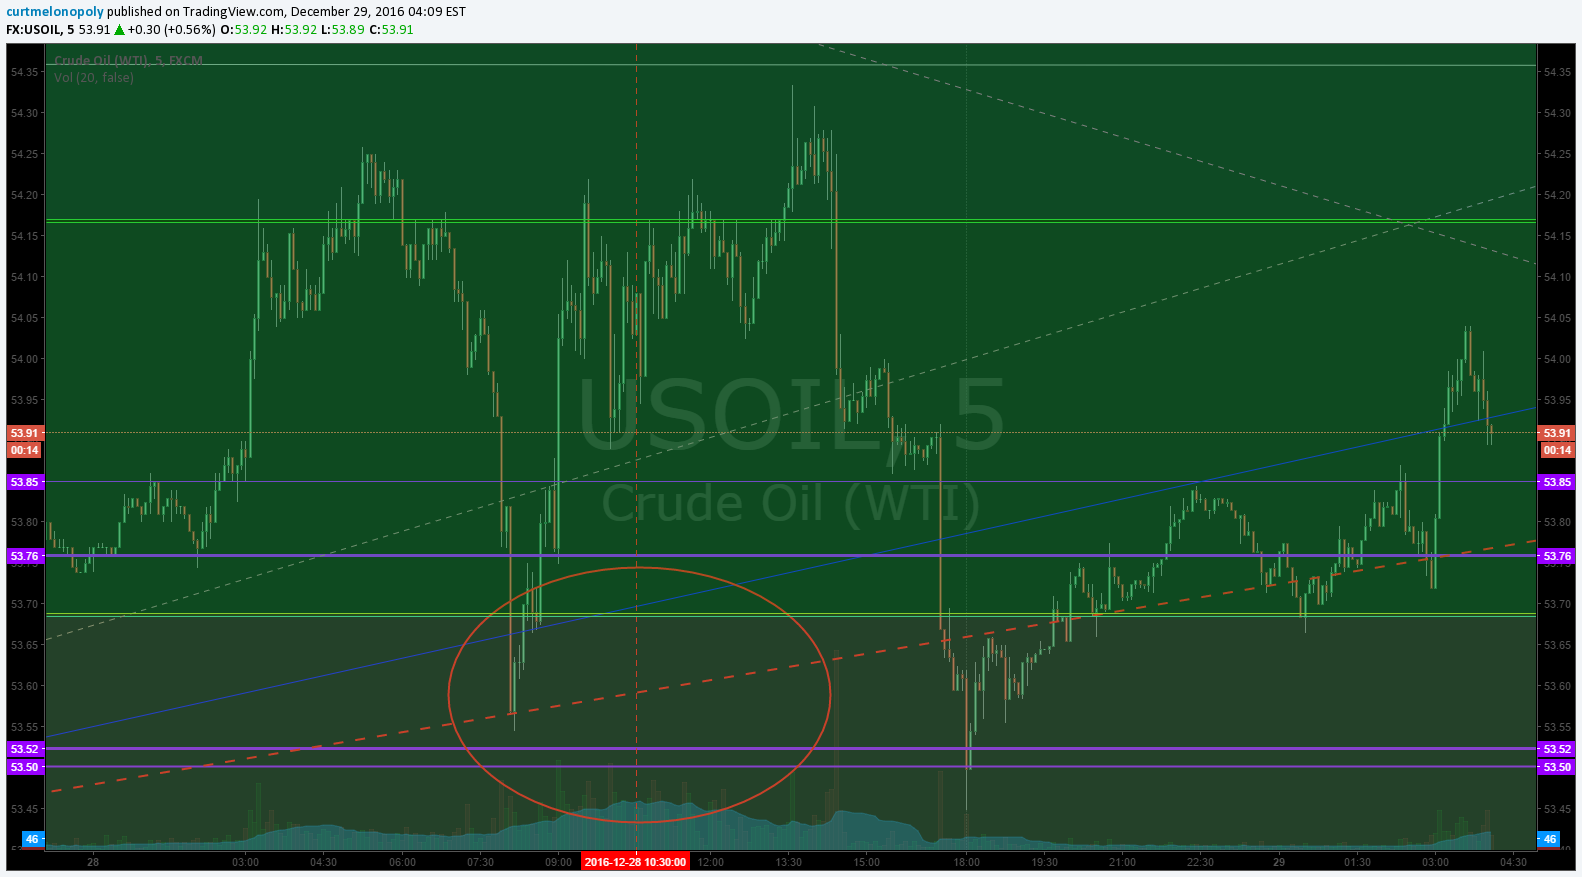
Intra-day Crude Oil Trading Range: At time of writing FX $USOIL $WTI is trading at 53.91 4:28 AM ET Dec 29, 2016. Some thoughts with respect to traditional charting that may help advance the trading edge:

Crude, Oil, Algo
Crude algo intra work sheet 428 AM Dec 29 FX $USOIL $WTIC #OIL $CL_F CL $USO $UCO $SCO $UWT $DWT #OOTT

Multi Week Trading Range for Swing Trading:

Note: Be careful with the prices you see in the purple boxes on the right of the chart – they do not line up on chart for price action (they are for indicators).

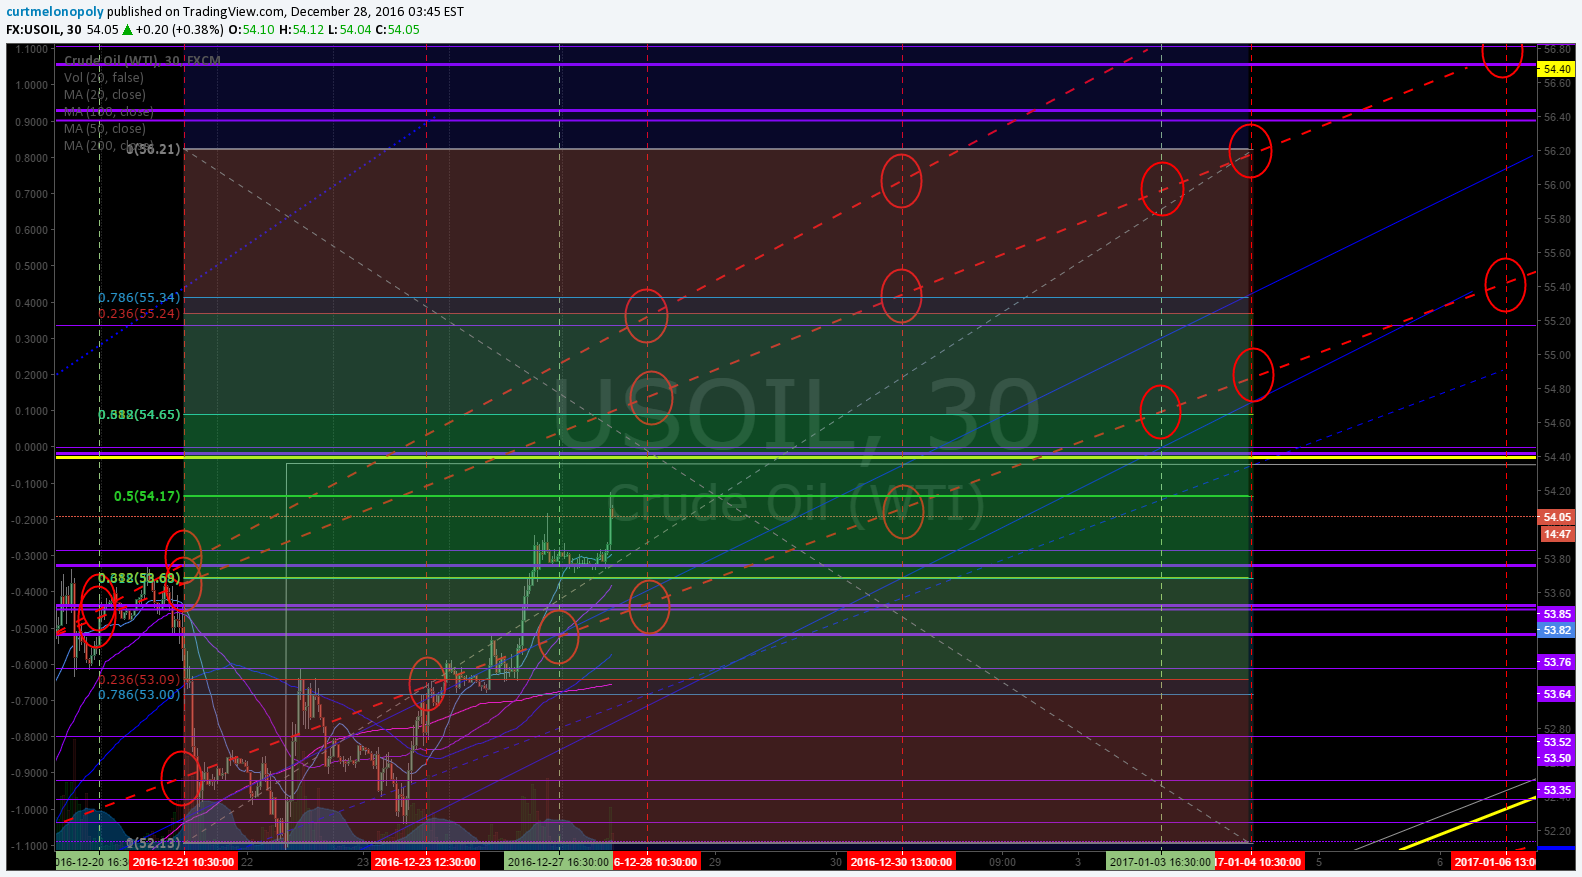
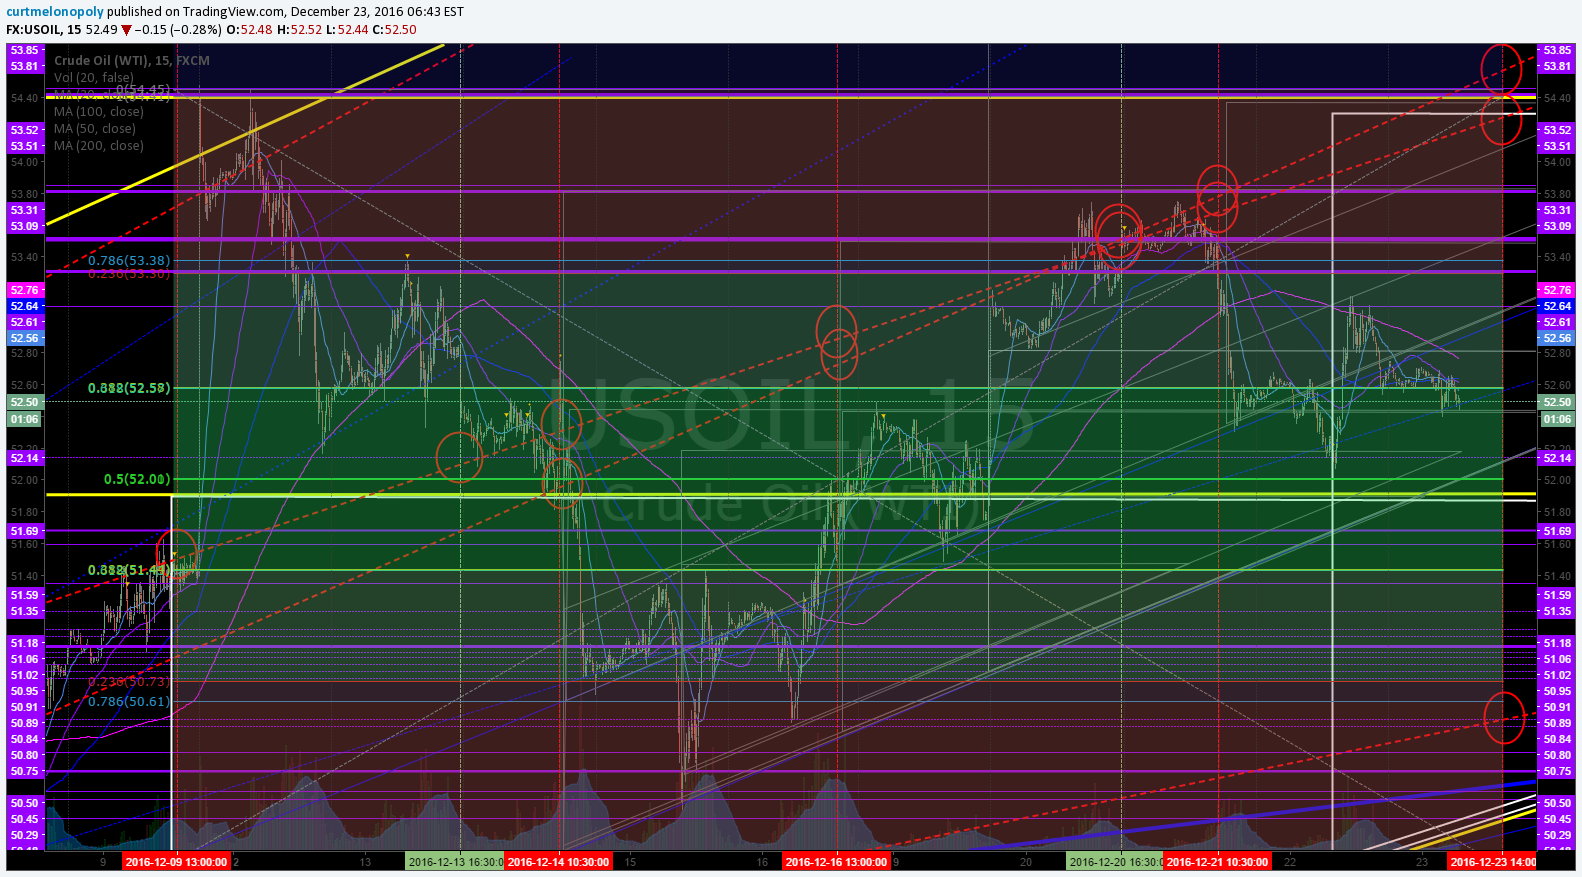
Pay attention to the upward trending channel – you can enter long and sell in between the channel yellow lines as it trends. If price stays below the resistance then you trade the channel under that and if above a major support line same thing (yellow lines).

Price is currently trading above a horizontal support at 51.93 (yellow line) – watch this for support. Resistance is at 54.39. Review charts over the previous week on my blog to see yellow support and resistance lines and channel that I refer to.

Refer to my previous posts re: Green arrows on chart are highest probability trade entries for short or long positions – while crude is trading in upward channel (like it is) your probability is always higher going long until channel broken. Trading at outside of channel increases probability of success also.

Diagonal Trend Lines:

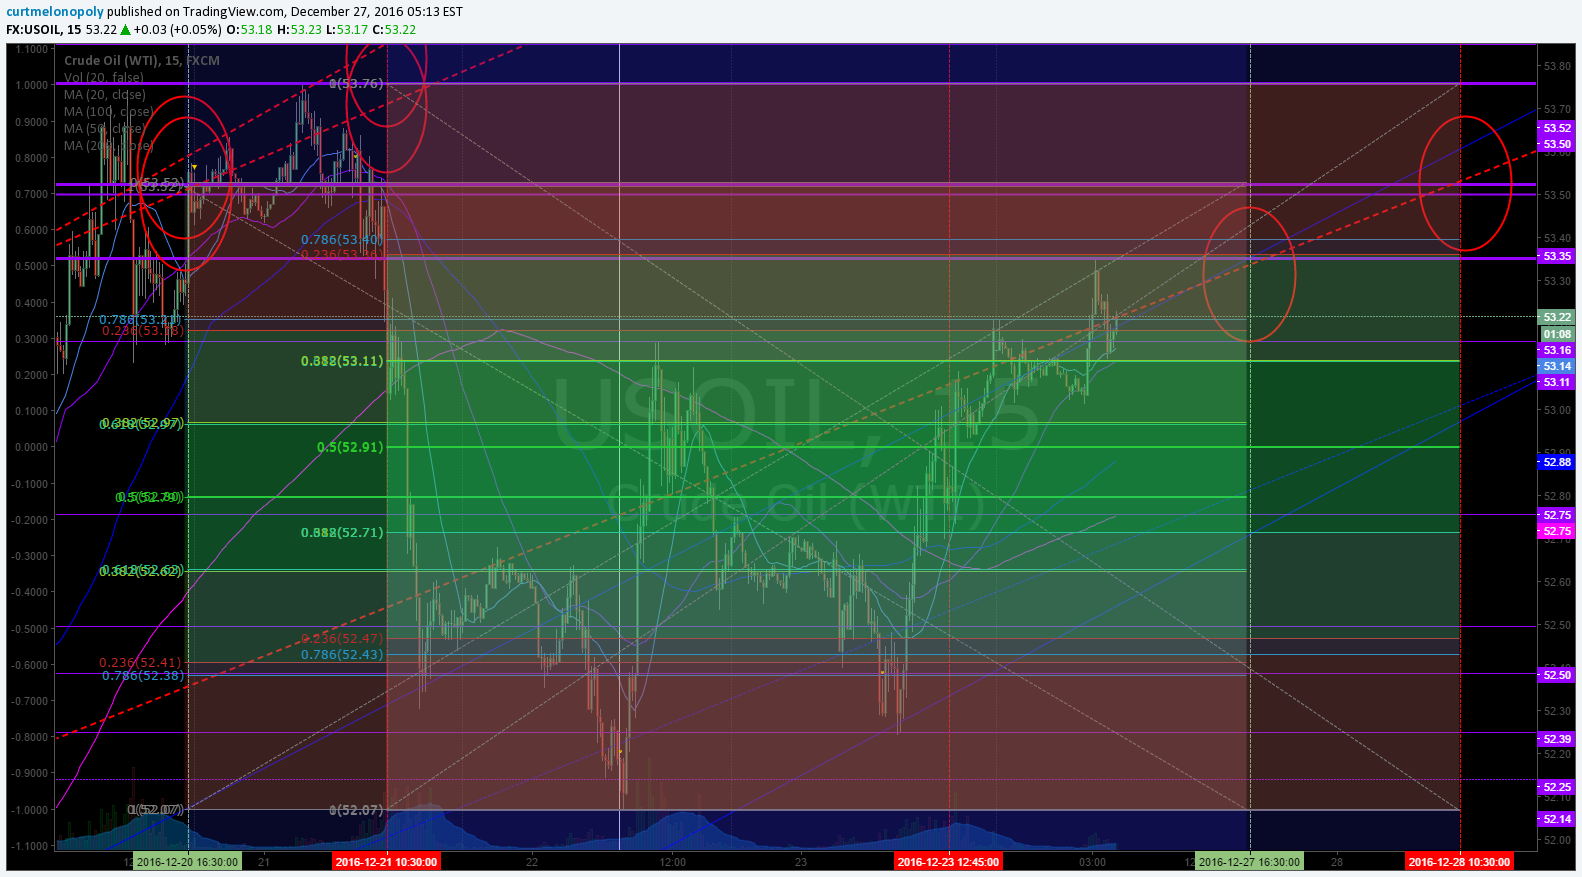
Diagonal trend-lines (blue). Diagonal trend-lines are critical inflection points. Please review many of my recent posts so you can learn about how important these diagonal trend-lines are. If one is breached you can look to pull-back to next diagonal blue trend line about 90% of the time. Also pay attention to how thick the lines are – the thicker the line the more important because they represent extensions from previous time / price cycles.

Remember you can come in to the chat room to message the trader and REMEMBER I have posted a live chart link earlier in this post so if you can’t see the lines well on this chart above you can go to the live chart link and watch for member live algo chart links through-out the day in your email inbox!

There is one right under and another a tad further under where crude is trading intra and they have been holding well in recent trade.

Price Action with 20, 50, 100, 200 MA

It is wise to study how the 20, 50, 100, 200 MA trade on each time-frame before trading oil related instruments. Below are a few examples.

Below is how oil has been trading with 20 MA on the 4 hour chart – fairly predictable buy / sell triggers. It is preferable to sell at the top of the move if you can time it and not wait for the 20 MA to trigger to downside. While crude is trading under 20 MA advantage is to short side and over advantage to long side. Keep in mind while trade remains in upward trending channel like it is now short side probability is lower than it would be otherwise.

Crude trading well above 20 MA on 4 Hour. Crude algo intra work sheet 438 AM Dec 29 FX $USOIL $WTIC #OIL $CL_F CL $USO $UCO $SCO $UWT $DWT #OOTT

Crude, Oil, 20 MA
Crude trading well above 20 MA on 4 Hour. Crude algo intra work sheet 438 AM Dec 29 FX $USOIL $WTIC #OIL $CL_F CL $USO $UCO $SCO $UWT $DWT #OOTT

Fibonacci Levels:

Watch these lines for support and resistance. Careful using them as traditional retracement levels with crude because the algo lines etc are more dominant / predictable. But the Fib lines are excellent indicators for intra-day trade support and resistance.

There are fib levels on the chart below – but they may just confuse you more than anything. We are currently running calculations with our modeling on how fib levels relate to our targets and trade levels – so the chart below is more mad science than anything because this is simply a live shot of work we are in the middle of – and we understand the levels can be difficult to make out.

When you get a feel for how the fib levels reflect intra trading (which we cannot explain in short here) you will always have them on your chart in a similar manner.

Fibonacci. Crude algo intra work sheet 457 AM Dec 29 FX $USOIL $WTIC #OIL $CL_F CL $USO $UCO $SCO $UWT $DWT #OOTT

Fibonacci, Crude, Oil, Chart
Fibonacci. Crude algo intra work sheet 457 AM Dec 29 FX $USOIL $WTIC #OIL $CL_F CL $USO $UCO $SCO $UWT $DWT #OOTT

Horizontal Trend-Lines (purple):

Horizontal trend-lines are not as important as the other indicators reviewed above, however, they do serve as important resistance and support intra-day for tight trading and they are important if thick (in other words they come from previous time / price cycles). WE STARTED TO REPRESENT THE REALLY IMPORTANT LINES IN YELLOW FYI FOR EASE. Refer to chart for current applicable horizontal trend-lines.

Advanced Charting:

Respect support and resistance lines: If you can be patient and take your long and short positions against these yellow lines – that is your highest probability trading.

You will see a lot of noise on the charts over the next few weeks (algorithmic calculations of various types). Try and ignore for now.

Oil Time / Price Cycles:

Time / price cycles are on hold for remainder of week because of the holiday and change in oil reporting days / times – oil is not trading as predictable as most weeks as a result.

Time / price cycles are the single most important indicator and my record calling them is near 100% – since inception seven months ago. The reason they are so important is that a trader does not want to be holding a crude oil instrument at termination of a time cycle if not absolutely sure if price will go up or down. A trade may choose to enter a large position in advance of a time price cycle termination IF THERE IS A HIGH PROBABILITY OF A DIRECTION IN PRICE and if the market is trading at a really important pivot area. In other words, if the market is trading at the bottom of the upward trending channel at a support (yellow lines) and we knew there was a significant probability of a time cycle about to terminate a trader may enter with a long position. The price really spikes or drops significantly when these important time cycles terminate.

The problem with time / price cycle terminations is they change from minute to minute (depending on where price is on the chart) so you have to be in the trade room to get the alert. Our lead traders will do everything they can in future to send these on SMS but we have to be careful because it can be difficult with so much going on in the room. The reason they (time cycles) change is because they are actually represented by or are geometric shapes in the chart – I know it sounds odd but I have (as I mentioned) hit these calls just shy of 100%. The oil political people know the same algorithmic modeling principles and they ALWAYS TIME THEIR BIG ANNOUNCEMENTS AROUND THE TIME PRICE CYCLE TERMINATIONS.

So if you can picture a triangle on the chart – and price is trading in the triangle – and price is going to come to the edge of the triangle and there is a significant support or resistance or an algo line terminating there too or a target (those type of things)… then we know there is a high probability of a time and price change. In other words, it is where there are clusters of algorithm points that cross and when price is going to cross over that cluster is where they are. And these are represented on all the different time frames – the larger the time frame – the larger the time price cycle termination – the larger the spike or downdraft. This is where we establish our intra-day quadrants from for sniping trades (which we will put in to the room soon because it looks like the geo political rhetoric is over for a while making them more predictable). Difficult to explain in short. So we will do our best to SMS alert these in future.

Also, the real large or important time / price cycle terminations we know far in advance and they can be put in these newsletters.

If you review my Epic the Oil Algo Twitter feed, my blog posts and my story on our website you will get a feel for how accurate these calls are.

Alpha Algo Trading Trend-Lines (Red dotted lines):

Per previous

There is a new alpha algo line on this chart and new algo targets for Tues, Wed and Friday this week.

To determine which algo line is most alpha (or probable) intra day, it is the nearest line to price action. This can also help you determine the trend of trade. If the algo line is trending up the price will follow it up until price is tested at an algorithm indicator (the main tests are diagonal trendlines, horizontal trendlines, time / price cycles etc – as I have shared with you). This is why it is important to watch all the lines because they are all support and resistance. To keep it simple trade the range (yellow lines) as I’ve mentioned but keep an eye on these indicators.

Current Alpha Algo Targets (Red circles):

Due to multiple requests we will start publishing our targets weekly not only on the charts (with circles and algo lines) but also as numeric listed targets with associated probabilities for each target on each day again (we recently stopped doing this but a number of traders have requested we do this again so we will start again next week). You can see how I used to do this on my Twitter feed.

At Wednesday at 10:30 we had a target hit! Not right to center but in target zone.

Crude, Oil, Algo, Target, Hit
Called target zone hit 1030 AM Wed. Crude algo intra work sheet 410 AM Dec 29 FX $USOIL $WTIC #OIL $CL_F CL $USO $UCO $SCO $UWT $DWT #OOTT

So what is your most probable algo target for Friday 1:30 PM EST etc? Your closest target that crude is trending toward is always the most probable. Crude is currently trending toward a target (red circles on chart) Then, your second most probable is the one that is up or down trend depending on whether general price is in an upward or downtrend for the most recent week or so and what your other indicators look like (such as the MA’s I explained above).

This week alpha algo targets are as follows (with associated hit probability – how many times out of 100 a hit is expected): FRI TARGETS ADJUSTED!

Wednesday 10:30 AM EST – 50.87 (3%), 53.53 (45%), 54.72 (56%), 55.22 (37%)

Friday 1:00 PM EST – 51.23 (2%), 54.06 (41%), 55.35 (32%), 56.32 (19%) 

Friday’s algo targets have not been near as predictable as Tues and Wed (shy of 80% now vs 90%+) and this Friday looks no different so be cautious with this Friday’s targets!

The other way to determine which targets are in play is actually quite simple, you will notice that crude trades between the channel lines up and down and up and down and there are various support and resistance along the way. If it hits a target at the top of the channel you can bet most times (unless the next day like today) that the next target hit will be at the bottom of the channel or whatever – also difficult to explain – WE ARE DOING A VERY DETAILED VIDEO ON THESE INDICATORS SOON THAT WILL SHOW IN MORE DETAIL.

The targets for this week are represented on the chart. Again, refer to the live charting I send you for this also or be in the trading room.

Wait for the price to trend toward a target and take your position and watch as price gets closer and closer to the target. Remember, that the machines trade from decision to decision – or in other words from support to next resistance or resistance to next support or when the times come each week on Tuesday Wednesday and Friday they will trend toward the target that market price action determines they go to.

Our lead trader will explain more in the room and do not hesitate to ask our lead trader in the room by private message or on twitter to explain intra day decisions.

Oil Intra-Day Algo Trading Quadrants:

Processing now for release soon (you are seeing the beginning of them above in charts now) – I don’t think there are any real tight crude related snipers beyond our lead trader right now anyway – but nonetheless, we are getting these out – they take a lot of data processing to say the least. We’re almost there.

Indicator Methods:

As explained above, my algorithm is a consideration of up to fifty traditional indicators at any one time – each one given its own weight in accordance to its accuracy (win rate). This is how we establish the probability of specific targets hitting (we call them alpha algo targets).

Alpha Algo Targets, Algo Trend-lines, Algo Timing, Quadrants for Intra Snipes:

Algo targets are the red circles – they correspond with important times each week in oil reporting land. Tuesday 4:30 PM, Wednesday 10:30 AM and Friday at 1:00 PM. The red dotted diagonal lines are the algo trend-lines. And the vertical dotted (red or green) are marking the important times each week. You will find that the price of crude will hit one of the alpha algo targets about 90% of the time. In the absence of market direction the machines take price to the next algo line and/or target. Understanding how the price of crude reacts to the algos and how they move price from target to target is critical for intra-day and swing trading crude oil and associated instruments.

You will notice that price action of crude will use these algo trend-lines and act as support and resistance, and that price also often violently moves when an alpha algo line is breached either upward or downward.

We cover this in much more detail in the member updates, trading room. A review of my Twitter feed and previous blog posts will help you understand the relation of these indicators. We will start posting video blogs (for my subscribers) on YouTube (in addition to my daily blog posts) for swing traders that work during regular trading hours.

Also… we will cover how to establish algo trend-lines and price targets future forward (as you have seen me do on my Twitter feed for some time now).

Conclusion:

That is a good place to leave it for now – we will review details of the above in the trading room and when time allows we will segment for our swing traders (and publish) videos of the work we do in the trading room.

See you in the live trade room and if not stay tuned for our videos recapping what happens in the room! And again, if you struggle to know how to use these indicators as a trader’s edge, it is recommended (if you have earnestly reviewed all of our documentation first) that you obtain private coaching prior to trading a real account with real money – we recommend you use a paper trading account at first. And finally, we will be publishing a “how to use guide” soon, but it will be simply be a recap (consolidation) of instructions in this post, from my Twitter feed, and previously published information on our blog and website. You can also send specific questions to our email inbox at [email protected] – if you do this be sure to ask a specific question so it can be answered specifically. When the 24 hour oil trading room opens you will have ample opportunity in that 24 hour room to ask questions also.

Watch my EPIC the Oil Algo Twitter feed for intra day notices and your email in box for member only material intra day also.

EPIC the Oil Algo

PS If you are not yet reviewing the daily post market trading results blog posts, please do so, they are on the blog daily and often there is information that also may assist your trading. Trade room transcripts (for example) may review topics pertinent to your trading.

https://twitter.com/EPICtheAlgo/status/811327478845218816

Article topics: EPIC the Oil Algo, Crude Oil FX: $USOIL $WTI, $USO, $UCO, $CL_F, $UWT, $DWT, $ERX, $ERY, $GUSH, $DRIP, Chart, Algorithm, Indicators, Trading Room, Fibonacci, Algo, Targets
Read More
Post-Market Wed Dec 28 $KATE $UWT $GALE $DRAM $MSDI $DUST $JUNO $CBMX $SPY $GLD $GDX $USDJPY $USOIL $WTIC $SLV

Post-Market Wed Dec 28 $KATE $UWT $GALE $DRAM $MSDI $DUST $JUNO $CBMX $SPY $GLD $GDX $USDJPY $USOIL $WTIC $SLV

December 29, 2016February 12, 2018 Curt MelonopolyPost Market Report (Trade Results)$CBMX, $DRAM, $DUST, $GALE, $GDX, $JUNO, $KATE, $MSDI, $USOIL, $UWT, $WTIC, Chat Room, Compound trading, Day-trading, GLD, Results, Stocks, Trading Results, USD/JPY, Wall Street

Review of my Chat Room Stock Day Trades, Algorithm Charting Calls and Alerts for Wednesday Dec 28 – $KATE $UWT $GALE $DRAM $MSDI $DUST $JUNO $CBMX $SPY, $GLD, $GDX, $USDJPY, $DXY, $USOIL, $WTIC, $SLV, VIX, $NG_F and more.

Intro:

Time stamped entries (in permanent archive) copied to this blog in italics (below) are direct live log chat from chat trade room as they occurred (random chat from myself not applicable or other misc chat deleted). Chat trade room is also video recorded daily for trade archive.

In addition to chat, this trade-room has live voice broadcast (that covers in detail what indicators I am looking for in and out off each trade) and has live chart screen sharing right from my monitor to the room with all indicators I am looking at.

EVERY CALL WE MAKE, EVERY PUBLIC INTERACTION, REPRESENTATION OF TRADE (ON EVERY VENUE) IS VIDEO RECORDED (TRADING ROOM), ON SOCIAL MEDIA OR ON BLOG / WEBSITE TIME-STAMPED FOR PERMANENT RECORD AND ABSOLUTE TRANSPARENCY. PLEASE ALSO REFER TO OUR PUBLIC DISCLOSURE https://compoundtrading.com/disclosure-disclaimer/.

Notices:

New Service Options: We now also offer a stand-alone trading room option now (vs. bundle w/ trading room, premarket newsletter and alerts) at 59.00.

New Service Options: EPIC the Oil Algo now has an Oil Report only option (vs. bundle w/ 24 hr trading room launching early 2017) at 199.00.

New Service Options: Entry-Level trader one-on-one trade coaching and entry-level trade academy options now available in addition to intermediate / advanced trading academy and coaching.

Feature Post: There is a new feature blog post at this link, “Why our Stock Algorithms are Different than Most“. If you are using our algorithms or charting it is a must read.

Room Settings: We are testing fault settings for multiple trading rooms in 2017 (main room, momentum, options, swing, commodities, etc). We can have groups in different rooms all seeing same screen and announcements / broadcast – if you’re moved don’t sweat it – it won’t affect your experience.

Overview Perspective & Review of Chat Room, Algo Calls, Trades and Alerts:

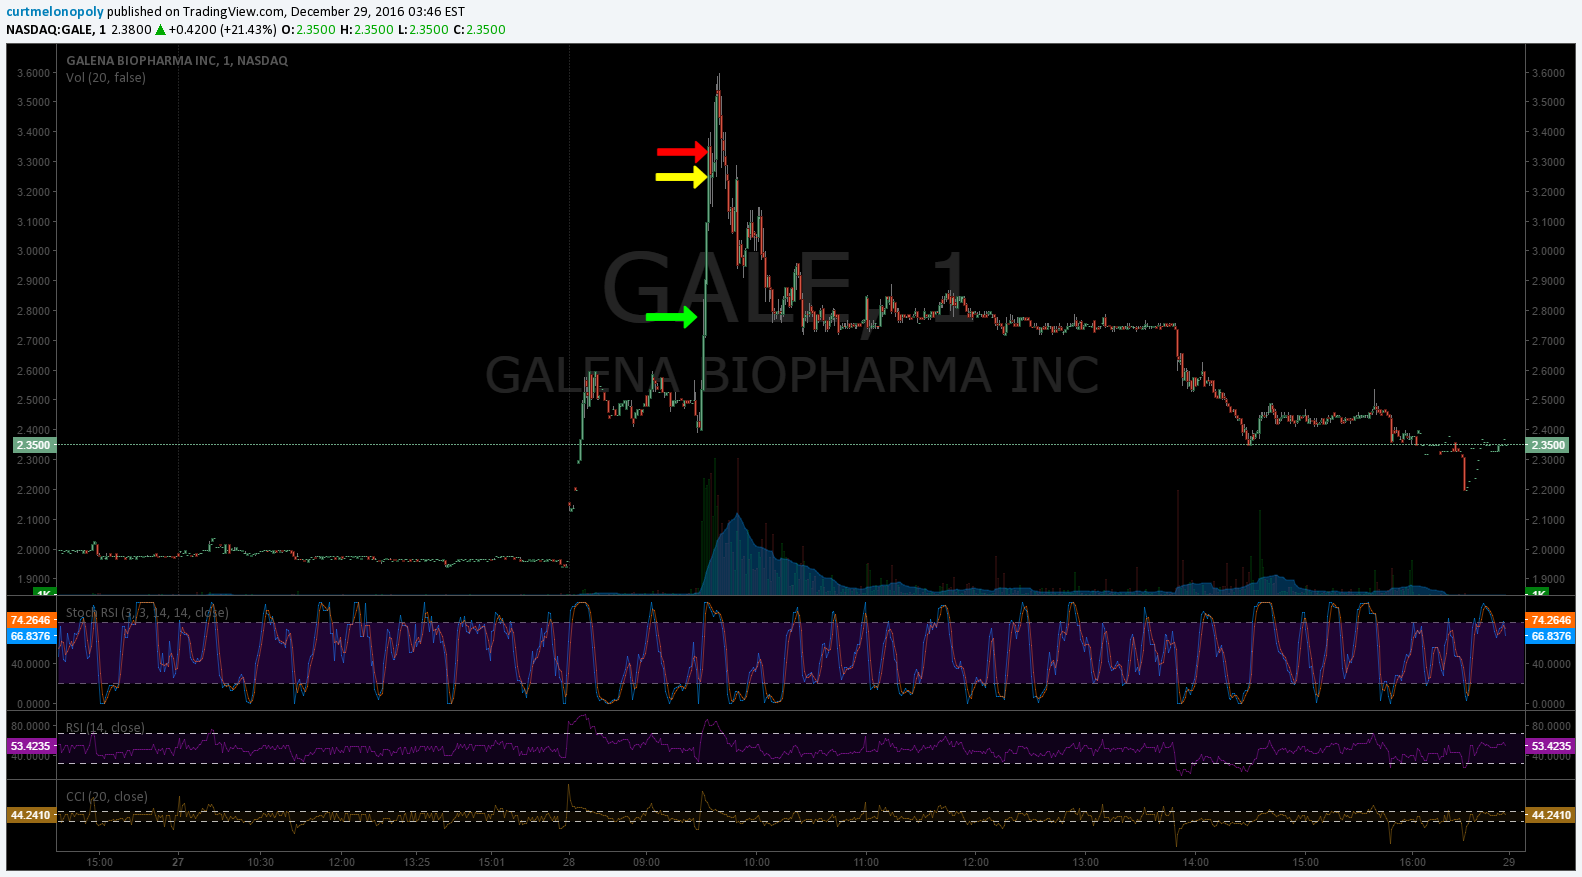
$GALE I nailed with morning momentum with an add – wish the entries were larger – then I gave a lot of that back to the market with a botched $UWT trade. $UWT entry was fine – my exit was poor at pit close in the down I held – a no no trading oil related unless you are trading with a conviction to hold in the uptrend (as oil is trading now). But I was concerned with the uptrend because we were close to resistance and a previous high and my plan was a tight trade but I didn’t execute a tight departure. So that was a mistake. You can always re-enter. Cut quick.

Members in our room did well with $KATE and a few other plays. I was on top of $KATE just preoccupied so didn’t take a trade. Mathew was on top of $GDX miners, bonds, $TLT, and various other plays. Fairly active room considering market. Great team.

Momentum Stocks Today:

Symbol Company Name Price Change %
MSDI Monster Digital, Inc. 2.15 +0.93 +76.50%
ZCZZT ZCZZT 22.80 +4.95 +27.73%
GALTU Galectin Therapeutics Inc. – Un 2.12 +0.46 +27.71%
DRAM Dataram Corporation 2.42 +0.51 +26.70%
CNTF China Techfaith Wireless Communication Technology Limited 1.99 +0.39 +24.13%
KATE Kate Spade & Company 17.86 +3.35 +23.09%
GALE Galena Biopharma, Inc. 2.38 +0.42 +21.43%
ARWA Arowana Inc. 11.77 +1.87 +18.89%
FNCX Function(x) Inc. 3.05 +0.48 +18.68%
MPET Magellan Petroleum Corporation 11.45 +1.57 +15.89%

Holding:

$DUST, $CBMX, $JUNO

Looking Forward:

I need to exit $DUST and entered it and held because I was convinced USD/JPY would at minimum do a major spike up to end the rally – but not so lucky. $CBMX and $JUNO are holds in to spring if necessary – that was the plan anyway.

We are looking to volatility, bonds, metals and possibly bio at this point short / mid term – but the market will let us know.

The market has a tonne of inflection points now, Silver Gold and Miner’s woke up some today so things should get interesting soon with our algos that you can find here:

The algorithm Twitter feeds can be found here: $WTI (@EPICtheAlgo), $VIX (@VexatiousVIX), $SPY (@FREEDOMtheAlgo), $GLD (@ROSIEtheAlgo), $SLV (@SuperNovaAlgo), $DXY (@DXYUSD_Index).

Announcements in Trading Room:

09:15 am Curtis M : When market opens I will look at momo and then Oil, Gold, Silver, etc. Momo: $LIVE, $GALE, $OCRX, $MICT, $SINO, $IRG $ESEA $ORIG $CEMP $RADA

Stock Chat-room Trading Transcript:

Miscellaneous chatter may be removed.

09:21 am Mathew Waterfall : $OCRX gapped without me. Broke down the chart and had an alert right over yesterdays HOD. Debating a chase here
09:32 am Curtis M : Long $GALE 2.75 1000
09:35 am Curtis M : Add 3.25 1000
09:35 am Curtis M : Out 2000 3.28

$GALE, Stocks, Trade, Daytrading
$GALE Trade went well today in room. Entry, add, exit for morning momentum stock trade. Daytrading stock results. Compound Trading. #stocks

09:39 am Mathew Waterfall : Out a chunk of $DRAM at 2.11
09:39 am Mathew Waterfall : From 1.71 entry
09:40 am Drew M : $ATVI momo
09:42 am Mathew Waterfall : cKISED htgc 14.31 FROM 14.06. Making some room on the board here
09:44 am Curtis M : OIL looking for break 54.39 to upside
09:44 am Mathew Waterfall : Whoa not sure what happened on that last note. Meant closed $HTGC
09:47 am John M : Short $QCOM
09:48 am Jack D : $CPAH jig
09:50 am Mathew Waterfall : OUt another rung of $DRAM. Small position left on trailer. 10 cent trail for last lot
09:52 am MarketMaven M : $UUUU on the move this morning
09:52 am MarketMaven M : and $CLF
09:54 am Mathew Waterfall : $CLF nice open. $DRAM is a rocket lol
10:01 am Curtis M : Crude I am going to watch 10:30 and likely take position if I can get some volatility
10:10 am Mathew Waterfall : Our old find GDX now green. my $GV play is a gold play and what I meant yesterday about starting small
10:16 am Dani M : $MPET 52 week hihg
10:21 am Carol B : $DRAM bit it hard
10:22 am OILK K : $CYCC poppong
10:22 am Mathew Waterfall : $CYCC should get some legs with continued volume
10:23 am Clive M : $IPDN momentum
10:24 am Curtis M : Carful w $PDN – not saying it wont go but… super low float
10:25 am Curtis M : 10:30 on dck
10:26 am Clive M : $MBRX got slapped
10:32 am Mathew Waterfall : $BTX swing entry. Playing against the 10 day with a 10 cent stop t .7 right under the 10
10:34 am Mathew Waterfall : Wouldn’t the report be out tomorrow with the holiday monday?
10:38 am Curtis M : LOL Yup Mat tomorrow – sleep I need sleep
10:41 am Clive M : Waching shippers this morning for afternoon play
10:43 am Michael P : Scalping $LIVE – action decent
10:52 am Jack D : market dead died doh
10:53 am Mathew Waterfall : Out $GV at 5.13 from 4.9ish. Broker deleted my entry price which is great. Will revisit if it can clear 5.2 yesrerdays high
10:54 am MarketMaven M : $CYCC going to rocket soon
10:55 am Mathew Waterfall : Looks like $CYCC already is
11:05 am Curtis M : $CYCC yup rocket wwatching $GALE
11:06 am Mathew Waterfall : $CYCC short setting up
11:07 am Mathew Waterfall : 6.19-6.2 with a short stop may be my play if we get there
11:10 am Mathew Waterfall : And there we go. Almost hit my target. Hit .18 and now backing off
11:13 am Mathew Waterfall : $CYCC if it can get south of .75 should see 10 day on the 5′
11:13 am Mathew Waterfall : ~5.45
11:19 am Mathew Waterfall : Next week $TZA 21 calls. Cheap and should get some play if we see a repeat of last year will selling the next few days
11:19 am Mathew Waterfall : I’m out next week though so exit if up to you if you take this trade as I may not be able to post
11:22 am Mathew Waterfall : Almost made the 10 day on that $CYCC short entry. I didn’t get my fill, rooking move having sell over at 6.2, should have had it down a couple of cents as everyone was lined up at the same level and thus it never made it there
11:23 am Curtis M : ugh
11:24 am Mathew Waterfall : Good practice if nothing else. NEXT!
11:24 am Curtis M : ye
11:25 am Curtis M : USDJPY still has to do one big peak coming soon
11:26 am Curtis M : yup crystal ball lol
11:28 am Mathew Waterfall : I would like that for a gold entry. $DUST would also like that lol
11:32 am Curtis M : Long $UWT
11:32 am Curtis M : 1000 start
11:32 am Curtis M : Tight
11:38 am Mathew Waterfall : $GV looks nice here but I’m staying out for now
11:42 am Darni T : $GV a winner imo good good
11:43 am Mathew Waterfall : BT as mentioned earlier had a trailer on $DRAM out a $2.68. Nice winner would revisit back in the 1’s in the coming weeks
11:44 am Michael P : $NVLS HOD and watching
11:44 am John M : on my screen to Mike
11:45 am Curtis M : OIL could fail not great action
11:45 am Curtis M : I WANT THE MACHINES BACK
11:45 am Dani M : $CSBR long
11:46 am Mathew Waterfall : $NVLS looks good. VWAP at 2.2 key there IMO
12:06 pm Sammy T : $MXL.V vol
12:11 pm Mathew Waterfall : Not much getting me too excited out here today. After the $DRAM pop nothing has been looking too constructive
12:15 pm Curtis M : slow
12:24 pm Mathew Waterfall : Liking bonds here actually. Consolidating along a fib support. Rounded bottom possible especially with market weakness
12:25 pm Mathew Waterfall : Rally got started 12/30 of last year so that is also a possibility this year
12:25 pm Curtis M : hmmm
12:25 pm MarketMaven M : yessir
12:26 pm Mathew Waterfall : $TLT Jan20 124 calls. Small and cheap to start
12:27 pm Mathew Waterfall : 122.4 next level up. 127 poss
12:27 pm Michael P : $ANY near hod
12:29 pm Mathew Waterfall : 1/20 was swing high in $TLT last jan if anyone wondering why I took that strike
12:34 pm Curtis M : $KATE halt
12:41 pm Darni T : Long $KATE at 1626 but looks toppy now
12:42 pm Darni T : Maybe not
12:42 pm Clive M : i am out now darni
12:42 pm Clive M : just in time bahaha
12:43 pm Curtis M : $KATE shoulda – way to go guys.
12:44 pm Jack D : a few gals in there too yo
12:44 pm Jack D : drew?
12:44 pm Mathew Waterfall : Well done whoever caught that male female or otherwise
12:44 pm Jack D : I’m stuck
12:45 pm John M : I banked on it – out thanks for the alertz it shud still rock n roll
12:45 pm Curtis M : I wont chase it now
12:46 pm Cindy L : I got a short on $NFLX covered now
12:46 pm Cindy L : no $KATE here
12:51 pm MarketMaven M : Short $KATE now looks decent
12:52 pm Mathew Waterfall : I was just thinking that MarketMM
12:52 pm MarketMaven M : yup
12:52 pm Mathew Waterfall : I’m probably sitting on my hands for the rest of thr week, maybe some downside plays but the market feels like it wants down from here
12:52 pm Mathew Waterfall : I’m content to let it figure our a direction and not forcing anything
12:53 pm Mathew Waterfall : Still holding some swings of course
12:54 pm Curtis M : I need to find a way out of $DUST lol might have to bite – have a few swings and if oil gets up over res I’m hammering down if not gonna cut around pit close or sooner
12:56 pm Mathew Waterfall : Yepp. Gotts say I’m feeling the downside move a bit more over the past week so gold might see some upword action. Coupled with the JPY coming off and it could get moving in a hurry
12:57 pm Michael P : everybody in maket confused now i think
12:58 pm Curtis M : Oil gonna pop or drop guys
12:59 pm Curtis M : 70 / 30 on my side:)
01:00 pm Curtis M : whoa $KATE surprise
01:00 pm Curtis M : Instit $ in there likely
01:03 pm Curtis M : Crude decision time soon
01:10 pm Curtis M : This could be it – loading
01:19 pm Curtis M : need the machines back ugh
01:19 pm Curtis M : here we go for another try
01:22 pm Mathew Waterfall : $TLT and the bonds making it happen here. Let’s do it
01:23 pm Curtis M : Ground zero here today
01:24 pm Curtis M : Not a time for beginners
01:26 pm Mathew Waterfall : uh yea you can say that again lol. Next few months aren’t going to be the easy street of most of 16
01:28 pm Sammy T : Scaling in 3000 $UWTI as back test confirms
01:28 pm Sammy T : That good Curt?
01:29 pm Curtis M : Ya thanks Sam
01:29 pm Curtis M : U took me up without letting me know appreciate that I lost my original stno
01:33 pm OILK K : I can do alerts too for you and Mat whenerver you guys need help.
01:38 pm Curtis M : Thanks for the assitance with alerts Sam and Kal – Mat hew and I will call on ya as needed
01:39 pm Curtis M : With pit close coming I am gong to try and hold even tho serious resistance up ahead
01:43 pm MarketMaven M : $CDNX long
01:45 pm Sammy T : Like OIL here Curt looks bullish
01:48 pm Darni T : $NVDA decent short
01:51 pm Curtis M : Mathew – anything decent out there?
01:51 pm Curtis M : Keep your $UWT on a short leash folks
01:52 pm Mathew Waterfall : Not much moving on my end really. Sacnning for small pharma moves like yesterday and no dice after the opening period
01:52 pm Mathew Waterfall : Looking at longer term charts currently which is what landed me on the $TLT train of thought
01:52 pm Curtis M : You read my mind – was thinking pharma for EOD
01:52 pm Mathew Waterfall : Option data also light today. Not many sweeps coming through as to be expected in the end of the year
01:53 pm Mathew Waterfall : I like pharma into next year. About the only sector I really like right now
01:54 pm Mathew Waterfall : Looking for a pop in $OPXA and $AMPE. Both solid off the lows looking for a $CNAT type move in both
01:57 pm Mathew Waterfall : $FH looks decent. Nice expanding colume but at best a grinder higher
01:58 pm Curtis M : While slow I may as well mention thanks for the DMs on the assistance in the room – we’ll reach out early January – we’ve limited number of people till next week when guys are in room helping Mathew and I and media starts Fri so new year new peeps and yup we’ll reach out – thx!
02:02 pm Curtis M : Good call on $GDX Mathew – you’ve been all over that – could be a bg move
02:03 pm Mathew Waterfall : Thanks still watching and have it in a similar range. Breakout should be vicious but not going to rush into it
02:20 pm Curtis M : Careful around pit close here oil related longs
02:25 pm Curtis M : holding – but close
02:27 pm Curtis M : acton not the best hahahahaha jeez
02:27 pm Curtis M : watch out could get bad
02:32 pm Curtis M : terrible but Iheld
02:33 pm Curtis M : If price loses that white line (quadrant) Im out for loss
02:34 pm Mathew Waterfall : Stopped on $BTW. 10 cent loser on that swing attempt. Chop chop day out there
02:34 pm Mathew Waterfall : $BTX that is. Thinking about 2 tickers at once
02:42 pm Curtis M : Wellll uggh anyway so I got scaled in for a total of 1800 $UWT and will hold 2/3 overnight if it holds here – only reason my tolerance high is the upward channel we’re in
02:49 pm Mathew Waterfall : $OPXA trying here. Thought $HK might go but it’s just sat there sense running so not touching that play
02:50 pm Curtis M : $OPXA some otheres on social saying same thing (good traders lol)
02:51 pm Mathew Waterfall : You’ve found my alternate accounts it looks like lol
02:51 pm Mathew Waterfall : I haven’t seen much so that’s comforting
02:56 pm Curtis M : Sorry went on a Twitter rant
02:56 pm Carol B : ya reading it bursting
02:56 pm Curtis M : Im a terrible loser
02:57 pm Mathew Waterfall : hahaha this is a good game for people like us who hate to lose
02:58 pm Mathew Waterfall : Will only make you work harder
02:58 pm Curtis M : Just hate it – grew up in that era where we didn’t get trophies for losing haha
03:01 pm Mathew Waterfall : Missed the boat on $ICPT dang
03:02 pm Mathew Waterfall : Going crazy
03:03 pm Curtis M : wtf
03:07 pm Mathew Waterfall : $DRAM remaining super strong here as well. Surprising based off of the way it has acted I was looking for a pullback
03:08 pm Curtis M : back in 5
03:12 pm Curtis M : charts are messed will have to fix later
03:13 pm Darni T : that msdi is a rocket
03:14 pm Mathew Waterfall : IWM inside and up on the 30 but weak so far. Market looks tired and wants to go down to me
03:16 pm OILK K : $KATE wow HOD
03:18 pm Carol B : $IOTS nice chart guys
03:20 pm Mathew Waterfall : Just looking at $IOTS. I’m interested over 2.2 swing high potentially
03:20 pm Mathew Waterfall : $DRAM type play possible
03:20 pm Darni T : Could go
03:21 pm Darni T : I’m watching $REN if you can believe it for long possible
03:21 pm Carol B : $REN? I see. $IOTS looks good darni
03:22 pm Darni T : And looking at long $SPY
03:22 pm Carol B : May as well go all in and go long oil with Curt
03:24 pm Darni T : $GNRT
03:25 pm Darni T : $GNRT going to the moon soon.
03:25 pm Mathew Waterfall : Long $SPY you saY? Goodluck Darni
03:26 pm Darni T : Just window shopping
03:27 pm Mathew Waterfall : I want to think we are going higher, but I have 0 confidence in that
03:27 pm Carol B : Wisdom
03:29 pm Mathew Waterfall : At best in a week like this we see a grind higher. Worse we can see a lot of downward momentum if sellers get after it in absense of volume
03:29 pm Mathew Waterfall : Staircase up, elevator down effect
03:31 pm Mathew Waterfall : For $SPY levels I have it riding a trendline down. Fibs at 223.6 and 220.69. Trendline would get us to first target Friday
03:32 pm Curtis M : Out $UWT loss fark – 1800 shares total – didn’t get fills I wanted for 1 + 3K 
03:33 pm Mathew Waterfall : $AFCO looks nice for a breakout here
03:34 pm Dani M : $AFCO I was watching also
03:35 pm Mathew Waterfall : I’m waiting to see a close and open tomorrow. Blue sky above though
03:38 pm Curtis M : Mathew – we may get the turn – could be metals mania etc for a while
03:39 pm Darni T : You guys on are on it. Darni needs to keep window shopping.
03:40 pm Darni T : I didnt enter anything yet – you may have convinced the pro Darni trader now.
03:40 pm Mathew Waterfall : I was just looking at NUGT options lol
03:40 pm Darni T : Looks bad I can admit it CAROL
03:40 pm Carol B : Looks like a turn.
03:41 pm Mathew Waterfall : My $TLT play is working well. I’m going to watch the BOJ overnight antics. If we can break that chart I’ll start adding in metals and miners
03:41 pm Carol B : Darni – you will just 4x enter what Curt and Mathew do anyway – I got you figured out.
03:42 pm Carol B : Look at $SPY
03:42 pm Mathew Waterfall : $IWM tried the inside and up, only to get slammed
03:42 pm Mathew Waterfall : 134.81 breaks. C ya later!
03:44 pm Carol B : I will do metal and miners research tonight guys.
03:44 pm Carol B : Darni you too
03:49 pm Mathew Waterfall : Watching metals tonight and bonds. Will look ti increase my position there if we get the bounce I expect. Puts all around top of mind as well if we see any continuation of the selling here
03:50 pm Curtis M : Me – I am just axcted about a possible turn – trends are where we make the money.
03:51 pm Mathew Waterfall : Some kind of direction would be nice after last couple of weeks. Chop city sucks
03:51 pm Curtis M : Been tough for sure – I though it was just me haha
03:54 pm Mathew Waterfall : December is always a rough one for me as well. Light volume, rebalancing, tax selling ect
03:54 pm Curtis M : ya
03:55 pm Curtis M : edit this plz lol
03:56 pm Darni T : That was a great chat you guys:)
03:56 pm Darni T : Goodnight Carol!
03:56 pm Darni T : Goodnight all
03:56 pm Curtis M : See you Darni
03:57 pm Carol B : Do your homework
03:57 pm Cindy L : Buy guys
03:58 pm Mathew Waterfall : Have a good night all.
03:58 pm darni p : You too Mathew
03:58 pm Clive M : peace
03:59 pm Clive M : grandson taught me that
03:59 pm Curtis M : See yall tomorrow

Article Topics: $KATE, $UWT, $GALE, $DRAM, $MSDI, $DUST, $JUNO, $CBMX, Compound Trading, Trading Lessons, Results, Wall Street, Stocks, Stock Market, Day Trading, Swing Trading, Investing, Chat Room, Trading Results, $GLD, $GDX, $USOIL, $WTIC, $USD/JPY, $SPY, $DXY, $VIX, $NUGT, $DUST, $JNUG, $JDST, $GC_F, $USO, $UCO, $SCO, $CL_F, $UWT, $DWT, S&P 500


Read More
PreMarket Newsletter Wed Dec 28 $OCRX $GALE $RADA $GGB $ORIG $GLD $GDX $NUGT $SLV $USLV $UWT $ASM $GRL $VGZ $NAK

PreMarket Newsletter Wed Dec 28 $OCRX $GALE $RADA $GGB $ORIG $GLD $GDX $NUGT $SLV $USLV $UWT $ASM $GRL $VGZ $NAK

December 28, 2016January 2, 2017 Curt MelonopolyTrading Plan$ASM, $AUMN, $GALE, $GDX, $GGB, $GRL, $NAK, $NUGT, $OCRX, $ORIG, $RADA, $USLV, $UWT, $VGZ, Day-trading, GLD, Pre-Market, SLV, Stocks, Trading Plan, USD/JPY, Wall Street, Watchlist

My Stock Trading Plan for Wednesday Dec 28, 2016 in Trading Chat room.  $OCRX, $GALE, $RADA, $GGB, $ORIG, $CEMP, $BBL $GLD $GDX $NUGT $SLV $USLV $UWT $AUMN, $ASM, $GRL, $VGZ, $NAK $DWT, $USOIL, $WTI, $GOLD, $USD/JPY, $SPY, $SILVER, $SI_F, $VIX, $UVXY $TVIX $NG_F… more.

Welcome to the morning Wall Street trading day session!

Important Notices:

REVIEW: If you are not reviewing the post market trade reports along with this please do so. We assume our trading room subscribers do review it everyday and as such there will often be information in that report that is applicable to and not included in this premarket report. You will find the post market reports on our blog daily before this one is published.

Reporting Status: Another quickie guys and gals! Until all year-end algos are reset this week you can expect these premarket reports to be quick for now!

New Service Options: We now also offer a stand-alone trading room option now (vs. bundle w/ trading room, premarket newsletter and alerts) at 59.00.

New Service Options: EPIC the Oil Algo now has an Oil Report only option (vs. bundle w/ 24 hr trading room launching early 2017) at 199.00.

New Service Options: Entry-Level trader one-on-one trade coaching and entry-level trade academy options now available in addition to intermediate / advanced trading academy and coaching.

Feature Post: There is a new feature blog post at this link, “Why our Stock Algorithms are Different than Most“. If you are using our algorithms or charting it is a must read.

Room Settings: We are testing fault settings for multiple trading rooms in 2017 (main room, momentum, options, swing, commodities, etc). We can have groups in different rooms all seeing same screen and announcements / broadcast – if you’re moved don’t sweat it – it won’t affect your experience.

Current Holds:

$CBMX, $JUNO, $DUST(definitely looking for a way out on $DUST)

Market Outlook:

As mentioned previous, all algos (Oil, SPY, Gold, Silver, Dollar, VIX) have hit their targets now (long term since July and short term) so we are running calculation targets for all six algos for all time charting time-frames and expect these reports to start rolling out this week (Gold and oil out last night).

Morning Momo / News Bits:

Momo $OCRX, $GALE, $RADA, $GGB, $ORIG, $CEMP, $BBL $JDST $VALE $RIO $DGAZ $URA $YELP

8:55
Redbook Chain Store Sales

10:00
Pending Home Sales

11:30
2-Year FRN Auction

1:00 PM
5-Year Note Auction

Time to watch the metals close and crude is on the move again! $UWT $GLD, $GDX, $NUGT, $SLV, $USLV, $AUMN, $ASM, $GRL, $VGZ, $NAK

PREMARKET, Metals, Crude
Stockmarket, Pre-Market, Trading Plan, Wall Street, Stocks, Day-trading, Watchlist, Chatroom,

If you are new to our trading service you should review recent blog posts and at minimum of our algorithm Twitter feeds because they do tell a story in terms of the market and how the inflections of the market determine our day to day trading. And you will notice quickly that the algos have been undeniably accurate on many time-frames (intra-day and months out) so I myself have learned to respect their math (they have taken me from a 60% hit rate to 80% in my trading – all publicly posted live trades). A quick hour of review at most will bring you up to date.

The algorithm Twitter feeds can be found here: $WTI (@EPICtheAlgo), $VIX (@VexatiousVIX), $SPY (@FREEDOMtheAlgo), $GLD (@ROSIEtheAlgo), $SLV (@SuperNovaAlgo), $DXY (@DXYUSD_Index). Our lead trader Twitter feed is here @curtmelonopoly, lead developer @hundalSHS, and newest trader @quadzilla_jr.

Momentum Stocks (Market Open and Intra-Day):

I do trade morning momo stocks (at times), but I do avoid risk – so often I avoid the first 30 minutes (gap and go) and trade momentum stocks later in the day after the wash-out looking for a snap-back. Just prior to open and shortly after open I post momentum stocks to the trade chat room (and Twitter ans Stocktwits if I have time).

Some of my Favorite Set-Ups:

(1) Momentum Stock Wash-Outs for Snap Back, (2) Bad News Wash-outs on Stocks with High Institutional Ownership, (3) Getting on the Right Side of a Trend Change and scaling in my position and (4) Our Algorithm Set-Ups.

The momentum stocks (from previous days and morning trade) I continue to watch through the day for indicators that allow a trade.

Morning Stock Watch-Lists for my Favorite Set-Ups:

(1) Pre-Market Gainers Watch-List: Gainers: $OCRX, $RADA, $GGB, $ORIG, $CEMP, $BBL $JDST $VALE $RIO $DGAZ $URA $YELP   I will update before market open or refer to chat room notices.

(2) Pre-market Decliners Watch-List: I will update before market open or refer to chat room notices.

(3) Other Watch-List: $AGIO (recent wash-out), $SGY (recent swing), $CBMX (current swing), $JUNO (current swing), $ANF (previous wash-out on news), $SKLN (previous wash-out on news), $URBN (previous wash-out on news).

(4) Regular Algo Charting Watch-List: Gold $GC_F $GLD, Miners $GDX ($NUGT, $DUST, $JDST, $JNUG), Silver $SLV $SI_F ($USLV, $DSLV), Crude Oil FX: $USOIL $WTI ($UWTI, $DWTI, $USO, $UCO, $CL_F, $UWT, $DWT), Natural Gas $NG_F ($UGAZ, $DGAZ), S & P 500 $SPY $ES_F ($SPXL, $SPXS), US Dollar Index $DXY ($UUP), Volatility $VIX ($TVIX, $UVXY, $XIV)

(5) Upgrades: I will update before market open of refer to chat room notices.

(6) Downgrades: I will update before market open or refer to chat room notices.

Stay tuned in Stock Chat Room for more pre-market stocks on watch.

Regular Trades:

S & P 500: $SPY $ES_F ($SPXL, $SPXS)

It’s looking like in futures overnight we’re going to get some lift Wednesday.

As I wrote last week:

I wrote about resistance the algo alerted at 227.80. This is still in play FYI. However, the Fed will determine now naturally whether we trend up or down from where we are. My bias is up until new year BUT I WOULD BE READY because money could get caught offside. Who knows?

As pre previous and our algorithm call before election…. My bias is still to new highs but I am looking at a pull-back Christmas / Early 2017.

As above in my intro and previous, the chart ain’t broke till its broke. When its broke we’ll let you know.

My Trading Plan: Right now I am trading $XIV instead of $SPXL or $SPXS. I do this because we are in a trend of crushed volatility. Now, when that changes and volatility starts to rise again (even if $SPY is rising at the same time) then I’ll flip over to trading $SPXL and $SPXS instead of $XIV.

Volatility: $VIX ($TVIX, $UVXY, $XIV)

NA

Outlook:

As I wrote this and last week:

As above, I am thinking opportunity comes between Christmas and Trump, and by the way, when $VIX spikes the easiest play is short short short. FYI.

CNN Fear and Greed Index: http://money.cnn.com/data/fear-and-greed/

My Trading Plan for Volatility: I will likely follow that trend with $TVIX $UVXY $XIV buys at range pivots / pending price action, volume and other geo events. SHORT $VIX SPIKES!

Currencies and Other Global Markets: $DXY US Dollar Index ($UUP US Dollar Bull, $UDN British Pound, $USD/JPY, $FXY Japanese Yen Trust, $CNY China, $TZA, $SMK / $EWW Mexico Capped ETF)

Watching $USDJPY now close for a top. Symmetry is in play on the chart, there is some divergence (although not broke) and metals are starting to front-run.

Per previous:

USDJPY is getting close to symmetry on the chart from the last run up about two years ago – charting on deck in coming reports!!!

Per previous:

BE VERY CAREFUL LISTENING TO THE $USD/JPY bears – they have been feeding misery to followers for many weeks – the chart is not broke – price is currently at support and there could easily be another leg up – nobody knows but the trend is your friend!

My Trading Plan for Currencies / Global Markets: Waiting, waiting, waiting. $USDJPY CHART IS NOT BROKEN! IT IS A BULL UNTIL IT IS NOT…

Gold: $GLD ($UGLD, $DGLD). Miners: $GDX ($NUGT, $DUST, $JDST, $JNUG)

So we have started to see some action in Gold and Miners so it these are on high watch with me right now.

Per recent posts:

I am waiting for the trend reversal. We are very close to the price target at the bottom of that quadrant at 1133.00 ish. The initial wide frame target Rosie the algo nailed but there has been a wait and see for a reversal because of one more possible leg down. Getting very close IMO.

I haven’t started to take trades yet because I am waiting for “price – trigger – trade” set-ups. I will start chewing around the edges of stocks like $NUGT and $GLD likely. The idea is to get on the right side of the trade and trend.

WE SHOULD BE ALMOST THERE! GET READY! LIKELY BETWEEN CHRISTMAS AND TRUMP POWER TRANSFER! CHARTS COMING!

Other equities I like for Gold, Miners, Silver Trade: $AUMN, $ASM, $GRL, $VGZ, $NAK – building more complete list now.

Silver $SI_F: $SLV ($USLV, $DSLV)

Same with Gold and miners – on high watch.

Per previous;

Same as Gold – we’re waiting for a decision from market so we can get algo targets.

My Plan for Trading Silver: same

Same as Gold, I’m waiting for the “price – trigger – trade” set-ups… I am going to start chewing around the edges of stocks when set-up confirms like $USLV and $SLV attempting to get on right side of trend trade.

Other equities I like for Gold, Miners, Silver Trade: $AUMN, $ASM, $GRL, $VGZ, $NAK – building more complete list now.

Crude Oil FX : $USOIL $WTI ($UWTI, $DWTI, $GUSH, $ERX, $DRIP, $ERY, $USO, $UCO, $SCO, $UWT, $DWT, $CL_F)

Outlook:

Crude overnight is trading right below a major resistance.

Per Previous:

Last week Tuesday algo target at 4:30 hit and Wednesday 10:30 AM both targets hit to the cent and second and Friday Algo target was a near miss and this week Tuesday 4:30 hit and Wednesday just in to target but not a perfect hit (very tradeable though). Friday targets on charting BUT BE CAUTIOUS WITH FRIDAY TARGETS.

Trading Plan: Watching for a break to upside of resistance with volume for a long entry in $UWT today!

Other Equities I like for Oil or Energy Trade: Tape / Chart – $ETE, $RIG. High Short Interest – $CRC, $EPE, $WLL, $RES, $JONE, $AREX, $REN, $CLR, $HP, $ATW, $SGY. Fundamentals: $EOG, Pipelines – $XLE: $HEP, $SXE, $KMI, $DPM, $TGS, $ENB, $EEP, $PTRC, $HGT

Natural Gas $NG_F $NATGAS ($UGAZ, $DGAZ):

NA – I nailed the alerts in recent weeks with lift but didn’t trade t and don’t expect to anytime soon. Watching.

Study:

Now that a number of blog posts are being unlocked, it wouldn’t be a bad idea for traders to review them (especially new traders).

Free scanners to find momentum stocks that you can easily review charts of for indicators that bring probability of your trade being successful up considerably. These are not useful for first 30 minute market open gap and go type plays (you need a good momentum scanner, level 2, and best to have hot-keys for the first 30 mins of gap and go trading)… but are very useful for intra day scalping (start with trending stocks and then look at indicators intra for simple set-ups – study scan study scan study scan).

http://finviz.com/

https://finance.yahoo.com/screener/predefined/ec5bebb9-b7b2-4474-9e5c-3e258b61cbe6

http://www.highshortinterest.com/

http://www.gurufocus.com/short-stocks.php

http://www.3xetf.com/all/

http://www.etf.com/channels/gold-etfs

GL!

Curtis

Article Topics: $OCRX, $RADA, $GGB, $ORIG, $CEMP, $BBL, $GLD, $GDX, $NUGT, $SLV, $USLV, $UWT, $AUMN, $ASM, $GRL, $VGZ, $NAK, $USDJPY, Stockmarket, Pre-Market, Trading Plan, Wall Street, Stocks, Day-trading, Watchlist, Chatroom, $CBMX, $JUNO, $DUST, $UWT, $GOLD, $SILVER, $USD/JPY, $USOIL, $WTI, $VIX, $SPY, $NATGAS, $DWT, $SLV, $GLD, $DXY

Read More
Member Oil Trade Update Wed Dec 28 Charting Algo FX: $USOIL $WTIC – $USO $CL_F $UWT $DWT $UCO $SCO $ERX $ERY $GUSH $DRIP

Member Oil Trade Update Wed Dec 28 Charting Algo FX: $USOIL $WTIC – $USO $CL_F $UWT $DWT $UCO $SCO $ERX $ERY $GUSH $DRIP

December 28, 2016January 2, 2017 Epic the AlgoCrude Oil Trading Algorithm (EPIC)$CL_F, $DRIP, $ERX, $ERY, $GUSH, $UCO, $USO, $UWT, Algo, Algorithm, Chart, Crude Oil FX: $USOIL $WTI, DWT, EPIC the Oil Algo, Fibonacci, Indicators, Targets, Trading Room

Wed Dec 28, 2016 EPIC the Oil Algo Oil Report (Member Edition). FX: $USOIL $WTIC – $USO $CL_F $UWT $DWT $UCO $SCO $ERX $ERY $GUSH $DRIP

Welcome to my new FX: $USOIL $WTI oil trade report. My name is EPIC the Oil Algo.

As I am writing this update, crude oil just did this:

Crude, Oil, $USOIL, Chart
Crude algo intra work sheet 319 AM Dec 28 FX $USOIL $WTIC #OIL $CL_F CL $USO $UCO $SCO $UWT $DWT #OOTT

NOTICES:

NEW SERVICE OPTIONS: My algorithmic modeling daily oil reports are now available separate of the 24 hour oil trade room / oil reports bundle.

CHARTING: Charts will be cluttered for a number of days with technicians processing multiple calculations for 2017 algorithmic models.  

ALERTS: We are having a technical coding issue with SMS text / email alert launch – will be resolved soon! For now we are emailing alerts as time allows.

MUST READ: There is a feature blog post at this link, “Why our Stock Algorithms are Different than Most“. If you are viewing our algorithmic model charting it is a must read.

MULTI-USERS: Institutional / commercial platform now available.

PATENT PHASE: I am now in patent application phase. Stay tuned for agreements concerning disclosure and use coming to members.

24 HOUR TRADE ROOM: My charting transitions from FX $USOIL $WTI to 24hr crude oil futures early 2017. My sub service w incl 24 hr crude oil trade room.

ACCESS: My proprietary services transitioned recently from public inaugural to subscriber only access. All rates for existing members for all service prices (including price increases) will be grandfathered in perpetuity (view website products page for conditions). Early 2017 when my 24 hour futures trading room opens along with 24 hour live charting I will have a rate increase but as with recent the roll-over existing members will be grandfathered at locked-in current rates.

SOFTWARE: My algorithmic charting is going to developer coding phase early 2017 for our trader’s dashboard program. Please review my algorithm development process and about my oil algorithm story on our website www.compoundtrading.com and my oil algo charting posts on my Twitter feed and this blog.

HOW MY ALGORITHM WORKS: I am an algorithm in development. My math is based on traditional indicators (up to fifty at any given time each weighted on win ratio merit – all not shown on chart at any given time) – such as simple math calculations relating to price and volume, Fibonacci, simple pivots, moving averages, Gann, Schiff and various other charting, geometric and mathematical factors. I do not yet have AI or Geo Political integration – only math as it relates to traditional indicators with the primary goal being probabilities. I am not a high frequency or bot type algorithm – I am represented on and used on a traditional trading chart as one would normally use as a probability indicator. The goal is to provide our trader’s with an edge when triggering entries and exits on trades with instruments that rely on the price of crude oil (specifically FX: $USOIL $WTI and transitioning to futures in the new year in our new 24 hour oil trading room).

Below you will find my simplified view of levels that can be used on a traditional chart (both intra-day and as a swing trader or investor). This work, and subsequent trading, should be considered one decision at a time, “if this happens then this or this are my targets”… price – trigger – trade and so on. Questions to; [email protected], message our lead trader on Twitter, or message a lead trader privately in the trade room.

EVERY CALL WE MAKE, EVERY PUBLIC INTERACTION, REPRESENTATION OF TRADE (ON EVERY VENUE) IS VIDEO RECORDED (TRADING ROOM), ON SOCIAL MEDIA OR ON BLOG / WEBSITE TIME-STAMPED FOR PERMANENT RECORD AND ABSOLUTE TRANSPARENCY. PLEASE ALSO REFER TO OUR PUBLIC DISCLOSURE https://compoundtrading.com/disclosure-disclaimer/.

FX: $USOIL $WTI Observations:

Below is the link for the live EPIC the Oil Algo Live Trading Chart for Wednesday Dec 28, 2016.

https://www.tradingview.com/chart/USOIL/z7mqsUZu-EPIC-the-Oil-Algo-Member-Chart/

Intra-day Crude Oil Trading Range: At time of writing FX $USOIL $WTI is trading at 53.88 2:56 AM ET Dec 28, 2016. Some thoughts with respect to traditional charting that may help advance the trading edge:

Crude, Oil, Chart, $USOIL
Crude algo intra work sheet 257 AM Dec 28 FX $USOIL $WTIC #OIL $CL_F CL $USO $UCO $SCO $UWT $DWT #OOTT

Multi Week Trading Range for Swing Trading:

Note: Be careful with the prices you see in the purple boxes on the right of the chart – they do not line up on chart for price action (they are for indicators).

Pay attention to the upward trending channel – you can enter long and sell in between the channel yellow lines as it trends. If price stays below the resistance then you trade the channel under that and if above a major support line same thing (yellow lines).

Price is currently trading above a horizontal support at 51.93 (yellow line) – watch this for support. Resistance is at 54.39. Review charts over the previous week on my blog to see yellow support and resistance lines and channel that I refer to.

Refer to my previous posts re: Green arrows on chart are highest probability trade entries for short or long positions – while crude is trading in upward channel (like it is) your probability is always higher going long until channel broken. Trading at outside of channel increases probability of success also.

Diagonal Trend Lines:

Diagonal trend-lines (blue). Diagonal trend-lines are critical inflection points. Please review many of my recent posts so you can learn about how important these diagonal trend-lines are. If one is breached you can look to pull-back to next diagonal blue trend line about 90% of the time. Also pay attention to how thick the lines are – the thicker the line the more important because they represent extensions from previous time / price cycles.

Remember you can come in to the chat room to message the trader and REMEMBER I have posted a live chart link earlier in this post so if you can’t see the lines well on this chart above you can go to the live chart link and watch for member live algo chart links through-out the day in your email inbox!

There are at least three (at least at time of writing) diagonal trend-lines under where crude is trading intra and they have been holding well in recent trade.

Price Action with 20, 50, 100, 200 MA

It is wise to study how the 20, 50, 100, 200 MA trade on each time-frame before trading oil related instruments. Below are a few examples.

Below is how oil has been trading with 20 MA on the 4 hour chart – fairly predictable buy / sell triggers. It is preferable to sell at the top of the move if you can time it and not wait for the 20 MA to trigger to downside. While crude is trading under 20 MA advantage is to short side and over advantage to long side. Keep in mind while trade remains in upward trending channel like it is now short side probability is lower than it would be otherwise.

Crude trading well above 20 MA on 4 Hour and on its way to recent high. Crude algo intra work sheet 309 AM Dec 28 FX $USOIL $WTIC #OIL $CL_F CL $USO $UCO $SCO $UWT $DWT #OOTT

Crude, Oil, Chart, 20 MA
Crude trading well above 20 MA on 4 Hour and on its way to recent high. Crude algo intra work sheet 309 AM Dec 28 FX $USOIL $WTIC #OIL $CL_F CL $USO $UCO $SCO $UWT $DWT #OOTT

Fibonacci Levels:

Watch these lines for support and resistance. Careful using them as traditional retracement levels with crude because the algo lines etc are more dominant / predictable. But the Fib lines are excellent indicators for intra-day trade support and resistance.

There are fib levels on the chart below – but they may just confuse you more than anything. We are currently running calculations with our modeling on how fib levels relate to our targets and trade levels – so the chart below is more mad science than anything because this is simply a live shot of work we are in the middle of – and we understand the levels can be difficult to make out.

When you get a feel for how the fib levels reflect intra trading (which we cannot explain in short here) you will always have them on your chart in a similar manner.

Fibonacci. Crude algo intra work sheet 345 AM Dec 28 FX $USOIL $WTIC #OIL $CL_F CL $USO $UCO $SCO $UWT $DWT #OOTT

Fibonacci, Crude, Oil, Chart, $USOIL
Fibonacci. Crude algo intra work sheet 345 AM Dec 28 FX $USOIL $WTIC #OIL $CL_F CL $USO $UCO $SCO $UWT $DWT #OOTT

Horizontal Trend-Lines (purple):

Horizontal trend-lines are not as important as the other indicators reviewed above, however, they do serve as important resistance and support intra-day for tight trading and they are important if thick (in other words they come from previous time / price cycles). WE STARTED TO REPRESENT THE REALLY IMPORTANT LINES IN YELLOW FYI FOR EASE. Refer to chart for current applicable horizontal trend-lines.

Advanced Charting:

Respect support and resistance lines: If you can be patient and take your long and short positions against these yellow lines – that is your highest probability trading.

You will see a lot of noise on the charts over the next few weeks (algorithmic calculations of various types). Try and ignore for now.

Oil Time / Price Cycles:

Time / price cycles are the single most important indicator and my record calling them is near 100% – since inception seven months ago. The reason they are so important is that a trader does not want to be holding a crude oil instrument at termination of a time cycle if not absolutely sure if price will go up or down. A trade may choose to enter a large position in advance of a time price cycle termination IF THERE IS A HIGH PROBABILITY OF A DIRECTION IN PRICE and if the market is trading at a really important pivot area. In other words, if the market is trading at the bottom of the upward trending channel at a support (yellow lines) and we knew there was a significant probability of a time cycle about to terminate a trader may enter with a long position. The price really spikes or drops significantly when these important time cycles terminate.

The problem with time / price cycle terminations is they change from minute to minute (depending on where price is on the chart) so you have to be in the trade room to get the alert. Our lead traders will do everything they can in future to send these on SMS but we have to be careful because it can be difficult with so much going on in the room. The reason they (time cycles) change is because they are actually represented by or are geometric shapes in the chart – I know it sounds odd but I have (as I mentioned) hit these calls just shy of 100%. The oil political people know the same algorithmic modeling principles and they ALWAYS TIME THEIR BIG ANNOUNCEMENTS AROUND THE TIME PRICE CYCLE TERMINATIONS.

So if you can picture a triangle on the chart – and price is trading in the triangle – and price is going to come to the edge of the triangle and there is a significant support or resistance or an algo line terminating there too or a target (those type of things)… then we know there is a high probability of a time and price change. In other words, it is where there are clusters of algorithm points that cross and when price is going to cross over that cluster is where they are. And these are represented on all the different time frames – the larger the time frame – the larger the time price cycle termination – the larger the spike or downdraft. This is where we establish our intra-day quadrants from for sniping trades (which we will put in to the room soon because it looks like the geo political rhetoric is over for a while making them more predictable). Difficult to explain in short. So we will do our best to SMS alert these in future.

Also, the real large or important time / price cycle terminations we know far in advance and they can be put in these newsletters.

If you review my Epic the Oil Algo Twitter feed, my blog posts and my story on our website you will get a feel for how accurate these calls are.

Time Price Cycle Terminations. Crude algo intra work sheet 404 AM Dec 28 FX $USOIL $WTIC #OIL $CL_F CL $USO $UCO $SCO $UWT $DWT #OOTT

The white arrows show you where terminations are that correspond with possible intra trade – if trade is in a corresponding triangle the end of that triangle where the arrows are is where the termination point (at latest) is. There are many where crude is trading intraday. Careful here – we see a significant spike up or down coming.

Time Price Cycles, Crude, Oil, Chart
Time Price Cycle Terminations. Crude algo intra work sheet 404 AM Dec 28 FX $USOIL $WTIC #OIL $CL_F CL $USO $UCO $SCO $UWT $DWT #OOTT


Alpha Algo Trading Trend-Lines (Red dotted lines):

There is a new alpha algo line on this chart and new algo targets for Tues, Wed and Friday this week.

To determine which algo line is most alpha (or probable) intra day, it is the nearest line to price action. This can also help you determine the trend of trade. If the algo line is trending up the price will follow it up until price is tested at an algorithm indicator (the main tests are diagonal trendlines, horizontal trendlines, time / price cycles etc – as I have shared with you). This is why it is important to watch all the lines because they are all support and resistance. To keep it simple trade the range (yellow lines) as I’ve mentioned but keep an eye on these indicators.

Current Alpha Algo Targets (Red circles):

Due to multiple requests we will start publishing our targets weekly not only on the charts (with circles and algo lines) but also as numeric listed targets with associated probabilities for each target on each day again (we recently stopped doing this but a number of traders have requested we do this again so we will start again next week). You can see how I used to do this on my Twitter feed.

So what is your most probable algo target for Wednesday 10:30 AM EST etc? Your closest target that crude is trending toward is always the most probable. Crude is currently trending toward a target (red circles on chart) Then, your second most probable is the one that is up or down trend depending on whether general price is in an upward or downtrend for the most recent week or so and what your other indicators look like (such as the MA’s I explained above).

This week alpha algo targets are as follows (with associated hit probability – how many times out of 100 a hit is expected): ADJUSTED!

Wednesday 10:30 AM EST – 50.87 (3%), 53.53 (45%), 54.72 (56%), 55.22 (37%)

Friday 1:00 PM EST – 51.23 (2%), 54.06 (41%), 55.35 (51%), 56.32 (31%) 

Friday’s algo targets have not been near as predictable as Tues and Wed (shy of 80% now vs 90%+) and this Friday looks no different so be cautious with this Friday’s targets!

The other way to determine which targets are in play is actually quite simple, you will notice that crude trades between the channel lines up and down and up and down and there are various support and resistance along the way. If it hits a target at the top of the channel you can bet most times (unless the next day like today) that the next target hit will be at the bottom of the channel or whatever – also difficult to explain – WE ARE DOING A VERY DETAILED VIDEO ON THESE INDICATORS SOON THAT WILL SHOW IN MORE DETAIL.

The targets for this week are represented on the chart. Again, refer to the live charting I send you for this also or be in the trading room.

Wait for the price to trend toward a target and take your position and watch as price gets closer and closer to the target. Remember, that the machines trade from decision to decision – or in other words from support to next resistance or resistance to next support or when the times come each week on Tuesday Wednesday and Friday they will trend toward the target that market price action determines they go to.

Our lead trader will explain more in the room and do not hesitate to ask our lead trader in the room by private message or on twitter to explain intra day decisions.

Oil Intra-Day Algo Trading Quadrants:

Processing now for release soon (you are seeing the beginning of them above in charts now) – I don’t think there are any real tight crude related snipers beyond our lead trader right now anyway – but nonetheless, we are getting these out – they take a lot of data processing to say the least. We’re almost there.

Indicator Methods:

As explained above, my algorithm is a consideration of up to fifty traditional indicators at any one time – each one given its own weight in accordance to its accuracy (win rate). This is how we establish the probability of specific targets hitting (we call them alpha algo targets).

Alpha Algo Targets, Algo Trend-lines, Algo Timing, Quadrants for Intra Snipes:

Algo targets are the red circles – they correspond with important times each week in oil reporting land. Tuesday 4:30 PM, Wednesday 10:30 AM and Friday at 1:00 PM. The red dotted diagonal lines are the algo trend-lines. And the vertical dotted (red or green) are marking the important times each week. You will find that the price of crude will hit one of the alpha algo targets about 90% of the time. In the absence of market direction the machines take price to the next algo line and/or target. Understanding how the price of crude reacts to the algos and how they move price from target to target is critical for intra-day and swing trading crude oil and associated instruments.

You will notice that price action of crude will use these algo trend-lines and act as support and resistance, and that price also often violently moves when an alpha algo line is breached either upward or downward.

We cover this in much more detail in the member updates, trading room. A review of my Twitter feed and previous blog posts will help you understand the relation of these indicators. We will start posting video blogs (for my subscribers) on YouTube (in addition to my daily blog posts) for swing traders that work during regular trading hours.

Also… we will cover how to establish algo trend-lines and price targets future forward (as you have seen me do on my Twitter feed for some time now).

Conclusion:

That is a good place to leave it for now – we will review details of the above in the trading room and when time allows we will segment for our swing traders (and publish) videos of the work we do in the trading room.

See you in the live trade room and if not stay tuned for our videos recapping what happens in the room! And again, if you struggle to know how to use these indicators as a trader’s edge, it is recommended (if you have earnestly reviewed all of our documentation first) that you obtain private coaching prior to trading a real account with real money – we recommend you use a paper trading account at first. And finally, we will be publishing a “how to use guide” soon, but it will be simply be a recap (consolidation) of instructions in this post, from my Twitter feed, and previously published information on our blog and website. You can also send specific questions to our email inbox at [email protected] – if you do this be sure to ask a specific question so it can be answered specifically. When the 24 hour oil trading room opens you will have ample opportunity in that 24 hour room to ask questions also.

Watch my EPIC the Oil Algo Twitter feed for intra day notices and your email in box for member only material intra day also.

EPIC the Oil Algo

PS If you are not yet reviewing the daily post market trading results blog posts, please do so, they are on the blog daily and often there is information that also may assist your trading. Trade room transcripts (for example) may review topics pertinent to your trading.

https://twitter.com/EPICtheAlgo/status/811327478845218816
Article topics: EPIC the Oil Algo, Crude Oil FX: $USOIL $WTI, $USO, $UCO, $CL_F, $UWT, $DWT, $ERX, $ERY, $GUSH, $DRIP, Chart, Algorithm, Indicators, Trading Room, Fibonacci, Algo, Targets

Read More

PreMarket Newsletter Tues Dec 27 $JNUG $IONS $NAK $NUGT $SDRL $USOIL $WTIC $UWT $SPY $GLD $GDX $SLV…

December 27, 2016January 2, 2017 Curt MelonopolyTrading Plan$CBMX, $IONS, $JNUG, $JUNO, $NAK, $NATGAS, $NUGT, $SDRL, $USOIL $WTI, $UWT, Day-trading, GLD, Gold, Pre-Market, Silver, SLV, SPY, Stockmarket, Stocks, Trading Plan, VIX, Wall Street, Watchlist

My Stock Trading Plan for Tuesday Dec 27, 2016 in Trading Chat room.  $JNUG $IONS $NAK $NUGT $SDRL $DWT $UWT, $USOIL, $WTI, $GOLD, $GLD, $GDX, $USD/JPY, $SPY, $SILVER, $SLV, $SI_F, $VIX, $UVXY $TVIX $NG_F… more.

Welcome to the morning Wall Street trading day session!

Important Notices:

REVIEW: If you are not reviewing the post market trade reports along with this please do so. We assume our trading room subscribers do review it everyday and as such there will often be information in that report that is applicable to and not included in this premarket report. You will find the post market reports on our blog daily before this one is published.

REPORTING STATUS: Another quickie guys and gals! Until all year-end algos are reset this week you can expect these premarket reports to be quick for now!

Current Holds:

$CBMX, $JUNO, $DUST

Market Outlook:

As mentioned previous, all algos (Oil, SPY, Gold, Silver, Dollar, VIX) have hit their targets now (long term since July and short term) so we are running calculation targets for all six algos for all time charting time-frames and expect these reports to start rolling out this week (Gold and oil out last night).

Morning Momo / News Bits:

Momentum stocks:  $JNUG $IONS $NAK $NUGT $SDRL $NVCN, $USLV $UGAZ $AG $CNAT $SLW $GDXJ $ABX $MTL $GDX $UNG $NVDA

S&P +0.07%.

10-yr -0.1%.

Euro -0.11% vs. dollar.

Crude +0.26% to $53.16.

Gold +0.86% to $1,143.35.

Global stocks inch higher in holiday lull.

$SCMP gets rating upgrade, $IONS receives approval, $CAH settles suit.

Seattle Genetics announces clinical hold on Phase 1 trails of SGN-CD33A. $SGEN halted premarket. #biotech #stocks

Fred’s adopts poison pill http://seekingalpha.com/news/3232524-freds-adopts-poison-pill?source=twitter_sa_factset … #premarket $FRED

$PAAS +2.4% premarket after acquiring ownership and control of an additional 10M common shares of Maverix Metals for $5.46M. 

Endologix shares tumble 14% in premarket trade.

$APRI Apricus Biosciences Announces the Launch of Vitaros® for the Treatment of Erectile Dysfunction.

$IONS SPINRAZA™ (nusinersen) Approved in U.S. to Treat Broad Range of Patients with Spinal Muscular Atrophy

$DRYS Enters Into $200 Million Common Stock Purchase Agreement With Kalani Investments Limited 

If you are new to our trading service you should review recent blog posts and at minimum of our algorithm Twitter feeds because they do tell a story in terms of the market and how the inflections of the market determine our day to day trading. And you will notice quickly that the algos have been undeniably accurate on many time-frames (intra-day and months out) so I myself have learned to respect their math (they have taken me from a 60% hit rate to 80% in my trading – all publicly posted live trades). A quick hour of review at most will bring you up to date.

The algorithm Twitter feeds can be found here: $WTI (@EPICtheAlgo), $VIX (@VexatiousVIX), $SPY (@FREEDOMtheAlgo), $GLD (@ROSIEtheAlgo), $SLV (@SuperNovaAlgo), $DXY (@DXYUSD_Index). Our lead trader Twitter feed is here @curtmelonopoly, lead developer @hundalSHS, and newest trader @quadzilla_jr.

Momentum Stocks (Market Open and Intra-Day):

I do trade morning momo stocks (at times), but I do avoid risk – so often I avoid the first 30 minutes (gap and go) and trade momentum stocks later in the day after the wash-out looking for a snap-back. Just prior to open and shortly after open I post momentum stocks to the trade chat room (and Twitter ans Stocktwits if I have time).

Some of my Favorite Set-Ups:

(1) Momentum Stock Wash-Outs for Snap Back, (2) Bad News Wash-outs on Stocks with High Institutional Ownership, (3) Getting on the Right Side of a Trend Change and scaling in my position and (4) Our Algorithm Set-Ups.

The momentum stocks (from previous days and morning trade) I continue to watch through the day for indicators that allow a trade.

Morning Stock Watch-Lists for my Favorite Set-Ups:

(1) Pre-Market Gainers Watch-List: Gainers: $JNUG 7%, $IONS 7%, $NAK 5%, $NUGT 5%, $SDRL 5%, $NVCN, $USLV $UGAZ $AG $CNAT $SLW $GDXJ $ABX $MTL $GDX $UNG $NVDA I will update before market open or refer to chat room notices.

(2) Pre-market Decliners Watch-List: I will update before market open or refer to chat room notices.

(3) Other Watch-List: $AGIO (recent wash-out), $SGY (recent swing), $CBMX (current swing), $JUNO (current swing), $ANF (previous wash-out on news), $SKLN (previous wash-out on news), $URBN (previous wash-out on news).

(4) Regular Algo Charting Watch-List: Gold $GC_F $GLD, Miners $GDX ($NUGT, $DUST, $JDST, $JNUG), Silver $SLV $SI_F ($USLV, $DSLV), Crude Oil FX: $USOIL $WTI ($UWTI, $DWTI, $USO, $UCO, $CL_F, $UWT, $DWT), Natural Gas $NG_F ($UGAZ, $DGAZ), S & P 500 $SPY $ES_F ($SPXL, $SPXS), US Dollar Index $DXY ($UUP), Volatility $VIX ($TVIX, $UVXY, $XIV)

(5) Upgrades: I will update before market open of refer to chat room notices.

(6) Downgrades: I will update before market open or refer to chat room notices.

Stay tuned in Stock Chat Room for more pre-market stocks on watch.

Regular Trades:

S & P 500: $SPY $ES_F ($SPXL, $SPXS)

NA 

As I wrote last week:

I wrote about resistance the algo alerted at 277.80. This is still in play FYI. However, the Fed will determine now naturally whether we trend up or down from where we are. My bias is up until new year BUT I WOULD BE READY because money could get caught offside. Who knows?

As pre previous and our algorithm call before election…. My bias is still to new highs but I am looking at a pull-back Christmas / Early 2017.

As above in my intro and previous, the chart ain’t broke till its broke. When its broke we’ll let you know.

My Trading Plan: Right now I am trading $XIV instead of $SPXL or $SPXS. I do this because we are in a trend of crushed volatility. Now, when that changes and volatility starts to rise again (even if $SPY is rising at the same time) then I’ll flip over to trading $SPXL and $SPXS instead of $XIV.

Volatility: $VIX ($TVIX, $UVXY, $XIV)

NA

Outlook:

As I wrote this and last week:

As above, I am thinking opportunity comes between Christmas and Trump, and by the way, when $VIX spikes the easiest play is short short short. FYI.

CNN Fear and Greed Index: http://money.cnn.com/data/fear-and-greed/

My Trading Plan for Volatility: I will likely follow that trend with $TVIX $UVXY $XIV buys at range pivots / pending price action, volume and other geo events. SHORT $VIX SPIKES!

Currencies and Other Global Markets: $DXY US Dollar Index ($UUP US Dollar Bull, $UDN British Pound, $USD/JPY, $FXY Japanese Yen Trust, $CNY China, $TZA, $SMK / $EWW Mexico Capped ETF)

NA

Per previous:

USDJPY is getting close to symmetry on the chart from the last run up about two years ago – charting on deck in coming reports!!!

Per previous:

BE VERY CAREFUL LISTENING TO THE $USD/JPY bears – they have been feeding misery to followers for many weeks – the chart is not broke – price is currently at support and there could easily be another leg up – nobody knows but the trend is your friend!

My Trading Plan for Currencies / Global Markets: Waiting, waiting, waiting. $USDJPY CHART IS NOT BROKEN! IT IS A BULL UNTIL IT IS NOT…

Gold: $GLD ($UGLD, $DGLD). Miners: $GDX ($NUGT, $DUST, $JDST, $JNUG)

NA

Per recent posts:

I am waiting for the trend reversal. We are very close to the price target at the bottom of that quadrant at 1133.00 ish. The initial wide frame target Rosie the algo nailed but there has been a wait and see for a reversal because of one more possible leg down. Getting very close IMO.

I haven’t started to take trades yet because I am waiting for “price – trigger – trade” set-ups. I will start chewing around the edges of stocks like $NUGT and $GLD likely. The idea is to get on the right side of the trade and trend.

WE SHOULD BE ALMOST THERE! GET READY! LIKELY BETWEEN CHRISTMAS AND TRUMP POWER TRANSFER! CHARTS COMING!

Other equities I like for Gold Trade: $AUMN (penny stock). When the trend reversal confirms I will post all the Gold equity picks here.

Silver $SI_F: $SLV ($USLV, $DSLV)

NA

Per previous;

Same as Gold – we’re waiting for a decision from market so we can get algo targets.

My Plan for Trading Silver: same

Same as Gold, I’m waiting for the “price – trigger – trade” set-ups… I am going to start chewing around the edges of stocks when set-up confirms like $USLV and $SLV attempting to get on right side of trend trade.

Other equities I like for Silver trade: $AUMN (penny stock). Same here, when trend reversal occurs I will post equity picks here.

Crude Oil FX : $USOIL $WTI ($UWTI, $DWTI, $GUSH, $ERX, $DRIP, $ERY, $USO, $UCO, $SCO, $UWT, $DWT, $CL_F)

Outlook:

Per Previous:

Last week Tuesday algo target at 4:30 hit and Wednesday 10:30 AM both targets hit to the cent and second and Friday Algo target was a near miss and this week Tuesday 4:30 hit and Wednesday just in to target but not a perfect hit (very tradeable though). Friday targets on charting BUT BE CAUTIOUS WITH FRIDAY TARGETS.

Trading Plan: NA

Other Equities I like for Oil or Energy Trade: Tape / Chart – $ETE, $RIG. High Short Interest – $CRC, $EPE, $WLL, $RES, $JONE, $AREX, $REN, $CLR, $HP, $ATW, $SGY. Fundamentals: $EOG, Pipelines – $XLE: $HEP, $SXE, $KMI, $DPM, $TGS, $ENB, $EEP, $PTRC, $HGT

Natural Gas $NG_F $NATGAS ($UGAZ, $DGAZ):

NA

Study:

Now that a number of blog posts are being unlocked, it wouldn’t be a bad idea for traders to review them (especially new traders).

If you are trading relying on our charting or algorithms as trade indicators you should read this recent article,

Free scanners to find momentum stocks that you can easily review charts of for indicators that bring probability of your trade being successful up considerably. These are not useful for first 30 minute market open gap and go type plays (you need a good momentum scanner, level 2, and best to have hot-keys for the first 30 mins of gap and go trading)… but are very useful for intra day scalping (start with trending stocks and then look at indicators intra for simple set-ups – study scan study scan study scan).

http://finviz.com/

https://finance.yahoo.com/screener/predefined/ec5bebb9-b7b2-4474-9e5c-3e258b61cbe6

http://www.highshortinterest.com/

http://www.gurufocus.com/short-stocks.php

http://www.3xetf.com/all/

http://www.etf.com/channels/gold-etfs

GL!

Curtis

Article Topics: $JNUG, $IONS, $NAK, $NUGT, $SDRL, Stockmarket, Pre-Market, Trading Plan, Wall Street, Stocks, Day-trading, Watchlist, Chatroom, Small Cap Oil, $CBMX, $JUNO, $DUST, $UWT, $GOLD, $SILVER, $USD/JPY, $USOIL, $WTI, $VIX, $SPY, $NATGAS, $DWT, $SLV, $GLD, $DXY

Read More
Member Oil Trade Update Tues Dec 27 Charting Algo FX: $USOIL $WTIC – $USO $CL_F $UWT $DWT $UCO $SCO $ERX $ERY $GUSH $DRIP

Member Oil Trade Update Tues Dec 27 Charting Algo FX: $USOIL $WTIC – $USO $CL_F $UWT $DWT $UCO $SCO $ERX $ERY $GUSH $DRIP

December 27, 2016January 2, 2017 Epic the AlgoCrude Oil Trading Algorithm (EPIC)$CL_F, $DRIP, $ERX, $ERY, $GUSH, $UCO, $USO, $UWT, Algo, Algorithm, Chart, Crude Oil FX: $USOIL $WTI, DWT, EPIC the Oil Algo, Fibonacci, Indicators, Targets, Trading Room

Tues Dec 27, 2016 EPIC the Oil Algo Oil Report (Member Edition). FX: $USOIL $WTIC – $USO $CL_F $UWT $DWT $UCO $SCO $ERX $ERY $GUSH $DRIP

Welcome to my new FX: $USOIL $WTI oil trade report. My name is EPIC the Oil Algo.

NOTICES:

TRADE NEWS: Crude is trading at 53.16 (at 4:45 EST) – THERE IS A NEW ALGO LINE AND ALGO TARGETS ON THIS CHART. ALSO A LIST OF ALGO TARGETS WITH PROBABILITIES ARE LISTED IN ALGO TARGET SECTION BELOW.

NEW OPTIONS: My algorithmic modeling daily oil reports are now available separate of the 24 hour oil trade room / oil reports bundle.

CHARTING: Charts will be cluttered for a number of days with technicians processing multiple calculations for 2017 algorithmic models.  

ALERTS: We are having a technical coding issue with SMS text / email alert launch – will be resolved soon! For now we are emailing alerts as time allows.

MUST READ: There is a feature blog post at this link, “Why our Stock Algorithms are Different than Most“. If you are viewing our algorithmic model charting it is a must read.

MULTI-USERS: Institutional / commercial platform now available.

PATENT PHASE: I am now in patent application phase. Stay tuned for agreements concerning disclosure and use coming to members.

24 HOUR TRADE ROOM: My charting transitions from FX $USOIL $WTI to 24hr crude oil futures early 2017. My sub service w incl 24 hr crude oil trade room.

ACCESS: My proprietary services transitioned recently from public inaugural to subscriber only access. All rates for existing members for all service prices (including price increases) will be grandfathered in perpetuity (view website products page for conditions). Early 2017 when my 24 hour futures trading room opens along with 24 hour live charting I will have a rate increase but as with recent the roll-over existing members will be grandfathered at locked-in current rates.

SOFTWARE: My algorithmic charting is going to developer coding phase early 2017 for our trader’s dashboard program. Please review my algorithm development process and about my oil algorithm story on our website www.compoundtrading.com and my oil algo charting posts on my Twitter feed and this blog.

HOW MY ALGORITHM WORKS: I am an algorithm in development. My math is based on traditional indicators (up to fifty at any given time each weighted on win ratio merit – all not shown on chart at any given time) – such as simple math calculations relating to price and volume, Fibonacci, simple pivots, moving averages, Gann, Schiff and various other charting, geometric and mathematical factors. I do not yet have AI or Geo Political integration – only math as it relates to traditional indicators with the primary goal being probabilities. I am not a high frequency or bot type algorithm – I am represented on and used on a traditional trading chart as one would normally use as a probability indicator. The goal is to provide our trader’s with an edge when triggering entries and exits on trades with instruments that rely on the price of crude oil (specifically FX: $USOIL $WTI and transitioning to futures in the new year in our new 24 hour oil trading room).

Below you will find my simplified view of levels that can be used on a traditional chart (both intra-day and as a swing trader or investor). This work, and subsequent trading, should be considered one decision at a time, “if this happens then this or this are my targets”… price – trigger – trade and so on. Questions to; [email protected], message our lead trader on Twitter, or message a lead trader privately in the trade room.

EVERY CALL WE MAKE, EVERY PUBLIC INTERACTION, REPRESENTATION OF TRADE (ON EVERY VENUE) IS VIDEO RECORDED (TRADING ROOM), ON SOCIAL MEDIA OR ON BLOG / WEBSITE TIME-STAMPED FOR PERMANENT RECORD AND ABSOLUTE TRANSPARENCY. PLEASE ALSO REFER TO OUR PUBLIC DISCLOSURE https://compoundtrading.com/disclosure-disclaimer/.

FX: $USOIL $WTI Observations:

Below is the link for the live EPIC the Oil Algo Live Trading Chart for Tuesday Dec 27, 2016.

https://www.tradingview.com/chart/USOIL/mQ1tJztl-EPIC-the-OIL-ALGO-MEMBER-CHART/

Intra-day Crude Oil Trading Range: At time of writing FX $USOIL $WTI is trading at 53.15 4:50 AM ET Dec 27, 2016. Some thoughts with respect to traditional charting that may help advance the trading edge:

New Algo Targets – Algo Line. Crude algo intra work sheet 443 AM Dec 27 FX $USOIL $WTIC #OIL $CL_F CL $USO $UCO $SCO $UWT $DWT #OOTT

$USOIL, Chart
New Algo Targets – Algo Line. Crude algo intra work sheet 443 AM Dec 27 FX $USOIL $WTIC #OIL $CL_F CL $USO $UCO $SCO $UWT $DWT #OOTT

Multi Week Trading Range for Swing Trading:

Note: Be careful with the prices you see in the purple boxes on the right of the chart – they do not line up on chart for price action (they are for indicators).

Pay attention to the upward trending channel – you can enter long and sell in between the channel yellow lines as it trends. If price stays below the resistance then you trade the channel under that and if above a major support line same thing (yellow lines).

Price is currently trading above a horizontal support at 51.93 (yellow line) – watch this for support. Resistance is at 54.39. Review charts over the previous week on my blog to see yellow support and resistance lines and channel that I refer to.

Refer to my previous post re: Green arrows on chart are highest probability trade entries for short or long positions – while crude is trading in upward channel (like it is) your probability is always higher going long until channel broken. Trading at outside of channel increases probability of success also.

Diagonal Trend Lines:

Diagonal trend-lines (blue). Diagonal trend-lines are critical inflection points. Please review many of my recent posts so you can learn about how important these diagonal trend-lines are. If one is breached you can look to pull-back to next diagonal blue trend line about 90% of the time. Also pay attention to how thick the lines are – the thicker the line the more important because they represent extensions from previous time / price cycles.

Remember you can come in to the chat room to message the trader and REMEMBER I have posted a live chart link earlier in this post so if you can’t see the lines well on this chart above you can go to the live chart link and watch for member live algo chart links through-out the day in your email inbox!

There are two (at least at time of writing) diagonal trend – lines right under where crude is trading and one right at where crude is trading intra.

Price Action with 20, 50, 100, 200 MA

It is wise to study how the 20, 50, 100, 200 MA trade on each time-frame before trading oil related instruments. Below are a few examples.

Below is how oil has been trading with 20 MA on the 4 hour chart – fairly predictable buy / sell triggers. It is preferable to sell at the top of the move if you can time it and not wait for the 20 MA to trigger to downside. While crude is trading under 20 MA advantage is to short side and over advantage to long side. Keep in mind while trade remains in upward trending channel like it is now short side probability is lower than it would be otherwise.

Crude trading just above 20 MA on 4 Hour. Crude algo intra work sheet 500 AM Dec 27 FX $USOIL $WTIC #OIL $CL_F CL $USO $UCO $SCO $UWT $DWT #OOTT

Crude oil, $USOIL, 4 Hour, 20 MA
Crude trading just above 20 MA on 4 Hour. Crude algo intra work sheet 500 AM Dec 27 FX $USOIL $WTIC #OIL $CL_F CL $USO $UCO $SCO $UWT $DWT #OOTT

Crude trading just above 20 MA on 1 Hour. Crude algo intra work sheet 457 AM Dec 27 FX $USOIL $WTIC #OIL $CL_F CL $USO $UCO $SCO $UWT $DWT #OOTT

Crude oil, 20 MA, 1 Hour
Crude trading just above 20 MA on 1 Hour. Crude algo intra work sheet 457 AM Dec 27 FX $USOIL $WTIC #OIL $CL_F CL $USO $UCO $SCO $UWT $DWT #OOTT

The 200 MA on the 1 day provides predictable entry and exit and good trend change indication (until it doesn’t). A review of historical time frames proves that you will want for price to come up through the 200 MA from the downside. There are some examples of failure over last number of years also.

200 MA on 1 Day. Crude algo intra work sheet 624 AM Dec 23 FX $USOIL $WTIC #OIL $CL_F CL $USO $UCO $SCO $UWT $DWT #OOTT

200 MA, 1 Day Chart, $USOIL, $WTI, OIL
200 MA on 1 Day. Crude algo intra work sheet 624 AM Dec 23 FX $USOIL $WTIC #OIL $CL_F CL $USO $UCO $SCO $UWT $DWT #OOTT

Fibonacci Levels:

Watch these lines for support and resistance. Careful using them as traditional retracement levels with crude because the algo lines etc are more dominant / predictable. But the Fib lines are excellent indicators for intra-day trade support and resistance.

There are fib levels on the chart below – but they may just confuse you more than anything. We are currently running calculations with our modeling on how fib levels relate to our targets and trade levels – so the chart below is more mad science than anything because this is simply a live shot of work we are in the middle of – and we understand the levels can be difficult to make out.

When you get a feel for how the fib levels reflect intra trading (which we cannot explain in short here) you will always have them on your chart in a similar manner.

Fibonacci Levels. Crude algo intra work sheet 514 AM Dec 27 FX $USOIL $WTIC #OIL $CL_F CL $USO $UCO $SCO $UWT $DWT #OOTT

$USOIL, Chart, Fibonacci
Fibonacci Levels. Crude algo intra work sheet 514 AM Dec 27 FX $USOIL $WTIC #OIL $CL_F CL $USO $UCO $SCO $UWT $DWT #OOTT

Horizontal Trend-Lines (purple):

Horizontal trend-lines are not as important as the other indicators reviewed above, however, they do serve as important resistance and support intra-day for tight trading and they are important if thick (in other words they come from previous time / price cycles). WE STARTED TO REPRESENT THE REALLY IMPORTANT LINES IN YELLOW FYI FOR EASE. Refer to chart for current applicable horizontal trend-lines.

Advanced Charting:

Respect support and resistance lines: If you can be patient and take your long and short positions against these yellow lines – that is your highest probability trading.

You will see a lot of noise on the charts over the next few weeks (algorithmic calculations of various types). Try and ignore for now.

Oil Time / Price Cycles:

Time / price cycles are the single most important indicator and my record calling them is near 100% – since inception seven months ago. The reason they are so important is that a trader does not want to be holding a crude oil instrument at termination of a time cycle if not absolutely sure if price will go up or down. A trade may choose to enter a large position in advance of a time price cycle termination IF THERE IS A HIGH PROBABILITY OF A DIRECTION IN PRICE and if the market is trading at a really important pivot area. In other words, if the market is trading at the bottom of the upward trending channel at a support (yellow lines) and we knew there was a significant probability of a time cycle about to terminate a trader may enter with a long position. The price really spikes or drops significantly when these important time cycles terminate.

The problem with time / price cycle terminations is they change from minute to minute (depending on where price is on the chart) so you have to be in the trade room to get the alert. Our lead traders will do everything they can in future to send these on SMS but we have to be careful because it can be difficult with so much going on in the room. The reason they (time cycles) change is because they are actually represented by or are geometric shapes in the chart – I know it sounds odd but I have (as I mentioned) hit these calls just shy of 100%. The oil political people know the same algorithmic modeling principles and they ALWAYS TIME THEIR BIG ANNOUNCEMENTS AROUND THE TIME PRICE CYCLE TERMINATIONS.

So if you can picture a triangle on the chart – and price is trading in the triangle – and price is going to come to the edge of the triangle and there is a significant support or resistance or an algo line terminating there too or a target (those type of things)… then we know there is a high probability of a time and price change. In other words, it is where there are clusters of algorithm points that cross and when price is going to cross over that cluster is where they are. And these are represented on all the different time frames – the larger the time frame – the larger the time price cycle termination – the larger the spike or downdraft. This is where we establish our intra-day quadrants from for sniping trades (which we will put in to the room soon because it looks like the geo political rhetoric is over for a while making them more predictable). Difficult to explain in short. So we will do our best to SMS alert these in future.

Also, the real large or important time / price cycle terminations we know far in advance and they can be put in these newsletters.

If you review my Epic the Oil Algo Twitter feed, my blog posts and my story on our website you will get a feel for how accurate these calls are.

Per the last few reports we reference a few time cycles and yes as usual crude moved aggressively out of those cycles as we thought.

Time price cycle terminations. Crude algo intra work sheet 527 AM Dec 27 FX $USOIL $WTIC #OIL $CL_F CL $USO $UCO $SCO $UWT $DWT #OOTT

There are many time price cycle terminations on every chart, it depends where price is trading with time to determine if there is a possible termination at hand. Below I have noted four prominent ones coming and terminating at approximately on or before Tues at 4:30 PM, Wed 5:15 AM, Fri 4:30 AM June 2 4:45 PM BUT IT DEPENDS ON WHAT PRICE CRUDE IS TRADING AT. So if you are in a trade and you want a lead trader to review what time / price cycle terminations apply to intra day levels let them know in the trading room or send an email over and they will respond for you. Over time, you will learn what to look for. There are no REAL SIGNIFICANT time price cycle terminations on this chart – all are moderate to weak.

Time, Price, $USOIL
Time price cycle terminations. Crude algo intra work sheet 527 AM Dec 27 FX $USOIL $WTIC #OIL $CL_F CL $USO $UCO $SCO $UWT $DWT #OOTT

Alpha Algo Trading Trend-Lines (Red dotted lines):

There is a new alpha algo line on this chart and new algo targets for Tues, Wed and Friday this week.

To determine which algo line is most alpha (or probable) intra day, it is the nearest line to price action. This can also help you determine the trend of trade. If the algo line is trending up the price will follow it up until price is tested at an algorithm indicator (the main tests are diagonal trendlines, horizontal trendlines, time / price cycles etc – as I have shared with you). This is why it is important to watch all the lines because they are all support and resistance. To keep it simple trade the range (yellow lines) as I’ve mentioned but keep an eye on these indicators.

The alpha algo trend lines are on the chart above (red dotted diagonals) – there is one far below price, two above and one right where price is trading – the one nearest price is proving to be significant.

Current Alpha Algo Targets (Red circles):

Due to multiple requests we will start publishing our targets weekly not only on the charts (with circles and algo lines) but also as numeric listed targets with associated probabilities for each target on each day again (we recently stopped doing this but a number of traders have requested we do this again so we will start again next week). You can see how I used to do this on my Twitter feed.

So what is your most probable algo target for Tuesday 4:40 PM EST? Your closest target that crude is trending toward is always the most probable. Crude is currently trending toward a target (red circles on chart) Then, your second most probable is the one that is up or down trend depending on whether general price is in an upward or downtrend for the most recent week or so and what your other indicators look like (such as the MA’s I explained above).

This week alpha algo targets are as follows (with associated ht probability):

Tuesday 4:30 PM EST – 50.74 (7%), 53.34 (56%), 54.56 (24%)

Wednesday 10:30 AM EST – 50.87 (6%), 53.53 (53%), 54.76 (21%)

Friday 1:00 PM EST – 51.23 (5%), 54.06 (47%), 55.78 (17%)

Friday’s algo targets have not been near as predictable as Tues and Wed (shy of 80% now vs 90%+) and this Friday looks no different so be cautious with this Friday’s targets!

The other way to determine which targets are in play is actually quite simple, you will notice that crude trades between the channel lines up and down and up and down and there are various support and resistance along the way. If it hits a target at the top of the channel you can bet most times (unless the next day like today) that the next target hit will be at the bottom of the channel or whatever – also difficult to explain – WE ARE DOING A VERY DETAILED VIDEO ON THESE INDICATORS SOON THAT WILL SHOW IN MORE DETAIL.

The targets for this week are represented on the chart above. Again, refer to the live charting I send you for this also or be in the trading room.

Wait for the price to trend toward a target and take your position and watch as price gets closer and closer to the target. Remember, that the machines trade from decision to decision – or in other words from support to next resistance or resistance to next support or when the times come each week on Tuesday Wednesday and Friday they will trend toward the target that market price action determines they go to.

Our lead trader will explain more in the room and do not hesitate to ask our lead trader in the room by private message or on twitter to explain intra day decisions.

$USOIL, Chart
Crude algo intra work sheet 605 AM Dec 27 FX $USOIL $WTIC #OIL $CL_F CL $USO $UCO $SCO $UWT $DWT #OOTT

Oil Intra-Day Algo Trading Quadrants:

Processing now for release soon (you are seeing the beginning of them above in charts now) – I don’t think there are any real tight crude related snipers beyond our lead trader right now anyway – but nonetheless, we are getting these out – they take a lot of data processing to say the least. We’re almost there.

Indicator Methods:

As explained above, my algorithm is a consideration of up to fifty traditional indicators at any one time – each one given its own weight in accordance to its accuracy (win rate). This is how we establish the probability of specific targets hitting (we call them alpha algo targets).

Alpha Algo Targets, Algo Trend-lines, Algo Timing, Quadrants for Intra Snipes:

Algo targets are the red circles – they correspond with important times each week in oil reporting land. Tuesday 4:30 PM, Wednesday 10:30 AM and Friday at 1:00 PM. The red dotted diagonal lines are the algo trend-lines. And the vertical dotted (red or green) are marking the important times each week. You will find that the price of crude will hit one of the alpha algo targets about 90% of the time. In the absence of market direction the machines take price to the next algo line and/or target. Understanding how the price of crude reacts to the algos and how they move price from target to target is critical for intra-day and swing trading crude oil and associated instruments.

You will notice that price action of crude will use these algo trend-lines and act as support and resistance, and that price also often violently moves when an alpha algo line is breached either upward or downward.

We cover this in much more detail in the member updates, trading room. A review of my Twitter feed and previous blog posts will help you understand the relation of these indicators. We will start posting video blogs (for my subscribers) on YouTube (in addition to my daily blog posts) for swing traders that work during regular trading hours.

Also… we will cover how to establish algo trend-lines and price targets future forward (as you have seen me do on my Twitter feed for some time now).

Conclusion:

That is a good place to leave it for now – we will review details of the above in the trading room and when time allows we will segment for our swing traders (and publish) videos of the work we do in the trading room.

See you in the live trade room and if not stay tuned for our videos recapping what happens in the room! And again, if you struggle to know how to use these indicators as a trader’s edge, it is recommended (if you have earnestly reviewed all of our documentation first) that you obtain private coaching prior to trading a real account with real money – we recommend you use a paper trading account at first. And finally, we will be publishing a “how to use guide” soon, but it will be simply be a recap (consolidation) of instructions in this post, from my Twitter feed, and previously published information on our blog and website. You can also send specific questions to our email inbox at [email protected] – if you do this be sure to ask a specific question so it can be answered specifically. When the 24 hour oil trading room opens you will have ample opportunity in that 24 hour room to ask questions also.

Watch my EPIC the Oil Algo Twitter feed for intra day notices and your email in box for member only material intra day also.

EPIC the Oil Algo

PS If you are not yet reviewing the daily post market trading results blog posts, please do so, they are on the blog daily and often there is information that also may assist your trading. Trade room transcripts (for example) may review topics pertinent to your trading.

https://twitter.com/EPICtheAlgo/status/811327478845218816

 
Article topics: EPIC the Oil Algo, Crude Oil FX: $USOIL $WTI, $USO, $UCO, $CL_F, $UWT, $DWT, $ERX, $ERY, $GUSH, $DRIP, Chart, Algorithm, Indicators, Trading Room, Fibonacci, Algo, Targets
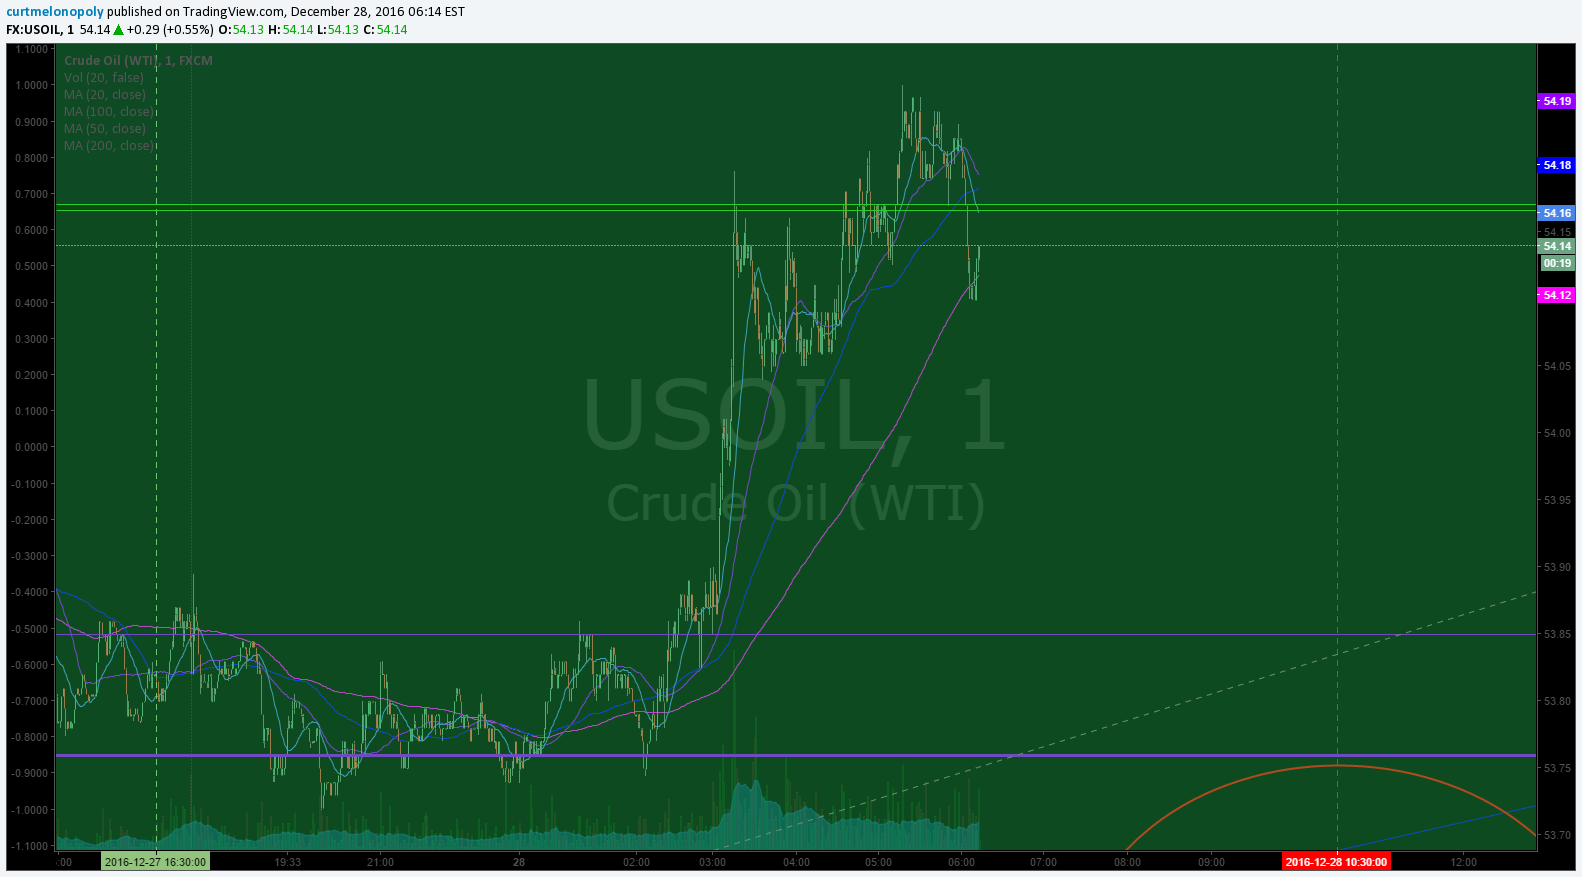
Read More
PreMarket Newsletter Fri Dec 23  $DPRX $URRE $UEC $GSAT $SGYP $DUST $DWT $USOIL $WTIC $UWT $SPY $GLD $GDX $SLV…

PreMarket Newsletter Fri Dec 23 $DPRX $URRE $UEC $GSAT $SGYP $DUST $DWT $USOIL $WTIC $UWT $SPY $GLD $GDX $SLV…

December 23, 2016December 26, 2016 Curt MelonopolyTrading Plan$CBMX, $DPRX, $DUST, $JUNO, $UEC, $URRE, $USOIL $WTI, $UWT, Chatroom, Day-trading, Gold, Pre-Market, Silver, Small Cap Oil, SPY, Stockmarket, Stocks, Trading Plan, USD/JPY, VIX, Wall Street, Watchlist

My Stock Trading Plan for Friday Dec 23, 2016 in Trading Chat room.  $DPRX, $URRE, $UEC, $GSAT, $SGYP, $DWT $UWT, $USOIL, $WTI, $GOLD, $GLD, $GDX, $USD/JPY, $SPY, $SILVER, $SLV, $SI_F, $VIX, $UVXY $TVIX $NG_F… more.

Welcome to the morning Wall Street trading day session!

Merry Christmas everyone! May you have a very happy holiday with your family.

Important Notices:

REVIEW: If you are not reviewing the post market trade reports along with this please do so. We assume our trading room subscribers do review it everyday and as such there will often be information in that report that is applicable to and not included in this premarket report. You will find the post market reports on our blog daily before this one is published.

REPORTING STATUS: Another quickie guys and gals!

Current Holds:

$CBMX, $JUNO, $DUST

Market Outlook:

I AM STALKING VOLATILITY, COPPER LONG AND OIL LONG AT SUPPORT. SOON GOLD and miners and maybe bio.

As mentioned previous, all algos (Oil, SPY, Gold, Silver, Dollar, VIX) have hit their targets now (long term since July and short term) so we are running calculation targets for all six algos for all time charting time-frames and expect these reports to start rolling out VERY SOON.

Morning Momo / News Bits:

Momentum stocks: $DPRX $URRE $UEC $GSAT $SGYP – $URRE up 53% on 80K volume premarket 7:47 AM.

S&P -0.09%.

10-yr +0.08%.

Euro +0.12% vs. dollar.

Crude -0.96% to $52.44.

Gold +0.16% to $1,132.55.

Small Bio M&A on watch. Today $DPRX gap. $OPHT $DNAI $DVAX $IPCI $TKAI

Futures quiet in pre-holiday trade.

EnteroMedics to reverse split shares 1:70 December 28 #premarket $ETRM

If you are new to our trading service you should review recent blog posts and at minimum of our algorithm Twitter feeds because they do tell a story in terms of the market and how the inflections of the market determine our day to day trading. And you will notice quickly that the algos have been undeniably accurate on many time-frames (intra-day and months out) so I myself have learned to respect their math (they have taken me from a 60% hit rate to 80% in my trading – all publicly posted live trades). A quick hour of review at most will bring you up to date.

The algorithm Twitter feeds can be found here: $WTI (@EPICtheAlgo), $VIX (@VexatiousVIX), $SPY (@FREEDOMtheAlgo), $GLD (@ROSIEtheAlgo), $SLV (@SuperNovaAlgo), $DXY (@DXYUSD_Index). Our lead trader Twitter feed is here @curtmelonopoly, lead developer @hundalSHS, and newest trader @quadzilla_jr.

Momentum Stocks (Market Open and Intra-Day):

I do trade morning momo stocks (at times), but I do avoid risk – so often I avoid the first 30 minutes (gap and go) and trade momentum stocks later in the day after the wash-out looking for a snap-back. Just prior to open and shortly after open I post momentum stocks to the trade chat room (and Twitter ans Stocktwits if I have time).

Some of my Favorite Set-Ups:

(1) Momentum Stock Wash-Outs for Snap Back, (2) Bad News Wash-outs on Stocks with High Institutional Ownership, (3) Getting on the Right Side of a Trend Change and scaling in my position and (4) Our Algorithm Set-Ups.

The momentum stocks (from previous days and morning trade) I continue to watch through the day for indicators that allow a trade.

Morning Stock Watch-Lists for my Favorite Set-Ups:

(1) Pre-Market Gainers Watch-List: Gainers: $DPRX $URRE $UEC $GSAT $SGYP $GOGL $NUGT, $FCAU $ERIC $EWZ $UGAZ $RACE $SCO $DB $UVXY I will update before market open or refer to chat room notices.

(2) Pre-market Decliners Watch-List: I will update before market open or refer to chat room notices.

(3) Other Watch-List: $AGIO (recent wash-out), $SGY (recent swing), $CBMX (current swing), $JUNO (current swing), $ANF (previous wash-out on news), $SKLN (previous wash-out on news), $URBN (previous wash-out on news).

(4) Regular Algo Charting Watch-List: Gold $GC_F $GLD, Miners $GDX ($NUGT, $DUST, $JDST, $JNUG), Silver $SLV $SI_F ($USLV, $DSLV), Crude Oil FX: $USOIL $WTI ($UWTI, $DWTI, $USO, $UCO, $CL_F, $UWT, $DWT), Natural Gas $NG_F ($UGAZ, $DGAZ), S & P 500 $SPY $ES_F ($SPXL, $SPXS), US Dollar Index $DXY ($UUP), Volatility $VIX ($TVIX, $UVXY, $XIV)

(5) Upgrades: I will update before market open of refer to chat room notices.

(6) Downgrades: I will update before market open or refer to chat room notices.

Stay tuned in Stock Chat Room for more pre-market stocks on watch.

Regular Trades:

S & P 500: $SPY $ES_F ($SPXL, $SPXS)

NA – Getting some action though.

As I wrote last week:

I wrote about resistance the algo alerted at 277.80. This is still in play FYI. However, the Fed will determine now naturally whether we trend up or down from where we are. My bias is up until new year BUT I WOULD BE READY because money could get caught offside. Who knows?

As pre previous and our algorithm call before election…. My bias is still to new highs but I am looking at a pull-back Christmas / Early 2017.

As above in my intro and previous, the chart ain’t broke till its broke. When its broke we’ll let you know.

My Trading Plan: Right now I am trading $XIV instead of $SPXL or $SPXS. I do this because we are in a trend of crushed volatility. Now, when that changes and volatility starts to rise again (even if $SPY is rising at the same time) then I’ll flip over to trading $SPXL and $SPXS instead of $XIV.

Volatility: $VIX ($TVIX, $UVXY, $XIV)

NA

Outlook:

As I wrote this and last week:

Looking for possible record lows before Christmas.

As above, I am thinking opportunity comes between Christmas and Trump, and by the way, when $VIX spikes the easiest play is short short short. FYI.

CNN Fear and Greed Index: http://money.cnn.com/data/fear-and-greed/

My Trading Plan for Volatility: I will likely follow that trend with $TVIX $UVXY $XIV buys at range pivots / pending price action, volume and other geo events. SHORT $VIX SPIKES!

Currencies and Other Global Markets: $DXY US Dollar Index ($UUP US Dollar Bull, $UDN British Pound, $USD/JPY, $FXY Japanese Yen Trust, $CNY China, $TZA, $SMK / $EWW Mexico Capped ETF)

NA

Per previous:

USDJPY is getting close to symmetry on the chart from the last run up about two years ago – charting on deck in coming reports!!!

Per previous:

BE VERY CAREFUL LISTENING TO THE $USD/JPY bears – they have been feeding misery to followers for many weeks – the chart is not broke – price is currently at support and there could easily be another leg up – nobody knows but the trend is your friend!

THIS IS STILL SUPER BULLISH!!!

My Trading Plan for Currencies / Global Markets: Waiting, waiting, waiting. $USDJPY CHART IS NOT BROKEN! IT IS A BULL UNTIL IT IS NOT…

Gold: $GLD ($UGLD, $DGLD). Miners: $GDX ($NUGT, $DUST, $JDST, $JNUG)

NA 

Per recent posts:

Rosie the Gold Algo target call HIT!

My Trading Plan for Gold: Short term there could be a pretty good pop around the Fed, but I don’t expect it would last. It could pop to the top of the algo quadrant but I don’t think it would run past – NOT YET ANYWAY. So who know’s I may play a short term scenario – Fed / market reaction dependent.

I am waiting for the trend reversal. We are very close to the price target at the bottom of that quadrant at 1133.00 ish. The initial wide frame target Rosie the algo nailed but there has been a wait and see for a reversal because of one more possible leg down. Getting very close IMO.

I haven’t started to take trades yet because I am waiting for “price – trigger – trade” set-ups. I will start chewing around the edges of stocks like $NUGT and $GLD likely. The idea is to get on the right side of the trade and trend.

WE SHOULD BE ALMOST THERE! GET READY! LIKELY BETWEEN CHRISTMAS AND TRUMP POWER TRANSFER! CHARTS COMING!

Other equities I like for Gold Trade: $AUMN (penny stock). When the trend reversal confirms I will post all the Gold equity picks here.

Silver $SI_F: $SLV ($USLV, $DSLV)

NA

Per previous;

Yesterday Silver tanked real hard! Good thing we’ve been sitting on our hands awaiting inflection point here.

Same as Gold – we’re waiting for a decision from market so we can get algo targets.

My Plan for Trading Silver: same

Same as Gold, I’m waiting for the “price – trigger – trade” set-ups… I am going to start chewing around the edges of stocks when set-up confirms like $USLV and $SLV attempting to get on right side of trend trade.

Other equities I like for Silver trade: $AUMN (penny stock). Same here, when trend reversal occurs I will post equity picks here.

Crude Oil FX : $USOIL $WTI ($UWTI, $DWTI, $GUSH, $ERX, $DRIP, $ERY, $USO, $UCO, $SCO, $UWT, $DWT, $CL_F)

Outlook:

Per Previous:

Last week Tuesday algo target at 4:30 hit and Wednesday 10:30 AM both targets hit to the cent and second and Friday Algo target was a near miss and this week Tuesday 4:30 hit and Wednesday just in to target but not a perfect hit (very tradeable though). Friday targets on charting BUT BE CAUTIOUS WITH FRIDAY TARGETS.

Trading Plan: WE ARE RIGHT NEAR SUPPORT AT TIME OF WRITING! 51.93 is the support test and I will take a long position there and see if we get the turn. 

Other Equities I like for Oil or Energy Trade: Tape / Chart – $ETE, $RIG. High Short Interest – $CRC, $EPE, $WLL, $RES, $JONE, $AREX, $REN, $CLR, $HP, $ATW, $SGY. Fundamentals: $EOG, Pipelines – $XLE: $HEP, $SXE, $KMI, $DPM, $TGS, $ENB, $EEP, $PTRC, $HGT

Natural Gas $NG_F $NATGAS ($UGAZ, $DGAZ):

NA

Per last week:

Hit resistance as I thought and alerted.

Natural Gas hit heavy resistance, came off, now at a Fibonacci support. $NG_F $UGAZ $DGAZ

ON WATCH!!! This could get a considerable pop in to late Wednesday and even as far as in to late Monday next week is possible!!!

Natural gas lost that Fib support yesterday so now I am watching lower supports. I still think there is a possibility for a pop just after Fed speak!

ON CLOSE WATCH!

Study:

Now that a number of blog posts are being unlocked, it wouldn’t be a bad idea for traders to review them (especially new traders).

If you are trading relying on our charting or algorithms as trade indicators you should read this recent article,

Free scanners to find momentum stocks that you can easily review charts of for indicators that bring probability of your trade being successful up considerably. These are not useful for first 30 minute market open gap and go type plays (you need a good momentum scanner, level 2, and best to have hot-keys for the first 30 mins of gap and go trading)… but are very useful for intra day scalping (start with trending stocks and then look at indicators intra for simple set-ups – study scan study scan study scan).

http://finviz.com/

https://finance.yahoo.com/screener/predefined/ec5bebb9-b7b2-4474-9e5c-3e258b61cbe6

http://www.highshortinterest.com/

http://www.gurufocus.com/short-stocks.php

http://www.3xetf.com/all/

http://www.etf.com/channels/gold-etfs

GL!

Curtis

Article Topics: $DPRX, $URRE, $UEC, Stockmarket, Pre-Market, Trading Plan, Wall Street, Stocks, Day-trading, Watchlist, Chatroom, Small Cap Oil, $CBMX, $JUNO, $DUST, $UWT, $GOLD, $SILVER, $USD/JPY, $USOIL $WTI, $VIX, $SPY, $NATGAS, $DWT, $SLV, $GLD, $DXY

Read More
Member Oil Trade Update Fri Dec 23 Charting Algo FX: $USOIL $WTIC – $USO $CL_F $UWT $DWT $UCO $SCO $ERX $ERY $GUSH $DRIP

Member Oil Trade Update Fri Dec 23 Charting Algo FX: $USOIL $WTIC – $USO $CL_F $UWT $DWT $UCO $SCO $ERX $ERY $GUSH $DRIP

December 23, 2016January 2, 2017 Epic the AlgoCrude Oil Trading Algorithm (EPIC)$CL_F, $DRIP, $ERX, $ERY, $GUSH, $UCO, $USO, $UWT, Algo, Algorithm, Chart, Crude Oil FX: $USOIL $WTI, DWT, EPIC the Oil Algo, Fibonacci, Indicators, Targets, Trading Edge, Trading Room

Friday Dec 23, 2016 EPIC the Oil Algo Oil Report (Member Edition). FX: $USOIL $WTIC – $USO $CL_F $UWT $DWT $UCO $SCO $ERX $ERY $GUSH $DRIP

Welcome to my new FX: $USOIL $WTI oil trade report. My name is EPIC the Oil Algo.

NOTICES:

TRADE: Crude is trading at 52.56 which is very close to a major support (at 5:47 EST). We have traders looking at possible long positions at 51.95 area and crude $USOIL.

CHARTING: Charts will be cluttered for the next number of days with technicians processing multiple calculations for 2017 algorithmic models.  

ALERTS: We are having a technical coding issue with SMS text / email alert launch – will be resolved soon! For now we are emailing alerts as time allows.

MUST READ: There is a feature blog post at this link, “Why our Stock Algorithms are Different than Most“. If you are viewing our algorithmic model charting it is a must read.

MULTI-USERS: Institutional / commercial platform now available.

PATENT PHASE: I am now in patent application phase. Stay tuned for agreements concerning disclosure and use coming to members.

24 HOUR TRADE ROOM: My charting transitions from FX $USOIL $WTI to 24hr crude oil futures early 2017. My sub service w incl 24 hr crude oil trade room.

ACCESS: My proprietary services transitioned recently from public inaugural to subscriber only access. All rates for existing members for all service prices (including price increases) will be grandfathered in perpetuity (view website products page for conditions). Early 2017 when my 24 hour futures trading room opens along with 24 hour live charting I will have a rate increase but as with recent the roll-over existing members will be grandfathered at locked-in current rates.

SOFTWARE: My algorithmic charting is going to developer coding phase early 2017 for our trader’s dashboard program. Please review my algorithm development process and about my oil algorithm story on our website www.compoundtrading.com and my oil algo charting posts on my Twitter feed and this blog.

HOW MY ALGORITHM WORKS: I am an algorithm in development. My math is based on traditional indicators (up to fifty at any given time each weighted on win ratio merit – all not shown on chart at any given time) – such as simple math calculations relating to price and volume, Fibonacci, simple pivots, moving averages, Gann, Schiff and various other charting, geometric and mathematical factors. I do not yet have AI or Geo Political integration – only math as it relates to traditional indicators with the primary goal being probabilities. I am not a high frequency or bot type algorithm – I am represented on and used on a traditional trading chart as one would normally use as a probability indicator. The goal is to provide our trader’s with an edge when triggering entries and exits on trades with instruments that rely on the price of crude oil (specifically FX: $USOIL $WTI and transitioning to futures in the new year in our new 24 hour oil trading room).

Below you will find my simplified view of levels that can be used on a traditional chart (both intra-day and as a swing trader or investor). This work, and subsequent trading, should be considered one decision at a time, “if this happens then this or this are my targets”… price – trigger – trade and so on. Questions to; [email protected], message our lead trader on Twitter, or message a lead trader privately in the trade room.

EVERY CALL WE MAKE, EVERY PUBLIC INTERACTION, REPRESENTATION OF TRADE (ON EVERY VENUE) IS VIDEO RECORDED (TRADING ROOM), ON SOCIAL MEDIA OR ON BLOG / WEBSITE TIME-STAMPED FOR PERMANENT RECORD AND ABSOLUTE TRANSPARENCY. PLEASE ALSO REFER TO OUR PUBLIC DISCLOSURE https://compoundtrading.com/disclosure-disclaimer/.

FX: $USOIL $WTI Observations:

Below is the link for the live EPIC the Oil Algo Live Trading Chart for Friday Dec 23, 2016.

https://www.tradingview.com/chart/USOIL/ZqkVYdUL-EPIC-THE-OIL-ALGO-MEMBER-CHART/

Intra-day Crude Oil Trading Range: At time of writing FX $USOIL $WTI is trading at 52.58 5:51 AM ET Dec 23, 2016. Some thoughts with respect to traditional charting that may help advance the trading edge:

Trading 52.58 Crude algo intra work sheet 545 AM Dec 23 FX $USOIL $WTIC #OIL $CL_F CL $USO $UCO $SCO $UWT $DWT #OOTT

$USOIL, $WTI, Trading, Chart
Trading 52.58 Crude algo intra work sheet 545 AM Dec 23 FX $USOIL $WTIC #OIL $CL_F CL $USO $UCO $SCO $UWT $DWT #OOTT

Multi Week Trading Range for Swing Trading:

Note: Be careful with the prices you see in the purple boxes on the right of the chart – they do not line up on chart for price action (they are for indicators).

Pay attention to the upward trending channel – you can enter long and sell in between the channel yellow lines as it trends. If price stays below the resistance then you trade the channel under that and if above a major support line same thing (yellow lines).

Price is currently trading above a horizontal support at 51.93 (yellow line) – watch this for support. Resistance is at 54.39. Review charts over the previous week on my blog to see yellow support and resistance lines and channel that I refer to.

Green arrows on chart are highest probability trade entries for short or long positions – while crude is trading in upward channel (like it is) your probability is always higher going long until channel broken. Trading at outside of channel increases probability of success also.

Diagonal Trend Lines:

Diagonal trend-lines (blue). Diagonal trend-lines are critical inflection points. Please review many of my recent posts so you can learn about how important these diagonal trend-lines are. If one is breached you can look to pull-back to next diagonal blue trend line about 90% of the time. Also pay attention to how thick the lines are – the thicker the line the more important because they represent extensions from previous time / price cycles.

Remember you can come in to the chat room to message the trader and REMEMBER I have posted a live chart link earlier in this post so if you can’t see the lines well on this chart above you can go to the live chart link and watch for member live algo chart links through-out the day in your email inbox!

There are two (at least at time of writing) diagonal trend – lines right under where crude is trading.

Price Action with 20, 50, 100, 200 MA

It is wise to study how the 20, 50, 100, 200 MA trade on each time-frame before trading oil related instruments. Below are a few examples.

Below is how oil has been trading with 20 MA on the 4 hour chart – fairly predictable buy / sell triggers. It is preferable to sell at the top of the move if you can time it and not wait for the 20 MA to trigger to downside. While crude is trading under 20 MA advantage is to short side and over advantage to long side. Keep in mind while trade remains in upward trending channel like it is now short side probability is lower than it would be otherwise.

$USOL, 20 MA, 4 Hour
20 MA on 4 Hour. Crude algo

The 200 MA on the 1 day provides predictable entry and exit and good trend change indication (until it doesn’t). A review of historical time frames proves that you will want for price to come up through the 200 MA from the downside. There are some examples of failure over last number of years also.

200 MA on 1 Day. Crude algo intra work sheet 624 AM Dec 23 FX $USOIL $WTIC #OIL $CL_F CL $USO $UCO $SCO $UWT $DWT #OOTT

200 MA, 1 Day Chart, $USOIL, $WTI, OIL
200 MA on 1 Day. Crude algo intra work sheet 624 AM Dec 23 FX $USOIL $WTIC #OIL $CL_F CL $USO $UCO $SCO $UWT $DWT #OOTT

Fibonacci Levels:

Watch these lines for support and resistance. Careful using them as traditional retracement levels with crude because the algo lines etc are more dominant / predictable. But the Fib lines are excellent indicators for intra-day trade support and resistance.

There are fib levels on the chart below – but they will just confuse you more than anything. We are currently running calculations with our modeling on how fib levels relate to our targets and trade levels – so the chart below is more mad science right now than anything because this simply a live shot of work we are in the middle of.

Fibonacci levels for oil. Crude algo intra work sheet 644 AM Dec 23 FX $USOIL $WTIC #OIL $CL_F CL $USO $UCO $SCO $UWT $DWT #OOTT

$USOIL, Fibonacci, Chart
Fibonacci levels for oil. Crude algo intra work sheet 644 AM Dec 23 FX $USOIL $WTIC #OIL $CL_F CL $USO $UCO $SCO $UWT $DWT #OOTT

Horizontal Trend-Lines (purple):

Horizontal trend-lines are not as important as the other indicators reviewed above, however, they do serve as important resistance and support intra-day for tight trading and they are important if thick (in other words they come from previous time / price cycles). WE STARTED TO REPRESENT THE REALLY IMPORTANT LINES IN YELLOW FYI FOR EASE. Refer to chart for current applicable horizontal trend-lines.

Advanced Charting:

Respect support and resistance lines: If you can be patient and take your long and short positions against these yellow lines – that is your highest probability trading.

You will see a lot of noise on the charts over the next few weeks (algorithmic calculations of various types). Specific to the charts above they are littered with Fib levels and if you look close you wil see geometric shapes in white or grey lines. Try and ignore for now.

Oil Time / Price Cycles:

Time / price cycles are the single most important indicator and my record calling them is near 100% – since inception seven months ago. The reason they are so important is that a trader does not want to be holding a crude oil instrument at termination of a time cycle if not absolutely sure if price will go up or down. A trade may choose to enter a large position in advance of a time price cycle termination IF THERE IS A HIGH PROBABILITY OF A DIRECTION IN PRICE and if the market is trading at a really important pivot area. In other words, if the market is trading at the bottom of the upward trending channel at a support (yellow lines) and we knew there was a significant probability of a time cycle about to terminate a trader may enter with a long position. The price really spikes or drops significantly when these important time cycles terminate.

The problem with time / price cycle terminations is they change from minute to minute (depending on where price is on the chart) so you have to be in the trade room to get the alert. Our lead traders will do everything they can in future to send these on SMS but we have to be careful because it can be difficult with so much going on in the room. The reason they (time cycles) change is because they are actually represented by or are geometric shapes in the chart – I know it sounds odd but I have (as I mentioned) hit these calls just shy of 100%. The oil political people know the same algorithmic modeling principles and they ALWAYS TIME THEIR BIG ANNOUNCEMENTS AROUND THE TIME PRICE CYCLE TERMINATIONS.

So if you can picture a triangle on the chart – and price is trading in the triangle – and price is going to come to the edge of the triangle and there is a significant support or resistance or an algo line terminating there too or a target (those type of things)… then we know there is a high probability of a time and price change. In other words, it is where there are clusters of algorithm points that cross and when price is going to cross over that cluster is where they are. And these are represented on all the different time frames – the larger the time frame – the larger the time price cycle termination – the larger the spike or downdraft. This is where we establish our intra-day quadrants from for sniping trades (which we will put in to the room soon because it looks like the geo political rhetoric is over for a while making them more predictable). Difficult to explain in short. So we will do our best to SMS alert these in future.

Also, the real large or important time / price cycle terminations we know far in advance and they can be put in these newsletters.

If you review my Epic the Oil Algo Twitter feed, my blog posts and my story on our website you will get a feel for how accurate these calls are.

Per the last few reports we reference a few time cycles and yes as usual crude moved aggressively out of those cycles as we thought.

Alpha Algo Trading Trend-Lines (Red dotted lines):

To determine which algo line is most alpha (or probable) intra day, it is the nearest line to price action. This can also help you determine the trend of trade. If the algo line is trending up the price will follow it up until price is tested at an algorithm indicator (the main tests are diagonal trendlines, horizontal trendlines, time / price cycles etc – as I have shared with you). This is why it is important to watch all the lines because they are all support and resistance. To keep it simple trade the range (yellow lines) as I’ve mentioned but keep an eye on these indicators.

The alpha algo trend lines are on the chart above (red dotted diagonals) – there is one far below price and two above.

Current Alpha Algo Targets (Red circles):

Friday target in my opinion (upper or lower targets) are a low probability.

Next week targets will be published before market open Tuesday (Monday the market is closed).

Due to multiple requests we will start publishing our targets weekly not only on the charts (with circles and algo lines) but also as numeric listed targets with associated probabilities for each target on each day again (we recently stopped doing this but a number of traders have requested we do this again so we will start again next week). You can see how I used to do this on my Twitter feed.

So what is your most probable algo target for Friday 1:00 PM EST? Your closest target that crude is trending toward is always the most probable. Crude is currently trending toward a target (red circles on chart) Then, your second most probable is the one that is up or down trend depending on whether general price is in an upward or downtrend for the most recent week or so and what your other indicators look like (such as the MA’s I explained above).

Friday’s algo targets have not been near as predictable as Tues and Wed (shy of 80% now vs 90%+) and this Friday looks no different so be cautious with this Friday’s targets!

The other way to determine which targets are in play is actually quite simple, you will notice that crude trades between the channel lines up and down and up and down and there are various support and resistance along the way. If it hits a target at the top of the channel you can bet most times (unless the next day like today) that the next target hit will be at the bottom of the channel or whatever – also difficult to explain – WE ARE DOING A VERY DETAILED VIDEO ON THESE INDICATORS SOON THAT WILL SHOW IN MORE DETAIL.

The targets for this week are represented on the chart above. Again, refer to the live charting I send you for this also or be in the trading room.

Wait for the price to trend toward a target and take your position and watch as price gets closer and closer to the target. Remember, that the machines trade from decision to decision – or in other words from support to next resistance or resistance to next support or when the times come each week on Tuesday Wednesday and Friday they will trend toward the target that market price action determines they go to.

Our lead trader will explain more in the room and do not hesitate to ask our lead trader in the room by private message or on twitter to explain intra day decisions.

Oil Intra-Day Algo Trading Quadrants:

Processing now for release any moment (you are seeing the beginning of them above in charts now) – I don’t think there are any real tight crude related snipers beyond our lead trader right now anyway – but nonetheless, we are getting these out – they take a lot of data processing to say the least. We’re almost there.

Indicator Methods:

As explained above, my algorithm is a consideration of up to fifty traditional indicators at any one time – each one given its own weight in accordance to its accuracy (win rate). This is how we establish the probability of specific targets hitting (we call them alpha algo targets).

Alpha Algo Targets, Algo Trend-lines, Algo Timing, Quadrants for Intra Snipes:

Algo targets are the red circles – they correspond with important times each week in oil reporting land. Tuesday 4:30 PM, Wednesday 10:30 AM and Friday at 1:00 PM. The red dotted diagonal lines are the algo trend-lines. And the vertical dotted (red or green) are marking the important times each week. You will find that the price of crude will hit one of the alpha algo targets about 90% of the time. In the absence of market direction the machines take price to the next algo line and/or target. Understanding how the price of crude reacts to the algos and how they move price from target to target is critical for intra-day and swing trading crude oil and associated instruments.

You will notice that price action of crude will use these algo trend-lines and act as support and resistance, and that price also often violently moves when an alpha algo line is breached either upward or downward.

We cover this in much more detail in the member updates, trading room. A review of my Twitter feed and previous blog posts will help you understand the relation of these indicators. We will start posting video blogs (for my subscribers) on YouTube (in addition to my daily blog posts) for swing traders that work during regular trading hours.

Also… we will cover how to establish algo trend-lines and price targets future forward (as you have seen me do on my Twitter feed for some time now).

Conclusion:

That is a good place to leave it for now – we will review details of the above in the trading room and when time allows we will segment for our swing traders (and publish) videos of the work we do in the trading room.

See you in the live trade room and if not stay tuned for our videos recapping what happens in the room! And again, if you struggle to know how to use these indicators as a trader’s edge, it is recommended (if you have earnestly reviewed all of our documentation first) that you obtain private coaching prior to trading a real account with real money – we recommend you use a paper trading account at first. And finally, we will be publishing a “how to use guide” soon, but it will be simply be a recap (consolidation) of instructions in this post, from my Twitter feed, and previously published information on our blog and website. You can also send specific questions to our email inbox at [email protected] – if you do this be sure to ask a specific question so it can be answered specifically. When the 24 hour oil trading room opens you will have ample opportunity in that 24 hour room to ask questions also.

Watch my EPIC the Oil Algo Twitter feed for intra day notices and your email in box for member only material intra day also.

EPIC the Oil Algo

PS If you are not yet reviewing the daily post market trading results blog posts, please do so, they are on the blog daily and often there is information that also may assist your trading. Trade room transcripts (for example) may review topics pertinent to your trading.

https://twitter.com/EPICtheAlgo/status/811327478845218816
Article topics: EPIC the Oil Algo, Crude Oil FX: $USOIL $WTI, $USO, $UCO, $CL_F, $UWT, $DWT, $ERX, $ERY, $GUSH, $DRIP, Chart, Algorithm, Indicators, Trading Room, Trading Edge, Fibonacci, Indicators, Algo, Targets
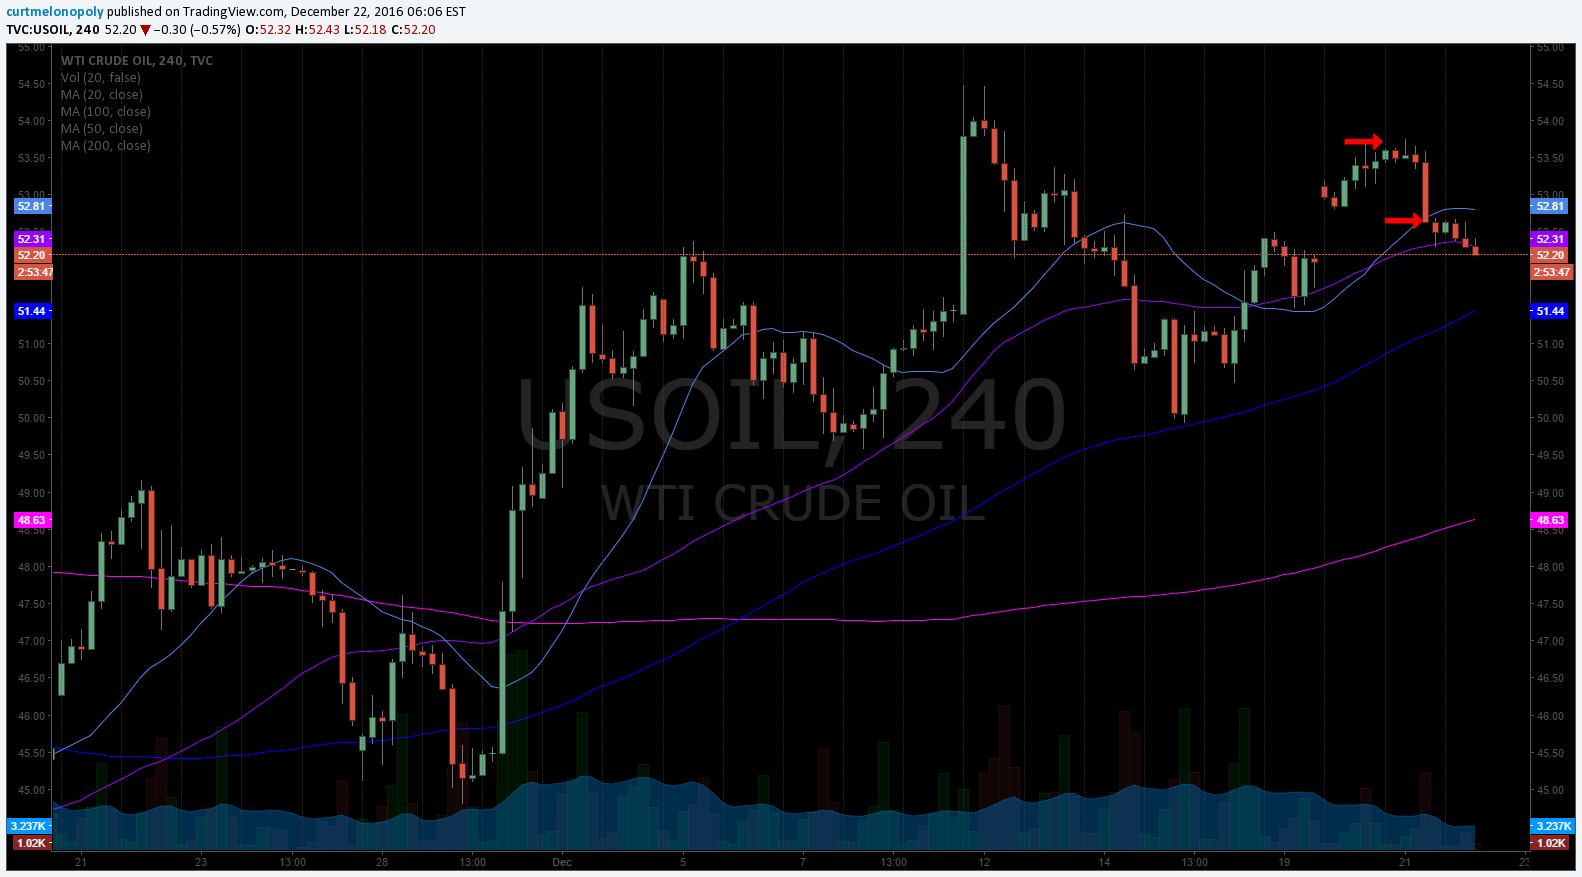
Read More

Post Market Report Thur Dec 22 $CMTX $UWT $DUST $JUNO $CBMX $GSAT $TKAI $GLD $GDX $USOIL $WTIC

December 23, 2016February 12, 2018 Curt MelonopolyPost Market Report (Trade Results)$CBMX, $CMTX, $DUST, $GDX, $GSAT, $JUNO, $TKAI, $USOIL, $UWT, Chat Room, Compound trading, Day-trading, GLD, Investing, Results, Stocks, Swing Trading, trading lessons, Trading Results, Wall Street

Review of my Chat Room Stock Day Trades, Algorithm Charting Calls and Alerts for Thursday Dec 22 – $CMTX, $UWT, $DUST, $JUNO, $CBMX, $GSAT, $TKAI, $SPY, $GLD, $GDX, $USDJPY, $DXY, $USOIL, $WTIC, $SLV, VIX, $NG_F and more.

Intro:

Time stamped entries (in permanent archive) copied to this blog in italics (below) are direct live log chat from chat trade room as they occurred (random chat from myself not applicable or other misc chat deleted). Chat trade room is also video recorded daily for trade archive.

In addition to chat, this trade-room has live voice broadcast (that covers in detail what indicators I am looking for in and out off each trade) and has live chart screen sharing right from my monitor to the room with all indicators I am looking at.

EVERY CALL WE MAKE, EVERY PUBLIC INTERACTION, REPRESENTATION OF TRADE (ON EVERY VENUE) IS VIDEO RECORDED (TRADING ROOM), ON SOCIAL MEDIA OR ON BLOG / WEBSITE TIME-STAMPED FOR PERMANENT RECORD AND ABSOLUTE TRANSPARENCY. PLEASE ALSO REFER TO OUR PUBLIC DISCLOSURE https://compoundtrading.com/disclosure-disclaimer/.

Notices:

Notice: There is a new feature blog post at this link, “Why our Stock Algorithms are Different than Most“. If you are using our algorithms or charting it is a must read.

Notice: We are testing fault settings for multiple trading rooms in 2017 (main room, momentum, options, swing, commodities, etc). We can have groups in different rooms all seeing same screen and announcements / broadcast – if you’re moved don’t sweat it – it won’t affect your experience.

Overview Perspective & Review of Chat Room, Algo Calls, Trades and Alerts:

Today was very calm. Some trades in the group. For me quiet with two small trades – study day mostly.

My Personal Trades:

Two small trades and wins – $CMTX was my morning momentum stock trade and $UWT later in day. Holding $CBMX, $JUNO, $DUST.

Looking Forward:

The market has a tonne of inflection points now so things should get interesting soon with our algos that you can find here:

The algorithm Twitter feeds can be found here: $WTI (@EPICtheAlgo), $VIX (@VexatiousVIX), $SPY (@FREEDOMtheAlgo), $GLD (@ROSIEtheAlgo), $SLV (@SuperNovaAlgo), $DXY (@DXYUSD_Index).


Announcements in Trading Room:


08:48 am Curtis M : Morning! Gainers: $TKAI $GSAT $XOMA $ANY $MU $RGSE $RENN $HTBX $DGAZ $TWLO $SCMP I will look at momo stock trades at open and our regular watches after.

Stock Chat-room Trading Transcript:

Miscellaneous chatter is removed.

9:02 am Curtis M : $FRED down 8% in premarket
09:05 am Curtis M : Watching $TKAI $GSAT $EYES $CETX $MU
09:26 am Mathew Waterfall : $TKAI hitter from early last month. Out this AM after buying in at .88. Nice surprise to wake up to
09:26 am Mathew Waterfall : Expecting a similar move from $DNAI sooner or later
09:28 am Mathew Waterfall : Also will be looking to exit $TWTR puts and $TWLO calls likely half of each as they are both into next week
09:29 am Mathew Waterfall : Morning guys!
09:32 am Mathew Waterfall : Out this week $TWTR 17 puts at .4 from .17
09:32 am Mathew Waterfall : Out half next week $TWLO 37 c’s at .6 from .38
09:36 am Mathew Waterfall : Out half next week $TWTR 16.5 puts at .38 from .3
09:36 am Mathew Waterfall : sorry from .2
09:44 am Curtis M : $CETX L 500 5.695 L 1000 5.79 Sold 5.801
09:45 am Cindy L : I’m still n $CETX from pre
09:46 am OILQ K : Long ACNV
09:47 am John M : $TWLO long at every dip
09:47 am Mathew Waterfall : $VXX outs for next week. 23’s at .14
09:47 am Mathew Waterfall : *pus
09:47 am Mathew Waterfall : jesus I can’t type this morning. You know what I mean. PUTS
09:47 am Sammy T : lol
09:47 am Jonny M : edit!
09:51 am Mathew Waterfall : I need to figure out how to make this typing text box bigger so I can review my posts easier
09:58 am Ma Ka : gm all
09:59 am Cindy L : $DNAI gonna go
10:00 am Mathew Waterfall : $RENN looks like it wants to squeeze
10:03 am Curtis M : Long $UWT 26.386 avg 1000
10:05 am OILQ K : LOng Some UWT TOO
10:06 am Mathew Waterfall : long $WATT 18.14 for a swing. Stop at 17.45\
10:06 am Cindy L : Im in small UWT
10:07 am Sammy T : $REN going to sq if oil goes
10:07 am Mathew Waterfall : $GPRO going. Still in my next week 10 lotto calls
10:07 am Mathew Waterfall : Also all out of $TWTR puts
10:13 am Mathew Waterfall : Following sweeper through for some $MU Jan 6 24c’s at .32. Looking for some post earnings continuation and the chart looks great
10:14 am Mathew Waterfall : Also out half of $GPRO next week 10 lotto’s at .09 from .04. @ bagger covering cost so rest will ride free
10:16 am Curtis M : nice man
10:19 am Michael P : School in session bang
10:20 am Mathew Waterfall : Sentiment mild, TICKs middling, VIX dropping. All addes up to a market that is just floating along IMO.
10:34 am Sammy T : In $PTIE
10:34 am Mathew Waterfall : $WATT monster move already. Great momo in this one
10:35 am Drew M : In some $SRNE looking gooood
10:36 am Drew M : $LABD strong
10:36 am Mathew Waterfall : $KNDI on the move. I’ve been stalking for a short squeeze. If it gets outside of the triangle and over .65 it’s a buy on my end
10:37 am MarketMaven M : $UGAZ down
10:38 am Sammy T : $BIG looks like $BIG move comin
10:39 am OILK K : $BBBY we called that!
10:40 am Curtis M : away for 3 mins
10:51 am Rob D : Curt would consider rebuy at one of those MA’s?
10:51 am Rob D : *you
10:52 am Curtis M : when it breaches aud white up
10:58 am Rob D : interesting how it stopped at quadrant line to the tick
11:06 am Mathew Waterfall : coffee and scanning time. Maybe a nap if nothing moves. Back in a bit
11:16 am Tyler H : Thaanks Curt – not much out there
11:18 am Sammy T : nap good idea – like how i have learned to bank monthly from ya curt! have a great holiday
11:19 am Curtis M : np guys and gals when u learn t you’ll do way better than me
11:20 am Curtis M : Sartaj! Please check video from start today to now for technical training on crude videos and maybe for your pres kit FYI
11:21 am Curtis M : Out $UWT 26.42 blah lol
11:22 am Adam G : Curt does the chart not look better with regard to contrast with a darker black background? I don’t find it very easy to view as is
11:23 am Cindy L : I just like how consistent it is. Pretty awesome. I hope this afternoon goes good with some momo.
11:23 am Adam G : Ohhhhh
11:23 am Adam G : my bad
11:25 am Adam G : will I be able to load to TradeStation?
11:25 am Adam G : ok
11:26 am Adam G : I already use two buddy 😉
11:31 am Cindy L : Early lunch for me back after lunch for aft sessoin
11:32 am Jack D : $SPY looks sick
11:34 am Mathew Waterfall : Going to trim some $WATT here at 18.95. Keeping half. It’s run a long way so I’ll take the easy gains
11:35 am Curtis M : $IWM test here IMO
11:47 am Mathew Waterfall : Out another slice of $WATT at 19.24
11:47 am Mathew Waterfall : Will let the rest ride on a trailer
11:48 am Adam G : 2250 breaches, 2247 should see responsive buyers. ES_F
11:49 am Adam G : Sorrry 2252
11:51 am Curtis M : 20 min lunch
11:51 am Mathew Waterfall : 10-4
11:52 am Mathew Waterfall : Anyone else seeing anything fun out there? Pretty quiet overall as we drift a bit lower on the day. Luckily I caught those overnight plays and $WATT because not much else is going on here
11:53 am MarketMaven M : BTFD haha
11:54 am Cindy L : crappy
11:57 am OILQ K : $TSLA I still like for new year swing – have not bit yet
11:58 am Drew M : Market going to crap its pants 🙂
12:00 pm Mathew Waterfall : Never say never but people are trying to get bearish on a .35% $SPY flush and VIX up just 3%
12:01 pm Mathew Waterfall : Nothing else looks bad enough to convince me we are going down in a hurry. Breadth is mild, TICKs fine, still seeing a ton of call flow
12:02 pm Cara R : Expecting action in $GPRO $WATT $ACAI this afternoon
12:03 pm Mathew Waterfall : $CCJ runner on Trump tweet
12:03 pm Mathew Waterfall : Tweeting about more nuke power
12:03 pm Jack D : Trump wow
12:09 pm Mathew Waterfall : Feels like we are trying to find a bottom here. Maybe it’s just the light flow but we couldn’t punch through last weeks low on $SPY
12:15 pm Rob D : speaking of nukes…..check out $URRE
12:18 pm Mathew Waterfall : Yea, not my kind of play but nice action in a few names there
12:20 pm Curtis M : Icahn interview on cnbc making me laugh
12:22 pm Curtis M : he’s like I just wanna give back

Transcript cut-off by provider (requested remaining and will post when they provide record to us).

Article Topics: $CMTX, $UWT, $DUST, $JUNO, $CBMX ,$GSAT, $TKAI ,Compound Trading, Trading Lessons, Results, Wall Street, Stocks, Stock Market, Day Trading, Swing Trading, Investing, Chat Room, Trading Results, $GLD, $GDX, $USOIL, $WTIC, $SPY, $DXY, $VIX, $NUGT, $DUST, $JNUG, $JDST, $GC_F, $USO, $UCO, $SCO, $CL_F, $DWT, S&P 500

Read More
Member Oil Trade Update Thur Dec 22 Charting Algo FX: $USOIL $WTIC ($USO $UCO $SCO $CL_F $UWT $DWT $ERX $ERY $GUSH $DRIP)

Member Oil Trade Update Thur Dec 22 Charting Algo FX: $USOIL $WTIC ($USO $UCO $SCO $CL_F $UWT $DWT $ERX $ERY $GUSH $DRIP)

December 22, 2016December 25, 2016 Epic the AlgoCrude Oil Trading Algorithm (EPIC)$CL_F, $DRIP, $ERX, $ERY, $GUSH, $UCO, $USO, $UWT, Algo, Algorithm, Chart, Crude Oil FX: $USOIL $WTI, DWT, EPIC the Oil Algo, Fibonacci, Indicators, Targets, Trading Edge, Trading Room

Thursday Dec 22, 2016 EPIC the Oil Algo Oil Report (Member Edition). FX: $USOIL $WTIC ($USO, $UCO, $SCO, $CL_F, CL, $UWT, $DWT, $ERX, $ERY, $GUSH, $DRIP)

Welcome to my new FX: $USOIL $WTI oil trade report. My name is EPIC the Oil Algo.

NOTICES:

Algo Targets / Questions etc: Yesterday we had some great questions in the trading room. Ask all you like anytime (it was unfortunate we were experiencing internet spikes for about an hour right around this time). Anyway, a few quick notes about follow-up questions we received. When we reference calls made – we at originally published targets for Tues, Wed, Fri ea week at the specific times with a few targets for each with probabilities. More recently we have stopped doing that because we want to respect our members subscriptions so we do not as readily share information with the general public and will less and less over time. So currently we have been sharing specifics either in these reports, live in the room or in other communications (email etc) with members. Either way, it is easy to establish primary targets – simply follow the algo lines (red dotted) to the next vertical time on Tues, Wed or Fri time cycles. I should say also that when the 24 hour oil trading room is open then we can share freely in the room very specific information about our work because there will be no public access and all attendants will be under disclosure covenant. So bottom line until 24 hour secure room is launched, if you have questions about probabilities or calls ask one of the lead traders.

Trade: Crude is getting really close to a major support (at 7:16 EST). We have a number of traders looking at possible long positions at 51.95 area and crude $USOIL at time of writing is trading at 52.19.

NEW: We are having a technical coding issue with SMS text / email alert launch – will be resolved soon! For now we are emailing alerts as time allows.

NEW: There is a feature blog post at this link, “Why our Stock Algorithms are Different than Most“. If you are viewing our algorithmic model charting it is a must read.

MULTI-USERS: Institutional / commercial platform now available.

PATENT PHASE: I am now in patent application phase. Stay tuned for agreements concerning disclosure and use coming to members.

24 HOUR TRADE ROOM: My charting transitions from FX $USOIL $WTI to 24hr crude oil futures early 2017. My sub service w incl 24 hr crude oil trade room.

PRICING: My proprietary services transitioned recently from public inaugural to subscriber only access. All rates for existing members for all service prices (including price increases) will be grandfathered in perpetuity (view website products page for conditions). Early 2017 when my 24 hour futures trading room opens along with 24 hour live charting I will have a rate increase but as with recent the roll-over existing members will be grandfathered at locked-in current rates.

SOFTWARE: My algorithmic charting is going to developer coding phase early 2017 for our trader’s dashboard program. Please review my algorithm development process and about my oil algorithm story on our website www.compoundtrading.com and my oil algo charting posts on my Twitter feed and this blog.

HOW MY ALGORITHM WORKS: I am an algorithm in development. My math is based on traditional indicators (up to fifty at any given time each weighted on win ratio merit – all not shown on chart at any given time) – such as simple math calculations relating to price and volume, Fibonacci, simple pivots, moving averages, Gann, Schiff and various other charting, geometric and mathematical factors. I do not yet have AI or Geo Political integration – only math as it relates to traditional indicators with the primary goal being probabilities. I am not a high frequency or bot type algorithm – I am represented on and used on a traditional trading chart as one would normally use as a probability indicator. The goal is to provide our trader’s with an edge when triggering entries and exits on trades with instruments that rely on the price of crude oil (specifically FX: $USOIL $WTI and transitioning to futures in the new year in our new 24 hour oil trading room).

Below you will find my simplified view of levels that can be used on a traditional chart (both intra-day and as a swing trader or investor). This work, and subsequent trading, should be considered one decision at a time, “if this happens then this or this are my targets”… price – trigger – trade and so on. Questions to; [email protected], message our lead trader on Twitter, or message a lead trader privately in the trade room.

EVERY CALL WE MAKE, EVERY PUBLIC INTERACTION, REPRESENTATION OF TRADE (ON EVERY VENUE) IS VIDEO RECORDED (TRADING ROOM), ON SOCIAL MEDIA OR ON BLOG / WEBSITE TIME-STAMPED FOR PERMANENT RECORD AND ABSOLUTE TRANSPARENCY. PLEASE ALSO REFER TO OUR PUBLIC DISCLOSURE https://compoundtrading.com/disclosure-disclaimer/.

FX: $USOIL $WTI Observations:

Below is the link for the live EPIC the Oil Algo Live Trading Chart for Thursday Dec 22, 2016.

https://www.tradingview.com/chart/USOIL/bMKkCV9p-EPIC-the-OIL-Algo-Member-Link/

Intra-day Crude Oil Trading Range: At time of writing FX $USOIL $WTI is trading at 52.24 5:52 AM ET Dec 22, 2016. Some thoughts with respect to traditional charting that may help advance the trading edge: 

Crude, Oil, Trading, Chart
Current trade. Crude algo intra work sheet 556 AM Dec 22 FX $USOIL $WTIC #OIL $CL_F CL $USO $UCO $SCO $UWT $DWT #OOTT

Multi Week Trading Range for Swing Trading:

Note: Be careful with the prices you see in the purple boxes on the right of the chart – they do not line up on chart for price action (they are for indicators).

Pay attention to the upward trending channel – you can enter long and sell in between the channel yellow lines as it trends. If price stays below the resistance then you trade the channel under that and if above a major support line same thing (yellow lines).

Price is currently trading above a horizontal support at 51.93 (yellow line) – watch this for support. Resistance is at 54.39. Review charts over the previous week on my blog to see yellow support and resistance lines and channel that I refer to.

Diagonal Trend Lines:

Diagonal trend-lines (blue). Diagonal trend-lines are critical inflection points. Please review many of my recent posts so you can learn about how important these diagonal trend-lines are. If one is breached you can look to pull-back to next diagonal blue trend line about 90% of the time. Also pay attention to how thick the lines are – the thicker the line the more important because they represent extensions from previous time / price cycles.

Remember you can come in to the chat room to message the trader and REMEMBER I have posted a live chart link earlier in this post so if you can’t see the lines well on this chart above you can go to the live chart link and watch for member live algo chart links through-out the day in your email inbox!

Price Action with 20, 50, 100, 200 MA

Because I review various MA’s on various time frames on daily posts it is a good idea to go back and review previous posts so your buy – sell triggers are known.

Below is how oil has been trading with 20 MA on the 4 hour chart – fairly predictable buy / sell triggers.

Now, it is better to sell at the top of the move and not wait for the 20 MA to trigger to downside as our lead trader did shown as first arrow below vs. 20 MA fail where second arrow is on chart below. Current trading is well below 20 MA.

Crude, oil, 20 MA, 4 hour, chart
Current trade. Crude algo intra work sheet 556 AM Dec 22 FX $USOIL $WTIC #OIL $CL_F CL $USO $UCO $SCO $UWT $DWT #OOTT

The 200 MA on the 1 day provides predictable entry and exit and good trend change indication (until it doesn’t). A review of time cycles prior you will find that you will want for price to come up through the 200 MA from the downside. There are some examples of failure over last number of years if you research it.

200 Day, MA, 1 Day, Crude, Oil, Chart
200 MA on 1 Hour. Crude algo intra work sheet 615 AM Dec 22 FX $USOIL $WTIC #OIL $CL_F CL $USO $UCO $SCO $UWT $DWT #OOTT

Fibonacci Levels:

Fibonacci levels on crude oil chart for tight intra trading.

Watch these lines for support and resistance. Careful using them as traditional retracement levels with crude because the algo lines etc are more dominant / predictable. But the Fib lines are excellent indicators for intra-day trade support and resistance.

There are fib levels on the chart below – but they will just confuse you more than anything. We are currently running calculations with our modeling on how fib levels relate to our targets and trade levels – so the chart below is more mad science right now than anything because this simply a live shot of work we are in the middle of.

Crude oil Fibonacci
Fibonacci levels for oil. Crude algo intra work sheet 652 AM Dec 22 FX $USOIL $WTIC #OIL $CL_F CL $USO $UCO $SCO $UWT $DWT #OOTT

Horizontal Trend-Lines (purple):

Horizontal trend-lines are not as important as the other indicators reviewed above, however, they do serve as important resistance and support intra-day for tight trading and they are important if thick (in other words they come from previous time / price cycles). WE STARTED TO REPRESENT THE REALLY IMPORTANT LINES IN YELLOW FYI FOR EASE. Refer to chart for current applicable horizontal trend-lines.

Advanced Charting:

Respect support and resistance lines: If you can be patient and take your long and short positions against these yellow lines – that is your highest probability trading.

You will see a lot of noise on the charts over the next few weeks (algorithmic calculations of various types). Specific to the charts above they are littered with Fib levels and if you look close you wil see geometric shapes in white or grey lines. Try and ignore for now.

Oil Time / Price Cycles:

Time / price cycles are the single most important indicator and my record calling them is near 100% – since inception seven months ago. The reason they are so important is that a trader does not want to be holding a crude oil instrument at termination of a time cycle if not absolutely sure if price will go up or down. A trade may choose to enter a large position in advance of a time price cycle termination IF THERE IS A HIGH PROBABILITY OF A DIRECTION IN PRICE and if the market is trading at a really important pivot area. In other words, if the market is trading at the bottom of the upward trending channel at a support (yellow lines) and we knew there was a significant probability of a time cycle about to terminate a trader may enter with a long position. The price really spikes or drops significantly when these important time cycles terminate.

The problem with time / price cycle terminations is they change from minute to minute (depending on where price is on the chart) so you have to be in the trade room to get the alert. Our lead traders will do everything they can in future to send these on SMS but we have to be careful because it can be difficult with so much going on in the room. The reason they (time cycles) change is because they are actually represented by or are geometric shapes in the chart – I know it sounds odd but I have (as I mentioned) hit these calls just shy of 100%. The oil political people know the same algorithmic modeling principles and they ALWAYS TIME THEIR BIG ANNOUNCEMENTS AROUND THE TIME PRICE CYCLE TERMINATIONS.

So if you can picture a triangle on the chart – and price is trading in the triangle – and price is going to come to the edge of the triangle and there is a significant support or resistance or an algo line terminating there too or a target (those type of things)… then we know there is a high probability of a time and price change. In other words, it is where there are clusters of algorithm points that cross and when price is going to cross over that cluster is where they are. And these are represented on all the different time frames – the larger the time frame – the larger the time price cycle termination – the larger the spike or downdraft. This is where we establish our intra-day quadrants from for sniping trades (which we will put in to the room soon because it looks like the geo political rhetoric is over for a while making them more predictable). Difficult to explain in short. So we will do our best to SMS alert these in future.

Also, the real large or important time / price cycle terminations we know far in advance and they can be put in these newsletters.

If you review my Epic the Oil Algo Twitter feed, my blog posts and my story on our website you will get a feel for how accurate these calls are.

Per the last few reports we reference a few time cycle and yes as usual crude moved aggressively out of those cycles as we thought. Crude is at time of writing in a downdraft moving aggressively so we cannot give you specific expiration times here because they will be invalid by the time you read. We can update you as needed in the trade room. The one significant time cycle that stands out that won’t change is this Friday at 1:00 nonetheless. Also it is important to note that crude is getting really close to a major support (at 7:16 EST). We have a number of traders looking at possible long positions at 51.95 area and crude $USOIL at time of writing is trading at 52.19.

Alpha Algo Trading Trend-Lines (Red dotted lines):

To determine which algo line is most alpha (or probable) intra day, it is the nearest line to price action. This can also help you determine the trend of trade. If the algo line is trending up the price will follow it up until price is tested at an algorithm indicator (the main tests are diagonal trendlines, horizontal trendlines, time / price cycles etc – as I have shared with you). This is why it is important to watch all the lines because they are all support and resistance. To keep it simple trade the range (yellow lines) as I’ve mentioned but keep an eye on these indicators.

The alpha algo trendlines are on the chart above (red dotted diagonals) – there is one far below price and two above.

Current Alpha Algo Targets (Red circles):

Here is a Twitter post / stream that has a number of tweets with reference to the Wed 4:30 targets.

https://twitter.com/EPICtheAlgo/status/811854170504298500

So what is your most probable algo target for Friday 1:00 PM EST? Your closest target that crude is trending toward is always the most probable. Crude is currently trending toward a target (red circles on chart) Then, your second most probable is the one that is up or down trend depending on whether general price is in an upward or downtrend for the most recent week or so and what your other indicators look like (such as the MA’s I explained above).

Friday’s have not been near as predictable as Tues and Wed (shy of 80% now vs 90%+) and this Friday looks no different so be cautious with this Friday’s targets!

The other way to determine which targets are in play is actually quite simple, you will notice that crude trades between the channel lines up and down and up and down and there are various support and resistance along the way. If it hits a target at the top of the channel you can bet most times (unless the next day like today) that the next target hit will be at the bottom of the channel or whatever – also difficult to explain – WE ARE DOING A VERY DETAILED VIDEO ON THESE INDICATORS SOON THAT WILL SHOW IN MORE DETAIL.

The targets for this week are represented on the chart above. Again, refer to the live charting I send you for this also or be in the trading room.

Wait for the price to trend toward a target and take your position and watch as price gets closer and closer to the target. Remember, that the machines trade from decision to decision – or in other words from support to next resistance or resistance to next support or when the times come each week on Tuesday Wednesday and Friday they will trend toward the target that market price action determines they go to.

Our lead trader will explain more in the room and do not hesitate to ask our lead trader in the room by private message or on twitter to explain intra day decisions.

Oil Intra-Day Algo Trading Quadrants:

Processing now for release any moment (you are seeing the beginning of them above in charts now) – I don’t think there are any real tight crude related snipers beyond our lead trader right now anyway – but nonetheless, we are getting these out – they take a lot of data processing to say the least. We’re almost there.

Indicator Methods:

As explained above, my algorithm is a consideration of up to fifty traditional indicators at any one time – each one given its own weight in accordance to its accuracy (win rate). This is how we establish the probability of specific targets hitting (we call them alpha algo targets).

Alpha Algo Targets, Algo Trend-lines, Algo Timing, Quadrants for Intra Snipes:

Algo targets are the red circles – they correspond with important times each week in oil reporting land. Tuesday 4:30 PM, Wednesday 10:30 AM and Friday at 1:00 PM. The red dotted diagonal lines are the algo trend-lines. And the vertical dotted (red or green) are marking the important times each week. You will find that the price of crude will hit one of the alpha algo targets about 90% of the time. In the absence of market direction the machines take price to the next algo line and/or target. Understanding how the price of crude reacts to the algos and how they move price from target to target is critical for intra-day and swing trading crude oil and associated instruments.

You will notice that price action of crude will use these algo trend-lines and act as support and resistance, and that price also often violently moves when an alpha algo line is breached either upward or downward.

We cover this in much more detail in the member updates, trading room. A review of my Twitter feed and previous blog posts will help you understand the relation of these indicators. We will start posting video blogs (for my subscribers) on YouTube (in addition to my daily blog posts) for swing traders that work during regular trading hours.

Also… we will cover how to establish algo trend-lines and price targets future forward (as you have seen me do on my Twitter feed for some time now).

Conclusion:

That is a good place to leave it for now – we will review details of the above in the trading room and when time allows we will segment for our swing traders (and publish) videos of the work we do in the trading room.

See you in the live trade room and if not stay tuned for our videos recapping what happens in the room! And again, if you struggle to know how to use these indicators as a trader’s edge, it is recommended (if you have earnestly reviewed all of our documentation first) that you obtain private coaching prior to trading a real account with real money – we recommend you use a paper trading account at first. And finally, we will be publishing a “how to use guide” soon, but it will be simply be a recap (consolidation) of instructions in this post, from my Twitter feed, and previously published information on our blog and website. You can also send specific questions to our email inbox at [email protected] – if you do this be sure to ask a specific question so it can be answered specifically. When the 24 hour oil trading room opens you will have ample opportunity in that 24 hour room to ask questions also.

Watch my EPIC the Oil Algo Twitter feed for intra day notices and your email in box for member only material intra day also.

EPIC the Oil Algo

PS If you are not yet reviewing the daily post market trading results blog posts, please do so, they are on the blog daily and often there is information that also may assist your trading. Trade room transcripts (for example) may review topics pertinent to your trading.
Article topics: EPIC the Oil Algo, Crude Oil FX: $USOIL $WTI, $USO, $UCO, $CL_F, $UWT, $DWT, $ERX, $ERY, $GUSH, $DRIP, Chart, Algorithm, Indicators, Trading Room, Trading Edge, Fibonacci, Indicators, Algo, Targets

Read More

Posts navigation

Older posts
Newer posts
Proudly powered by WordPress | Theme: sharksdesign by reviewexchanger.
 

Loading Comments...