
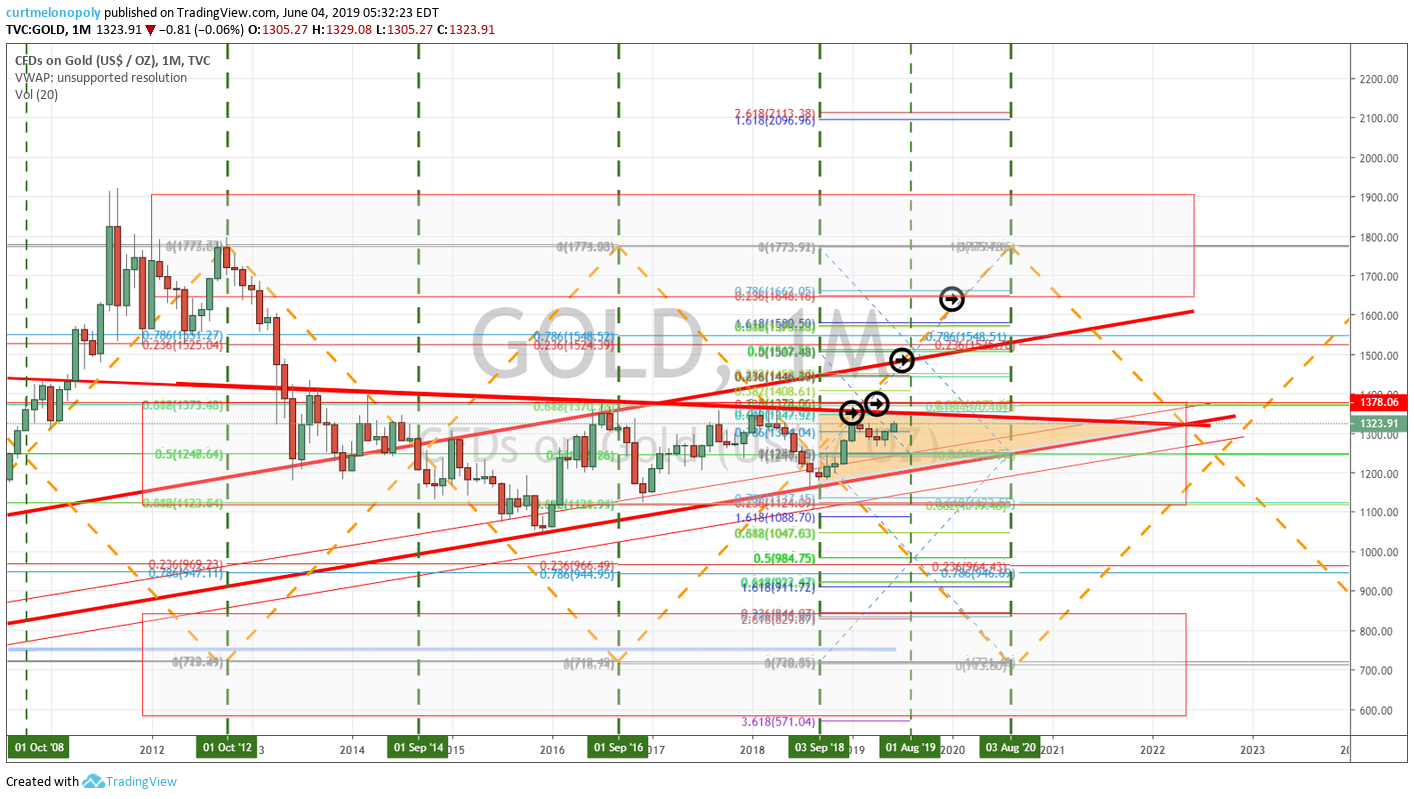
Gold Chart, areas of support and resistance are marked, red triangle, arrows and FIbonacci. $GC_F $XAUUSD $GLD
Gold Chart, areas of support and resistance are marked, red triangle, arrows and FIbonacci. $GC_F $XAUUSD $GLD
Gold Chart, areas of support and resistance are marked, red triangle, arrows and FIbonacci. $GC_F $XAUUSD $GLD
Gold Chart, areas of support and resistance are marked, red triangle, arrows and FIbonacci. $GC_F $XAUUSD $GLD