Swing Trading Report. In this detailed Special Earnings Season (Member Edition) Sunday Aug 5, 2018: $SPY, $DXY, $AGN, $ITCI, $PSTG, $GTHX, $SNAP, $ARWR, $GOOGL, $HIIQ, $FB, $TWLO, $HCLP, $MYND, $CELG, $FIT, $EXP, $OAK, $RSX, $BOFI, $SLCA and more.
What’s New!
- Interested in free swing trading setups? Click here to sign up for the Complimentary Swing Trading Report Mailing List.
- Now available for serious traders – Legacy All Access Membership.
Mid Day Trade Set-Ups Webinar Video:
IMPORTANT: This video gets in to detailed trading levels to watch in your swing trades and also had a number of how to use our charting explanations. Very important to review the video and not just the summary below.
Mid Day Member Webinar – Swing Trading Set-ups Summary (from July 30 mid day, published August 5, 2018):
Forward:
Swing Trading Special Earnings Season Report to cover trading the chart set-ups. Mid day review sessions will become the premise for our next major Q3 and Q4 positioning in the stock market.
We are reviewing all one hundred equities we have in coverage on our swing trading platform – all over the next ten days or so for earnings trading season.
Trade alerts are reviewed in this video that triggered today.
Be sure to actually watch this video as the summary below is only for reference and doesn’t give a whole picture for any of the trade set-ups listed.
All quoted support and resistance are approximate.
SP500 $SPY
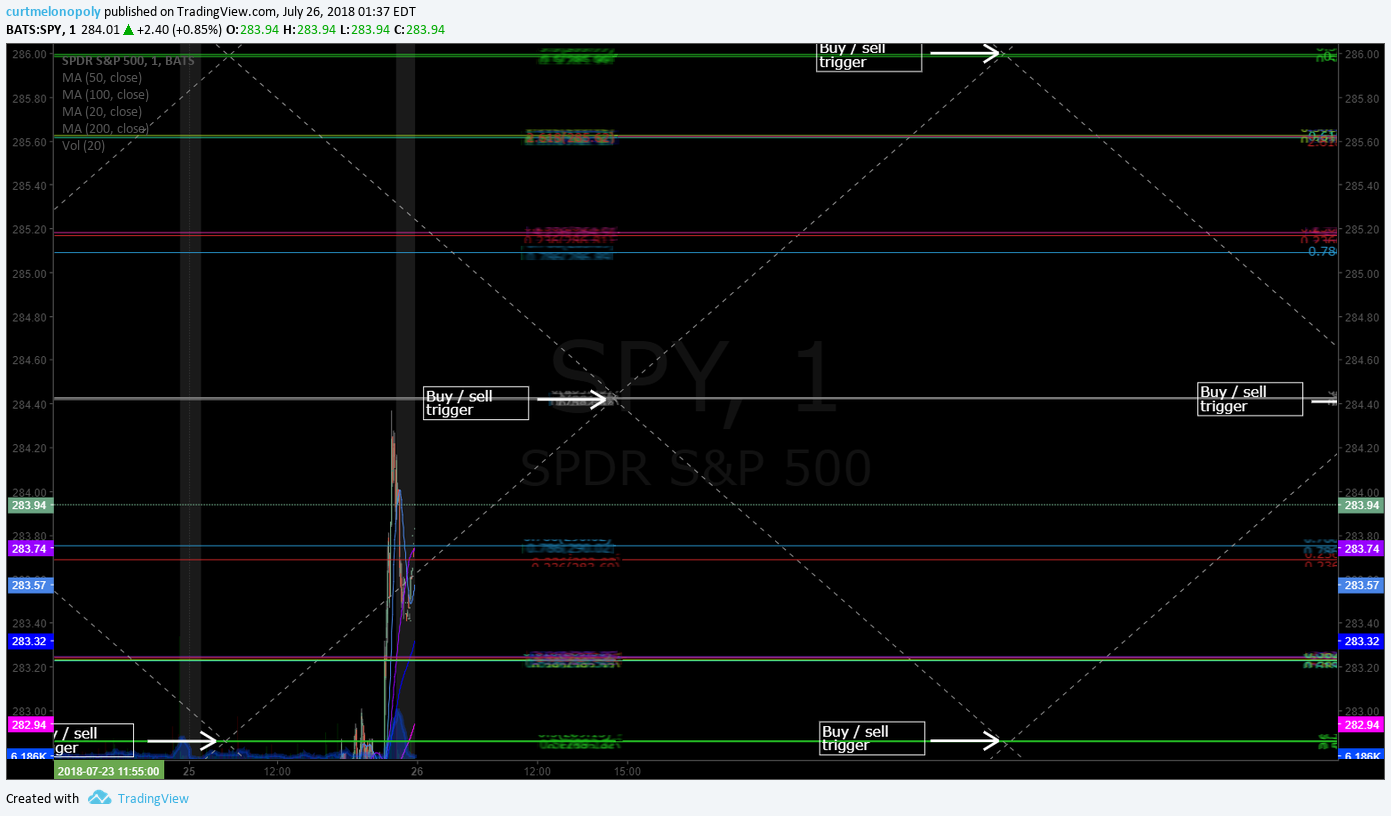
Trading 280.14, 200 MA on 60 min under trade, support 278.60, target Aug 2 11:00 278.60 range, if it gets a bounce 283.75 Aug 13 is price target to upside. Volatility is up in the first day of new volatility time cycle. Next $VIX cycle ends Dec 24 approx. Resistance 283.70 on SPY.
Our trade alerts as they relate to market inflections are reviewed on video.
US Dollar $DXY
Still in structure respecting resistance. Up over resistance then there could be a significant move up to next structure resistance on chart reviewed.
OIL $WTI $USOIL – oil trade on the day is reviewed. Weekly price targets are reviewed from EPIC oil algorithmic model
ALLERGAN (AGN)
Trading channels on the AGN chart are reviewed as are various charts.
The Allergan trade alerts as they progressed, time cycles, and buy sell triggers on $AGN are discussed on the video. This type of charting (structured charting) is also discussed and may help students of the market – some trade coaching notes here.
How this relates to our algorithmic charting models, machine trading and the timing of our Sept 14-16 Cabarete Trade Coaching event is discussed.
Black box algorithmic charting is discussed at this point in the video.
Our specific trading services platform / roll-out schedule is also discussed.
The calls specific to our trade alerts and trading in AGN are reviewed in detail.
Quant funds, lies in the markets, media selling fear and what people (retail) want to hear and why retail loses are also discussed on the video for our trading students.
Click here for our previously published exclusive member report: Protected: How to Trade Allergan (AGN) Stock Move (Exclusive) $AGN
Today’s Research Reports on Trending Tickers: Bristol-Myers Squibb and Allergan $AGN https://finance.yahoo.com/news/todays-research-reports-trending-tickers-122000758.html?soc_src=social-sh&soc_trk=tw
ALLERGAN (AGN) Closed Friday 185.93 over 184.62 support 189.07 is resistance test next. Trim in to add above. $AGN

INTRA CELLULAR (ITCI)
Structured charting is also reviewed on video here. Timing cycles, price targets to up and downside, buy sell triggers etc.
Intra-Cellular Therapies Provides Corporate Update and Reports Second Quarter 2018 Financial Results $ITCI https://finance.yahoo.com/news/intra-cellular-therapies-provides-corporate-110932713.html?soc_src=social-sh&soc_trk=tw
INTRA CELLULAR (ITCI) Closed Friday 20.90, main resistance 24.77, support 19.75, 24.60 price target Set 6 if bullish. $ITCI

PURE STORAGE (PSTG).
If you are using these charts and you want to get rid of the indicators at the bottom so that the chart model is easier left click twice on field area to get rid of indicators at bottom.
Pure storage earnings in 26 days (as of date of video). Indicators and support and resistance are reviewed on video.
Again, structure of charts is discussed on video.
The massive chart channel is reviewed.
Support / resistance levels and price targets are discussed in detail for Pure Storage on the video.
Previously published exclusive swing trading report can be found here for PSTG: How to Trade Pure Storage (PSTG) Earnings in Six Days (Member Edition) $PSTG
7 Tech Stocks That May Soar On Takeovers $PSTG $FSLR $CY $LOGM $ETSY $HUBS $OKTA http://www.investopedia.com/news/7-tech-stocks-may-soar-takeovers?
PURE STORAGE (PSTG) closed just above key support last Friday – important time of week for a stock to trade just above key support level $PSTG

G1 THERAPEUTICS (GTHX)
Our swing trade success in G1 is discussed on the video as well as the various support and resistance levels on the charting, trade alerts ad price targets.
Bullish trade trajectory on this equity is awesome (see trade between diagonal green target trajectory lines) and the channel trade is in is now noted on the charting (yellow).
G1 Therapeutics to Provide Second Quarter 2018 Corporate and Financial Update on August 8, 2018 $GTHX https://finance.yahoo.com/news/g1-therapeutics-second-quarter-2018-100000130.html?soc_src=social-sh&soc_trk=tw
G1 THERAPEUTICS (GTHX) Closed 51.38 Friday, 53.66 58.29 resistance, 49.01 44.41 support $GTHX.

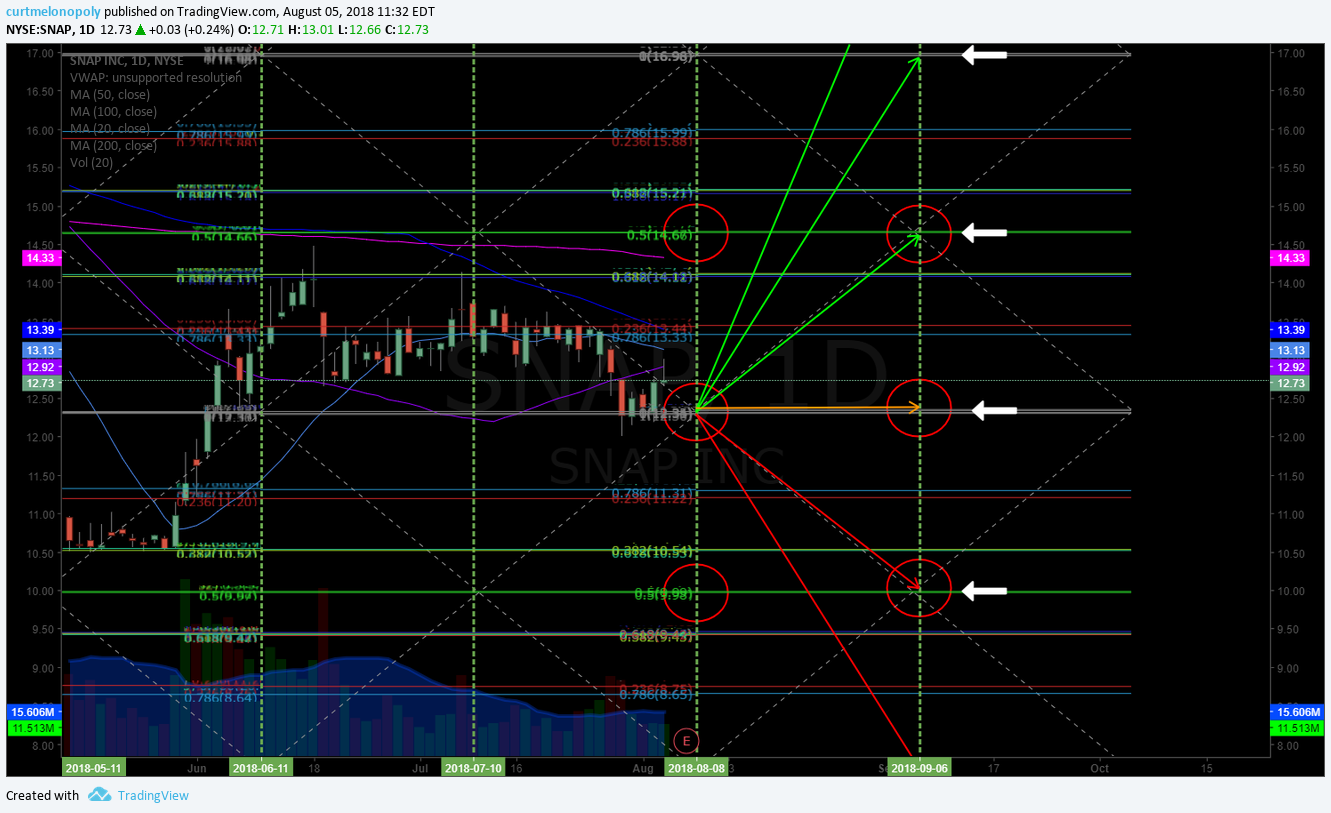
SNAP INC (SNAP) Earnings Trade Chart (Earnings in 2 days).
SNAP is not an easy stock to trade – we provide the specific levels to watch in earnings in two days.
The chart below is an updated version for earnings and is very detailed with all support, resistance, price targets, time cycles, trade trajectory lines and more.
SNAP closed Friday 12.73, it has supports at 12.33 and 9.99 in a sell-off. The SNAP chart has resistance at 14.66. Next time cycle ends Sept 6 on the chart with upside scenario 14.66 area and 9.99 area on the same day. In a total sell-off 7.64 is the next downside support.
3 Reasons Snap Investors Should Be Nervous Next Week $SNAP https://finance.yahoo.com/news/3-reasons-snap-investors-nervous-150000656.html?soc_src=social-sh&soc_trk=tw
SNAP INC (SNAP) How to trade SNAP earnings chart, support resistance price targets time cycles. $SNAP

ARROWHEAD PHARMA (ARWR)
My trading plan and trade alerts for ARWR are discussed in detail on the video. The trading channel, price targets, earnings plan, trade sizing, price support and resistance and moving averages are reviewed. The chart below highlights the current trading structure on ARWR with a highlighted triangle drawn on the chart (outlined in green).
How the market responds to earnings in two days will decide how I will trade ARWR post earnings.
Arrowhead Pharmaceuticals Earns $10 Million Milestone Payment from Amgen $ARWR https://finance.yahoo.com/news/arrowhead-pharmaceuticals-earns-10-million-113000479.html?soc_src=social-sh&soc_trk=tw
ARROWHEAD PHARMA (ARWR) Closed Friday 14.54 earnings in 2 days, main resistance 16.41 23.79 support 8.84 $ARWR

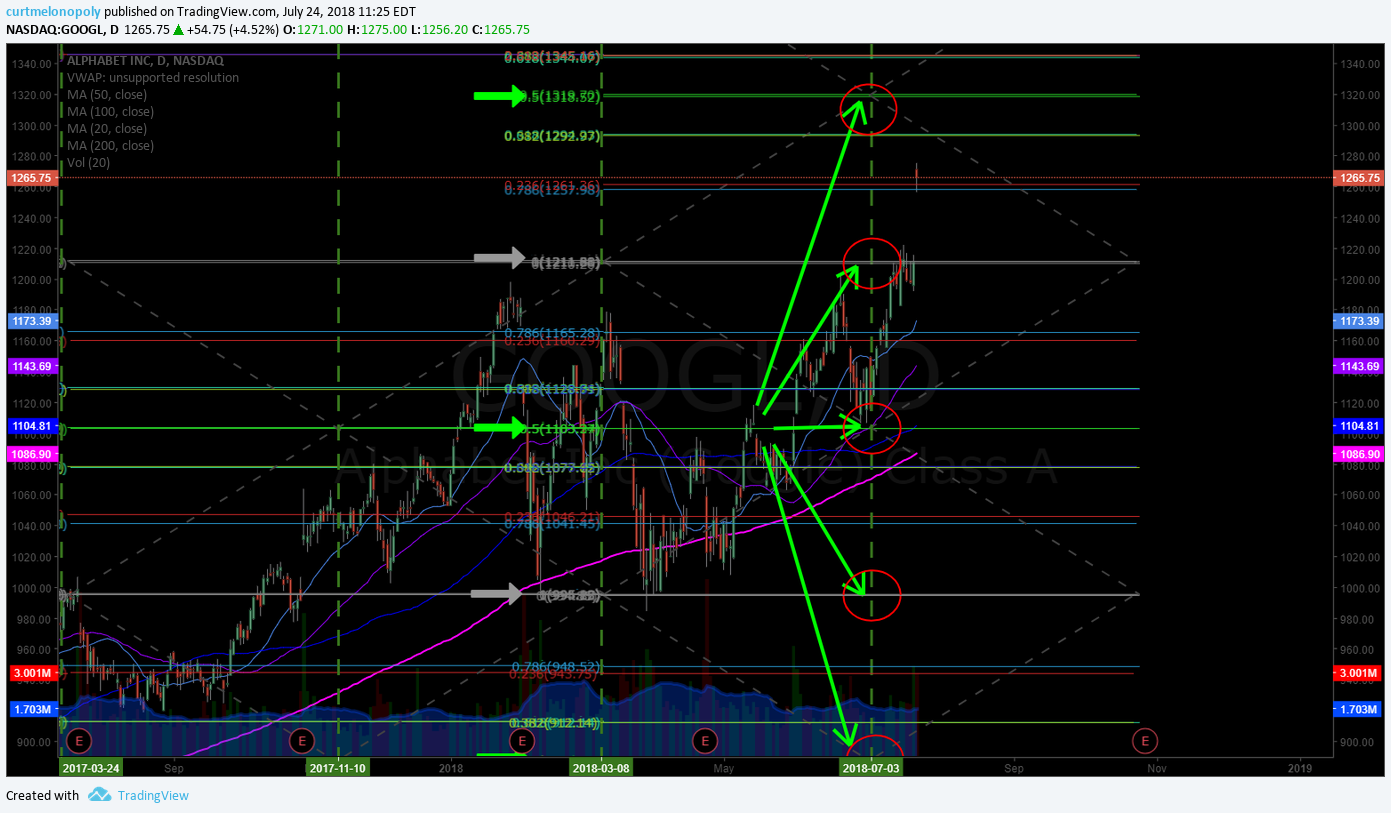
ALPHABET (GOOGL)
All the future forward price targets are discussed on video for Google post earnings. In addition to a swing trading chart for Google I have also included a daytrading chart below for daytraders.
There is a previously published exclusive member reports here: Protected: Trading Alphabet (GOOGL) Post Earnings. Swing Trading, Day Trades, Investing (Member Edition) $GOOGL
Report: Google working on a censored search engine for China $GOOGL https://www.yahoo.com/news/report-google-working-censored-search-004932360.html?soc_src=hl-viewer&soc_trk=tw
Google (GOOGL) Post earnings chart. Closed 1238.16 Friday. Main support 1211.86 resistance 1320.10. $GOOGL

ALPHABET (GOOGL) Daytrading chart with lower time frame support and resistance levels for daytraders. $GOOGL #daytrading #chart

Health Innovations (HIIQ)
Upside and downside price targets on the chart. Careful with resistance test in progress and the divergent trade possibilities. The upper channel is also being tested so an over bought retrace is very likely here. Congrats to longs on this swing trade alert. Hit bullish price targets early.
3 Stocks That Soared 20% or More This Week — Which Are Still Buys? $MOH, $DXCM, $HIIQ https://finance.yahoo.com/news/3-stocks-soared-20-more-123100958.html?soc_src=social-sh&soc_trk=tw
Health Innovations (HIIQ) ripped through the chart structure in a fantastic way. Careful above channel resistance. $HIIQ chart.

FACEBOOK (FB)
Facebook has got a bounce up since our alerts during the panic sell-off. The wash out trade set-up in the sell off is very similar to the last, and we killed the last swing trade set up in a sell off. We’re expecting another big trade here. All levels on chart and explained in video.
Click here for the previously published exclusive member reports for swing trading Facebook:
Protected: Trading Facebook (FB) Earnings Part 2 – Opportunity Knocks (Member Edition) $FB
Protected: Trading Facebook (FB) Earnings Wash-out on Revenue Growth Warning (Member Edition) $FB
Betting on a Smoother Ride for Tech Stocks https://www.barrons.com/articles/betting-on-a-smoother-ride-for-tech-stocks-1533330236
FACEBOOK (FB) Closed 177.78 Friday with 181.80 trajectory price target Aug 8 then 195.00 Aug 27. $FB

TWILIO (TWLO)
Video reviews all levels going to earnings and chart below is an update since the mid day review. TWILIO has earnings this week and will be one of my main watches. MACD has been trending down on the daily chart and I am interested in a cell-off hopefully to 100 MA for a bounce play possibly. A significant wash-out snap back scenario would be best post earnings. We will see what happens.
3 Internet Stocks That Have a Killer Advantage $TWLO $NFLX $FB https://finance.yahoo.com/news/3-internet-stocks-killer-advantage-140600278.html?soc_src=social-sh&soc_trk=tw
TWILIO (TWLO) Over 20 MA on daily chart with stochastic RSI turned up, watching trend structure in to earnings in one day. $TWLO #chart #earnings

HI-Crush Partners (HCLP)
Hi crush has the potential to be a big trade. I’m watching the 200 MA slowly make its way down and I am hoping for a breach of it with price. I have it on watch and will produce a chart model should we engage a trade. Last week trade closed at the bottom of the weekly channel range in the 13.30 area. Hoping for a significant ROI on this one.
Hi-Crush Partners Telegraphs Major Changes to Its Business https://finance.yahoo.com/news/hi-crush-partners-telegraphs-major-191700714.html?soc_src=social-sh&soc_trk=tw
HI-Crush Partners (HCLP) Watching the 200 MA on weekly chart slowly work its way down. On close watch. $HCLP #chart #swingtrading

MYND ANALYTICS INC (MYND)
MYnd Analytics Partners with VisionQuest to Provide Telepsychiatry Services for its Community-Based Outpatient Mental Health Clinic in Pennsylvania https://finance.yahoo.com/news/mynd-analytics-partners-visionquest-telepsychiatry-142850638.html?.tsrc=rss
$MYND is reviewed on the video, it was one of the momentum stocks for last week. I am watching it for a daytrade going in to next week.
CELGENE (CELG)
There was a report on Celgene June 12 put out. We have had much success with this stock this year. Longs need to trim in to the Aug 8 price target resistance. Over its 200 MA currently.
Zacks.com featured highlights include: Celgene, Progressive, T. Rowe Price, AMC and Celanese https://finance.yahoo.com/news/zacks-com-featured-highlights-celgene-115511301.html?.tsrc=rss
CELGENE (CELG) Price target 95.90 Aug 10 in play. Main chart support at 86.28. Bullish formation. $CELG #swingtrading

EAGLE MATERIALS (EXP)
Eagle has been a very predictable chart. It is currently bouncing near recent bounce areas. Watching for a possible long trade, more likely after the time cycle on the chart expires but price will determine action. The trading quadrants on chart structure are discussed on video.
Eagle Materials Reports First Quarter EPS Up 22% On Record Revenues $EXP https://finance.yahoo.com/news/eagle-materials-reports-first-quarter-103000694.html?soc_src=social-sh&soc_trk=tw
EAGLE MATERIALS (EXP) Bounced near support, watching for a possible long as it has bounced here prior. $EXP

FITBIT (FIT)
If I had the time to publish another special trade report of FITBIT I would, but I don’t. The lats time we killed the wash out trade and it’s setting up again. Closed 5.46 Friday post earnings in a wash out sell off and this week over 5.61 with structure is a long to 6.66 etc. All levels are on the chart. All the price targets, time cycles, trade trajectories, support and resistance area etc are included on the swing trading chart below.
Click here for a previously published member exclusive report on trading FITBIT:
FITBIT INC CLASS A (NYSE: FIT). How to Trade FitBit for 40% Gain (Member Exclusive) $FIT
Unloved Fitbit Watches Shares Slide Despite Beat $FIT https://realmoney.thestreet.com/articles/08/03/2018/unloved-fitbit-watches-shares-slide-despite-beat
FITBIT (FIT) Earnings wash-out swing trade setting up here. Levels on chart and this post $FIT #swingtrading #earnings #chart

OAKTREE CAPITAL GROUP (OAK)
We are watching this very close here. The upside targets on OAK chart are very aggressive. We did well in it post election and are looking for another. The news article below does have some insight for investors.
Oaktree Capital Sees Solid Results in a Challenging Market
OAKTREE (OAK) Watching trade for a breach over 200 MA really close for a long side trade. $OAK

RUSSIA ETF (RSX) Under 200 MA on the daily with indecisive indicators. Watching. $RSX #chart
Why Russia’s Manufacturing PMI Is Gradually Contracting
https://marketrealist.com/2018/07/why-russias-manufacturing-pmi-is-gradually-contracting

BOFI HOLDING (BOFI) Bulls bought the dip near 200 MA prior to earnings. On watch for post earnings setup. $BOFI
BofI Federal Bank Signs Agreement to Acquire $3 Billion of Deposits from Nationwide Bank https://finance.yahoo.com/news/bofi-federal-bank-signs-agreement-113000968.html?soc_src=social-sh&soc_trk=tw

US SILICA HOLDINGS (SLCA) Under 200 MA post earnings near historical bounce area. On watch with MACD up. $SLCA #chart
U.S. Silica (SLCA) Misses Earnings & Sales Estimates in Q2 https://finance.yahoo.com/news/u-silica-slca-misses-earnings-134401463.html?soc_src=social-sh&soc_trk=tw

Charts and Chart Links re: Member Version.
(Mailing list versions that may be made available from time to time may not include charting or chart links and may or may not be published in a timely rotation).
If you have any questions about this special earnings trading report message me anytime. If you do not know how to take advantage of algorithmic structured trading charts please consider basic trade coaching of at least 3 hours to get on the winning side of your trading – you will find details here.
Cheers!
Curt
I get a lot of Questions about How to Trade our models, this vid has 5 min explanation at 1:00 min-6:00 min. https://www.youtube.com/watch?v=QrXbE7lojAg&t=3s … – Fib Trendlines, Trading structure/quads, Price targets, Main support resistance (buy sell triggers), Time cycles, Moving averages, Trading trims/adds.
Promo Discounts End Aug 14!
Temporary Promo Discounts (for new members only).
Subscribe to Weekly Swing Trading Newsletter service here Reg 119.00. Promo Price 83.30 (30% off). Promo Code “30P”.
Or Real-Time Swing Trading Alerts Reg 99.00. Promo Price 69.37 (30% off). Promo Code “Deal30”.
I personally guarantee our swing trading service is one of the best in the business and it’s very reasonably priced considering the technical expertise invested in the platform (Lead Trader).
Subscribe to Swing Trading Service:
Swing Trading Bundle (Swing Trading Newsletter and Live Swing Trading Alerts).
Swing Trading Newsletter (Weekly Newsletter Published for Traders).
Real-Time Swing Trading Alerts (Private Member only Twitter Feed).
One-on-One Trade Coaching (Via Skype or In-Person).
Free Mailing List(s):
Join Email List for Free Trade Charting Trade Set-ups, Deals, Podcasts and Public Webinars.
Free Swing Trading Periodical Contact Form (Complimentary Swing Trade Set-Ups to Email)
Public Chat:
Visit our Free Public Chat Room on Discord.
#swingtrading #tradealerts #trading #earnings
Follow Me: