My Stock Trading Plan for Friday Dec 16, 2016 in Chat room. $EVOK, $SHIP, $ESEA, $DCIX, $TIG, $USOIL, $WTI, $GOLD, $GLD, $GDX, $USD/JPY, $SPY, $SILVER, $SLV, $SI_F, $VIX, $UVXY $TVIX $NG_F… more.
Welcome to the morning Wall Street trading day session!
Important Notices:
If you are not reviewing the post market trade reports along with this please do so. We assume our trading room subscribers do review it everyday and as such there will be information often in that report that is applicable and not in this premarket report. You will find the post market reports on our blog daily before this one is published.
REPORTING: This will be another quick report. The market is settling in now from an algorithmic modelling perspective and we expect all charting for all algorithms to be done and published again before Monday morning market open. IT IS IMPORTANT TO NOTE that the calls all the algos have made since inception seven months ago HAVE NOW HIT. THIS MEANS that there is a VERY HIGH PROBABILITY WE ARE RIGHT IN THE MIDDLE OF THE MARKET INFLECTION. So we are going to publish trade levels for all algos for direction up and down. If you are not a subscriber of a specific algo we cannot share detailed info about these algo calls (other than what is made public or is determined to be early beta for an algo). BUT OUR ROOM SUBSCRIBERS and DAILY MARKET NEWSLETTER subscribers will see the traditional charting we do and will be published (which is a precursor to and what we use to calculate the algo targets anyway). I say all of that just so that everybody is clear about how we do our reporting because we have received a number of inquiries the last 72 hours about this topic:) And frankly at inflection when the reverse trends occur that is the most important time in markets. So hopefully I explained that right.
So bottom line is today’s report is thin and starting Monday you will find the charting to become much more focused toward the upcoming moves in the market.
Per yesterday:
Yesterday came and went and there was some time / price cycle changes in each algorithm as a result of the Fed speak so we are including algorithm subscribers in this newsletter distribution this morning because it will be a day or two until price action settles and machine prediction is such that the algo targets. algo lines, time and price cycles, and intra trading quadrants can be published.
The trading room had issue yesterday with intermittent internet (which is bizarre because we have the best you can buy and we are supposed to be in a jurisdiction that has one of the best internet connectivity in the world). Anyway, if this occurs today (as with yesterday) we will just keep signing back in with you guys. While I am writing this is an issue again.
The algos have been nailing targets so be sure to review their Twitter feeds and the Post Market Trading Results newsletter from yesterday that was published this morning.
As far as timing is concerned with the algos, we have them all ready (the last few laggards) so when things settle over next day or two they will all finally be published in complete detail. It’s been a long seven months of work

Current Holds:
$CBMX, $JUNO, $UWT (deep dive)
Market Outlook:
As mentioned above; all algos (Oil, SPY, Gold, Silver, Dollar, VIX) have hit their targets now so we are running calculation targets for all six algos for all time charting time-frames and expect these reports to start rolling out before Monday morning. WE SEE INFLECTION HERE – it may last a while – a pause – but it is either here right now or VERY VERY close.
Momo: $EVOK, $SHIP, $ESEA, $DCIX, $TIG
Petrobras signs $5B deal for Chinese financing, oil supply http://seekingalpha.com/news/3231083-petrobras-signs-5b-deal-chinese-financing-oil-supply?source=twitter_sa_factset … #premarket $PBR
MGM and Wynn rally after Goldman weighs in favorably on casino sector #premarket $MGM $LVS $BJK
S&P flat.
10-yr +0.26%.
Euro +0.44% vs. dollar.
Crude -0.61% to $50.59.
Gold +0.62% to $1,136.85.
If you are new to our trading service you should review recent blog posts and at minimum of our algorithm Twitter feeds because they do tell a story in terms of the market and how the inflections of the market determine our day to day trading. And you will notice quickly that the algos have been undeniably accurate on many time-frames (intra-day and months out) so I myself have learned to respect their math (they have taken me from a 60% hit rate to 80% in my trading – all publicly posted live trades). A quick hour of review at most will bring you up to date.
The algorithm Twitter feeds can be found here: $WTI (@EPICtheAlgo), $VIX (@VexatiousVIX), $SPY (@FREEDOMtheAlgo), $GLD (@ROSIEtheAlgo), $SLV (@SuperNovaAlgo), $DXY (@DXYUSD_Index).
Momentum Stocks (Market Open and Intra-Day):
I do trade morning momo stocks (at times), but I do avoid risk – so often I avoid the first 30 minutes (gap and go) and trade momentum stocks later in the day after the wash-out looking for a snap-back. Just prior to open and shortly after open I post momentum stocks to the trade chat room (and Twitter ans Stocktwits if I have time).
Some of my Favorite Set-Ups:
(1) Momentum Stock Wash-Outs for Snap Back, (2) Bad News Wash-outs on Stocks with High Institutional Ownership, (3) Getting on the Right Side of a Trend Change and scaling in my position and (4) Our Algorithm Set-Ups.
The momentum stocks (from previous days and morning trade) I continue to watch through the day for indicators that allow a trade.
Morning Stock Watch-Lists for my Favorite Set-Ups:
(1) Pre-Market Gainers Watch-List: $EVOK $SHIP $ESEA $DCIX $TIG $CANF $SINO $HZNP $JBL $DRYS $TXMD $PES $TSL $MTL $GSL $SDRL I will update before market open or refer to chat room notices.
(2) Pre-market Decliners Watch-List: I will update before market open or refer to chat room notices.
(3) Other Watch-List: $AKAO (momentum play this week), $AGIO (recent wash-out), $SGY (recent swing), $CBMX (current swing), $JUNO (current swing), $ANF (previous wash-out on news), $SKLN (previous wash-out on news), $URBN (previous wash-out on news).
(4) Regular Algo Charting Watch-List: Gold $GC_F $GLD, Miners $GDX ($NUGT, $DUST, $JDST, $JNUG), Silver $SLV $SI_F ($USLV, $DSLV), Crude Oil FX: $USOIL $WTI ($UWTI, $DWTI, $USO, $UCO, $CL_F, $UWT, $DWT), Natural Gas $NG_F ($UGAZ, $DGAZ), S & P 500 $SPY $ES_F ($SPXL, $SPXS), US Dollar Index $DXY ($UUP), Volatility $VIX ($TVIX, $UVXY, $XIV)
(5) Upgrades:$REGN $POR $PEG $RPAI $WRE $VER $CLI $DRE $BRX $BRO $PAYX $ADP $HZNP $SAIA $AVB $GE $KSU $SLG $MAC $COR $ESS $CP $ERIC $CCE $BID $VEEV $BCRX $KO $CLX $KSU $XEC $RICE $OXY $TGB $CRR $PES $AXL I will update before market open of refer to chat room notices.
(6) Downgrades: $DUK $PEGI $JWN $MRT $MPW $UDR $KIM $EPR $DEI $DCT $BDN $DRI $MSGN $CCP $SRC $SRC $ICLR $HP $NE $DO $RIG $ATW $DO $OII $TTI $HR $DOC $BXP $CPT $STOR $CDR $MRTN $KNX $HTLD $LSTR $CGI $WERN $RDC $FI $WTW $XEC $WLL $RSPP $CXO $CRZO $APA $SGMS $Q $PTEN I will update before market open or refer to chat room notices.
Stay tuned in Stock Chat Room for more pre-market stocks on watch.
Regular Trades:
S & P 500: $SPY $ES_F ($SPXL, $SPXS)
On Monday you will have charting levels for the up move, the down move and the sideways move. Price is stuck at resistance I alerted before the Fed.
Outlook:
As I wrote this week:
In yesterday’s premarket (as I mentioned above) I wrote about resistance the algo alerted at 277.80. This is still in play FYI. However, the Fed will determine now naturally whether we trend up or down from where we are. My bias is up until new year BUT I WOULD BE READY because money could get caught offside. Who know?
As pre previous and our algorithm call before election…. My bias is still to new highs but I am looking at a pull-back Christmas / Early 2017.
As above in my intro and previous, the chart ain’t broke till its broke. When its broke we’ll let you know. Detailed charting on deck.
My Trading Plan: Right now I am trading $XIV instead of $SPXL or $SPXS. I do this because we are in a trend of crushed volatility. Now, when that changes and volatility starts to rise again (even if $SPY is rising at the same time) then I’ll flip over to trading $SPXL and $SPXS instead of $XIV.
Volatility: $VIX ($TVIX, $UVXY, $XIV)
Outlook:
As I wrote this week:
Looking for possible record lows before Christmas.
As above, I am thinking opportunity comes between Christmas and Trump, and by the way, when $VIX spikes the easiest play is short short short. FYI.
CNN Fear and Greed Index: http://money.cnn.com/data/fear-and-greed/
My Trading Plan for Volatility: I will likely follow that trend with $TVIX $UVXY $XIV buys at range pivots / pending price action, volume and other geo events. SHORT $VIX SPIKES!
Currencies and Other Global Markets: $DXY US Dollar Index ($UUP US Dollar Bull, $UDN British Pound, $USD/JPY, $FXY Japanese Yen Trust, $CNY China, $TZA, $SMK / $EWW Mexico Capped ETF)
As I wrote over and over again since July 2016 when our algo locked the math in:
BE VERY CAREFUL LISTING TO THE $USD/JPY bears – they have been feeding misery to followers for many weeks – the chart is not broke – price is currently at support and there could easily be another leg up – nobody knows but the trend is your friend!
THIS IS STILL SUPER BULLISH!!!
My Trading Plan for Currencies / Global Markets: Waiting, waiting, waiting.
$USDJPY CHART IS NOT BROKEN! IT IS A BULL UNTIL IT IS NOT…
$USD/JPY Caution Gold bulls. Not broken yet. Gold: $GLD ($UGLD, $DGLD). Miners: $GDX ($NUGT, $DUST, $JDST, $JNUG) pic.twitter.com/FunXs6s1l7
— Melonopoly (@curtmelonopoly) December 7, 2016

Gold: $GLD ($UGLD, $DGLD). Miners: $GDX ($NUGT, $DUST, $JDST, $JNUG)
Rosie the Gold Algo target call HIT!
Hit my PT from July call but not lower quad. Gold algo intra work sheet 558 AM Dec 5 $GOLD $GLD $UGLD $DGLD $GDX $NUGT $DUST $JDST $JNUG pic.twitter.com/Uqoxwu4fCt
— Rosie the Gold Algo (@ROSIEtheAlgo) December 5, 2016
Hit price target predict @RosietheAlgo fr July waiting for algo quad confirm long. $Gold $GLD $UGLD, $DGLD $GDX $NUGT, $DUST, $JDST, $JNUG pic.twitter.com/aZ5m6n0fJ8
— Melonopoly (@curtmelonopoly) December 7, 2016
Target Hit! Gold collapses to @ROSIEtheAlgo 1133.00 price target bottom quadrant. $GOLD $GLD $UGLD $DGLD $GDX $NUGT $DUST $JDST $JNUG #algo pic.twitter.com/UYUOKoVw3J
— Melonopoly (@curtmelonopoly) December 16, 2016
Per recent posts:
My Trading Plan for Gold: Short term there could be a pretty good pop around the Fed, but I don’t expect it would last. It could pop to the top of the algo quadrant but I don’t think it would run past – NOT YET ANYWAY. So who know’s I may play a short term scenario – Fed / market reaction dependent.
I am waiting for the trend reversal. We are very close to the price target at the bottom of that quadrant at 1133.00 ish. The initial wide frame target Rosie the algo nailed but there has been a wait and see for a reversal because of one more possible leg down. Getting very close IMO.
I haven’t started to take trades yet because I am waiting for “price – trigger – trade” set-ups. I will start chewing around the edges of stocks like $NUGT and $GLD likely. The idea is to get on the right side of the trade and trend.
WE SHOULD BE ALMOST THERE! GET READY! LIKELY BETWEEN CHRISTMAS AND TRUMP POWER TRANSFER! CHARTS COMING!
Other equities I like for Gold Trade: $AUMN (penny stock). When the trend reversal confirms I will post all the Gold equity picks here.
Silver $SI_F: $SLV ($USLV, $DSLV)
Yesterday Silver tanked real hard! Good thing we’ve been sitting on our hands awaiting inflection point here.
SILVER. Well here we go
Target Hit! @SuperNovaAlgo called 15.80 – 16.25 price target months ago! $SLV $SI_V $USLV $DSLV Algos on fire! pic.twitter.com/qQyynuchnS
— Melonopoly (@curtmelonopoly) December 15, 2016
Same as Gold – we’re waiting for a decision from market so we can get algo targets.
My Plan for Trading Silver: same
Per previous;
Same as Gold, I’m waiting for the “price – trigger – trade” set-ups… I am going to start chewing around the edges of stocks when set-up confirms like $USLV and $SLV attempting to get on right side of trend trade.
Silver fighting with resistance. It could pop to 200 MA on 1 week. Possible. $SI_F $SLV $USLV, $DSLV
Other equities I like for Silver trade: $AUMN (penny stock). Same here, when trend reversal occurs I will post equity picks here.
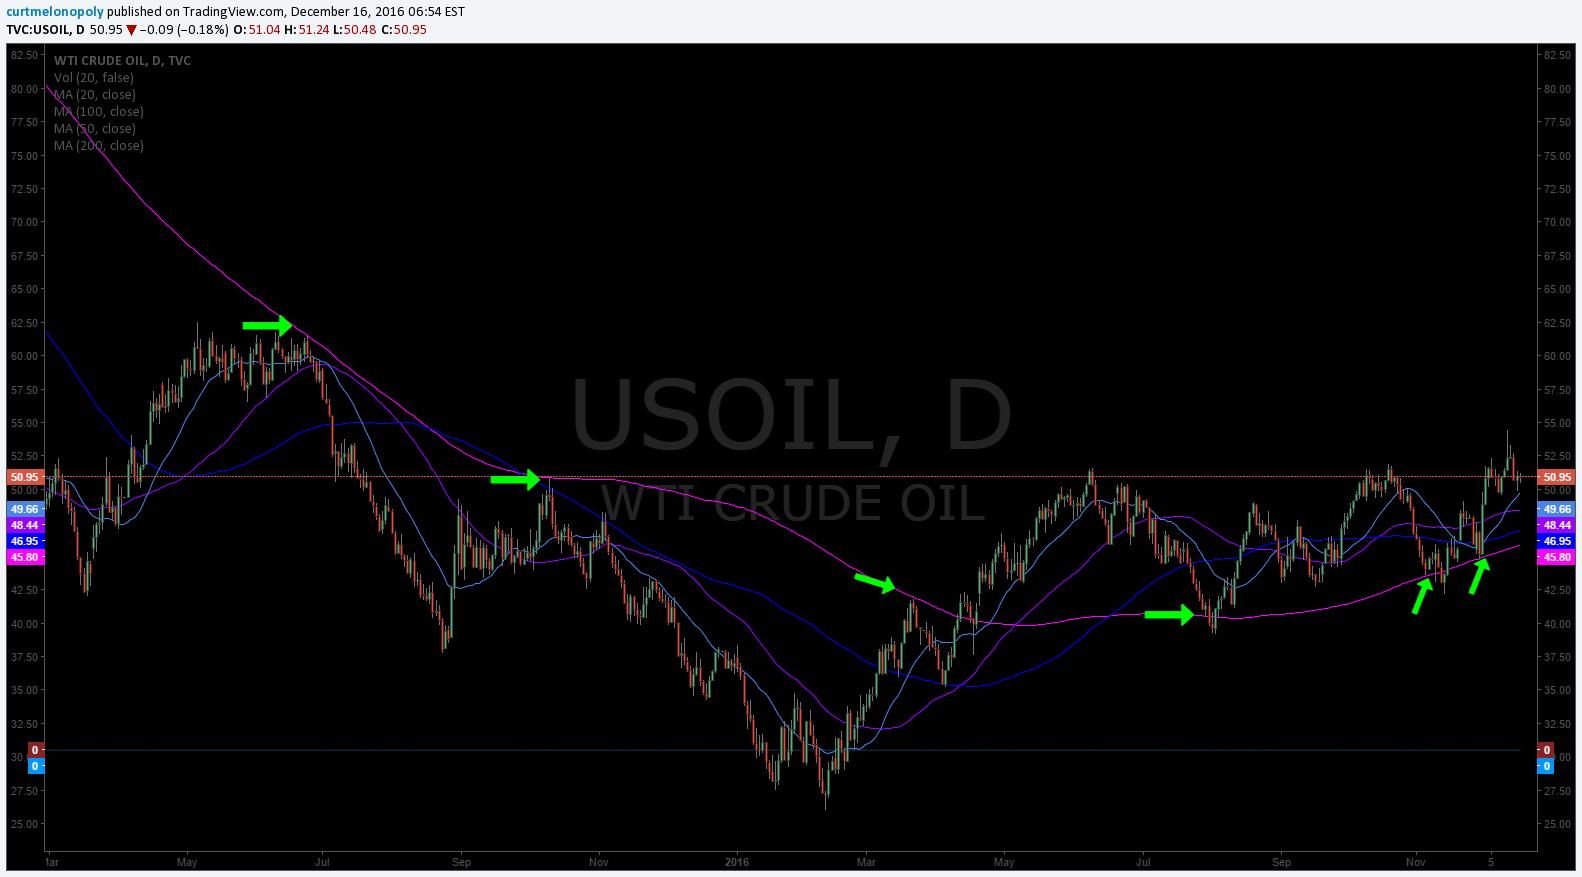
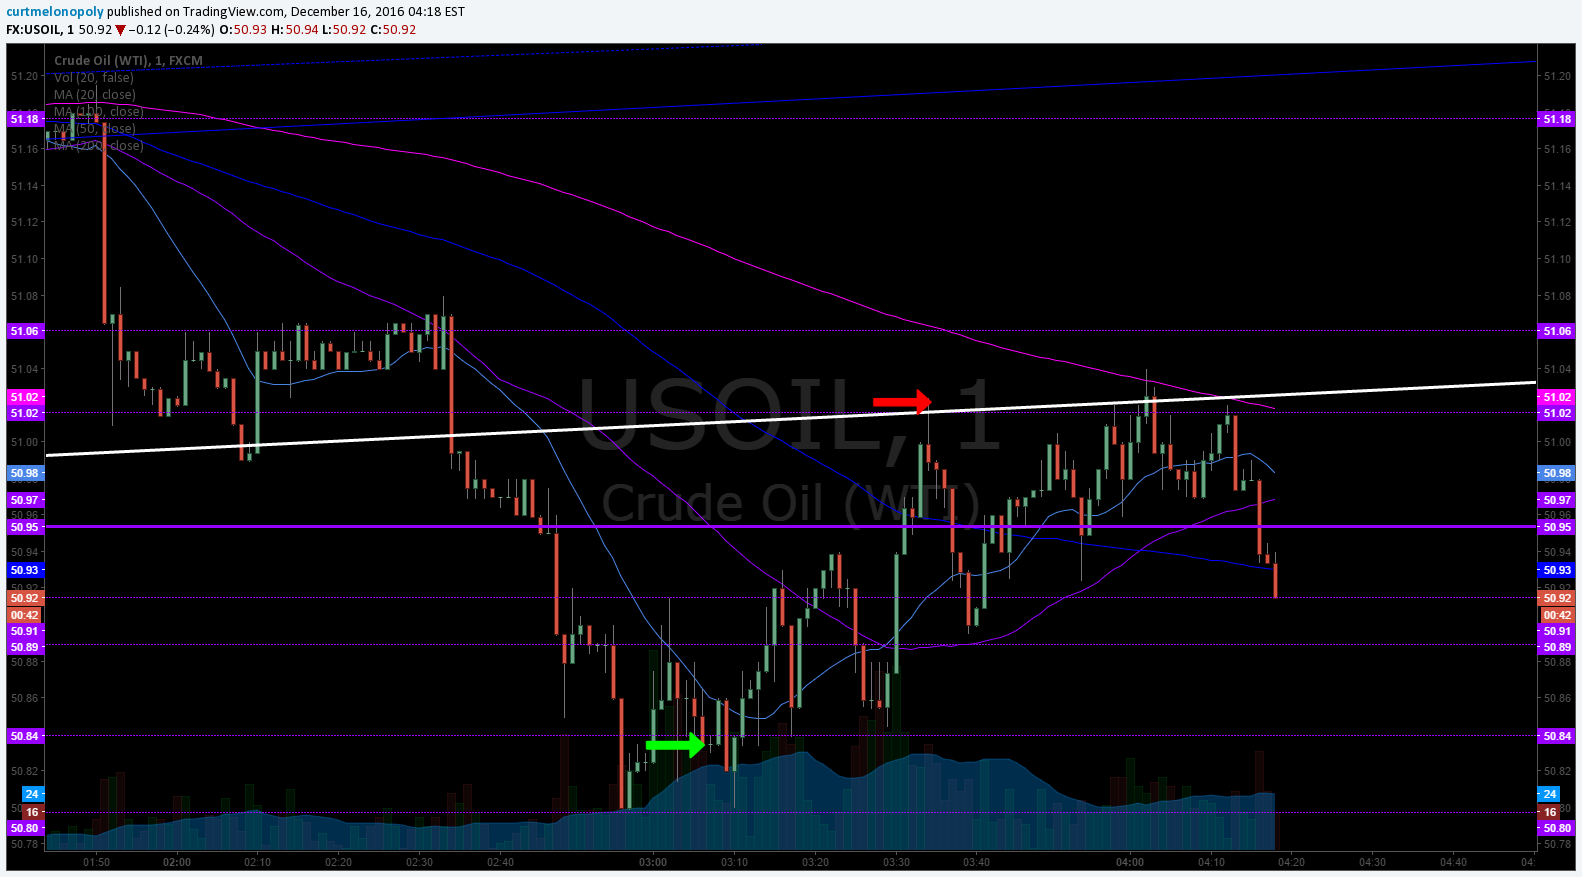
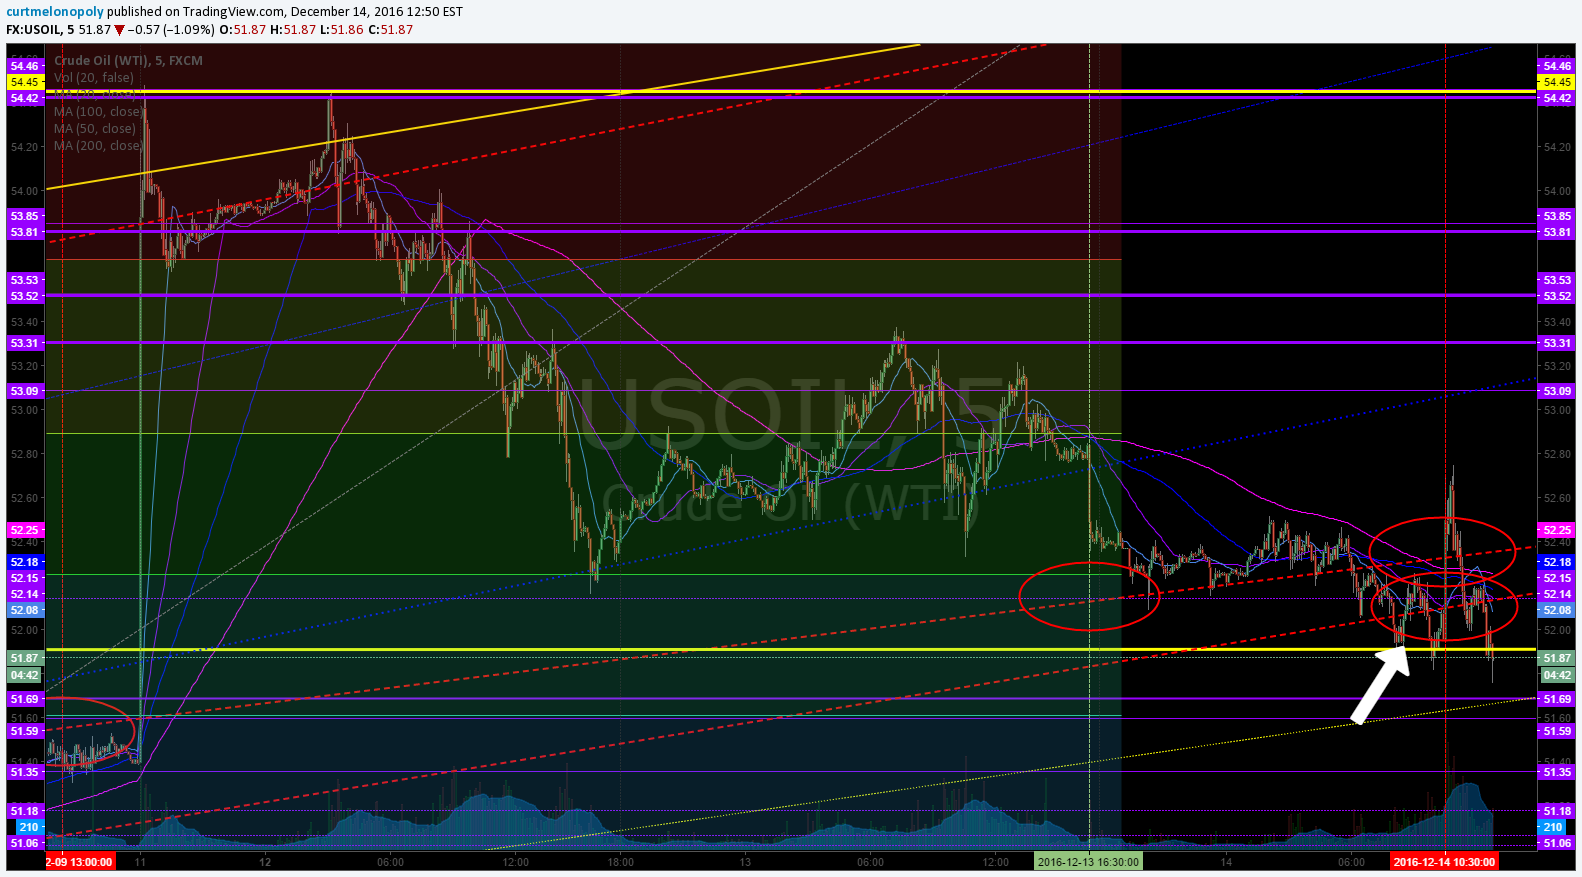
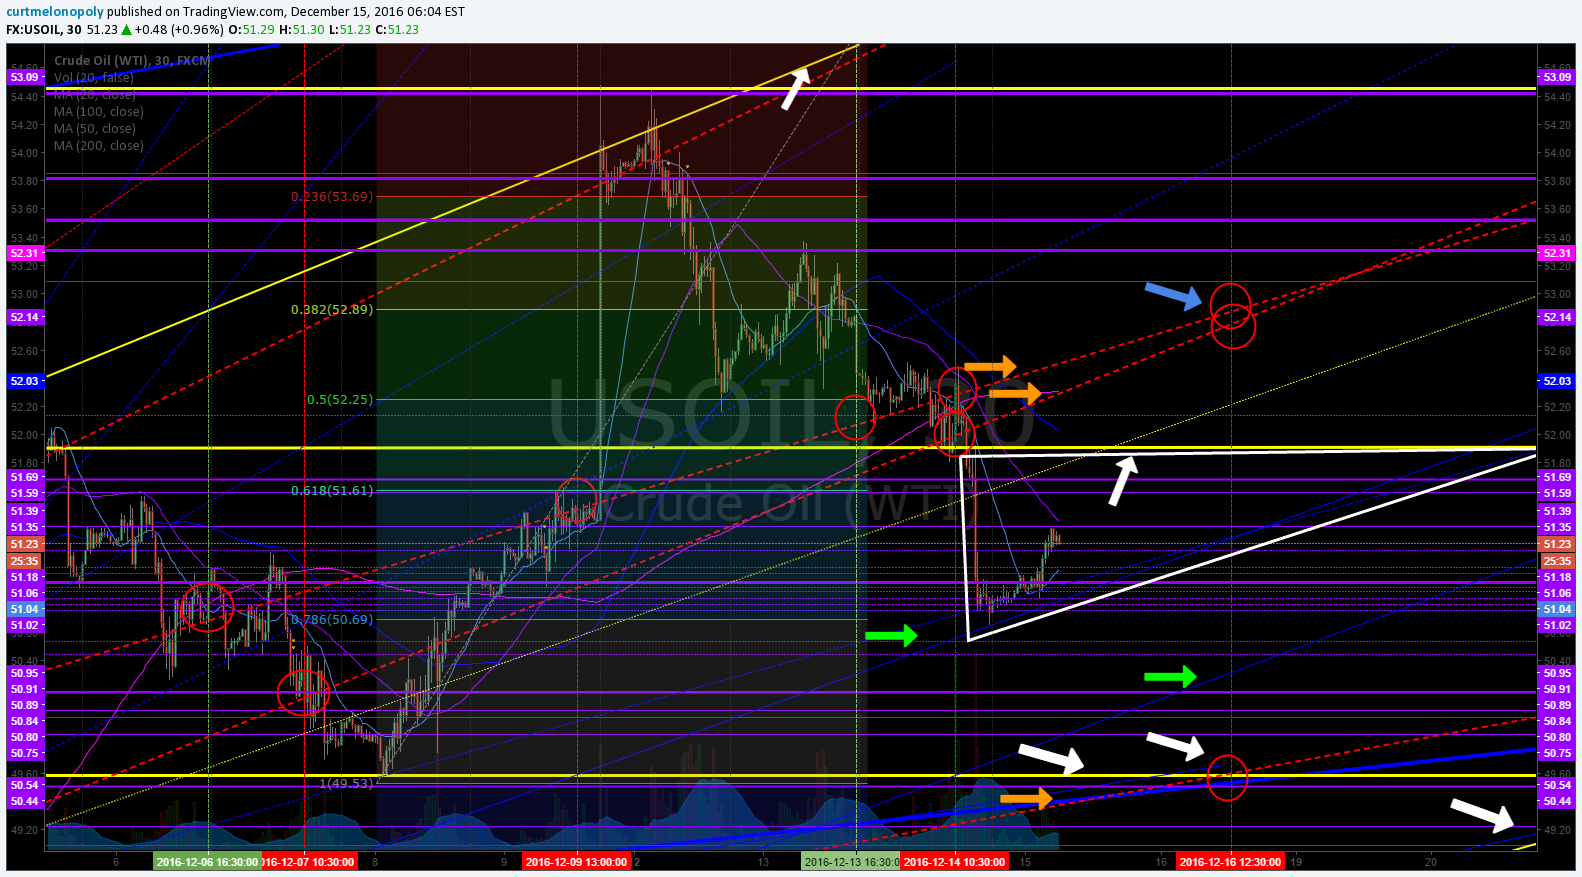
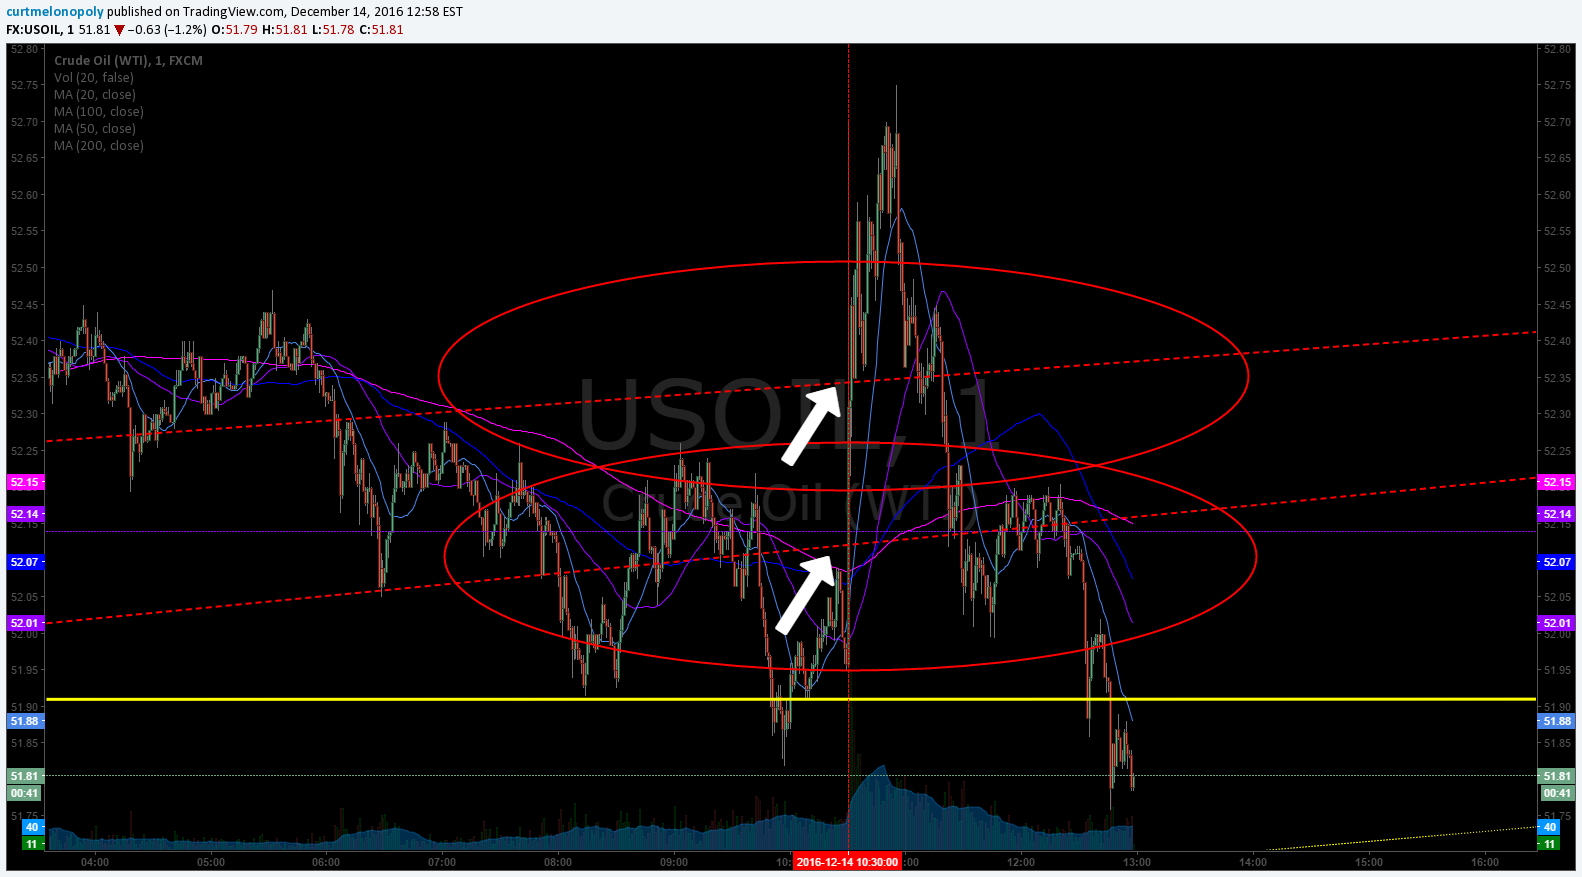
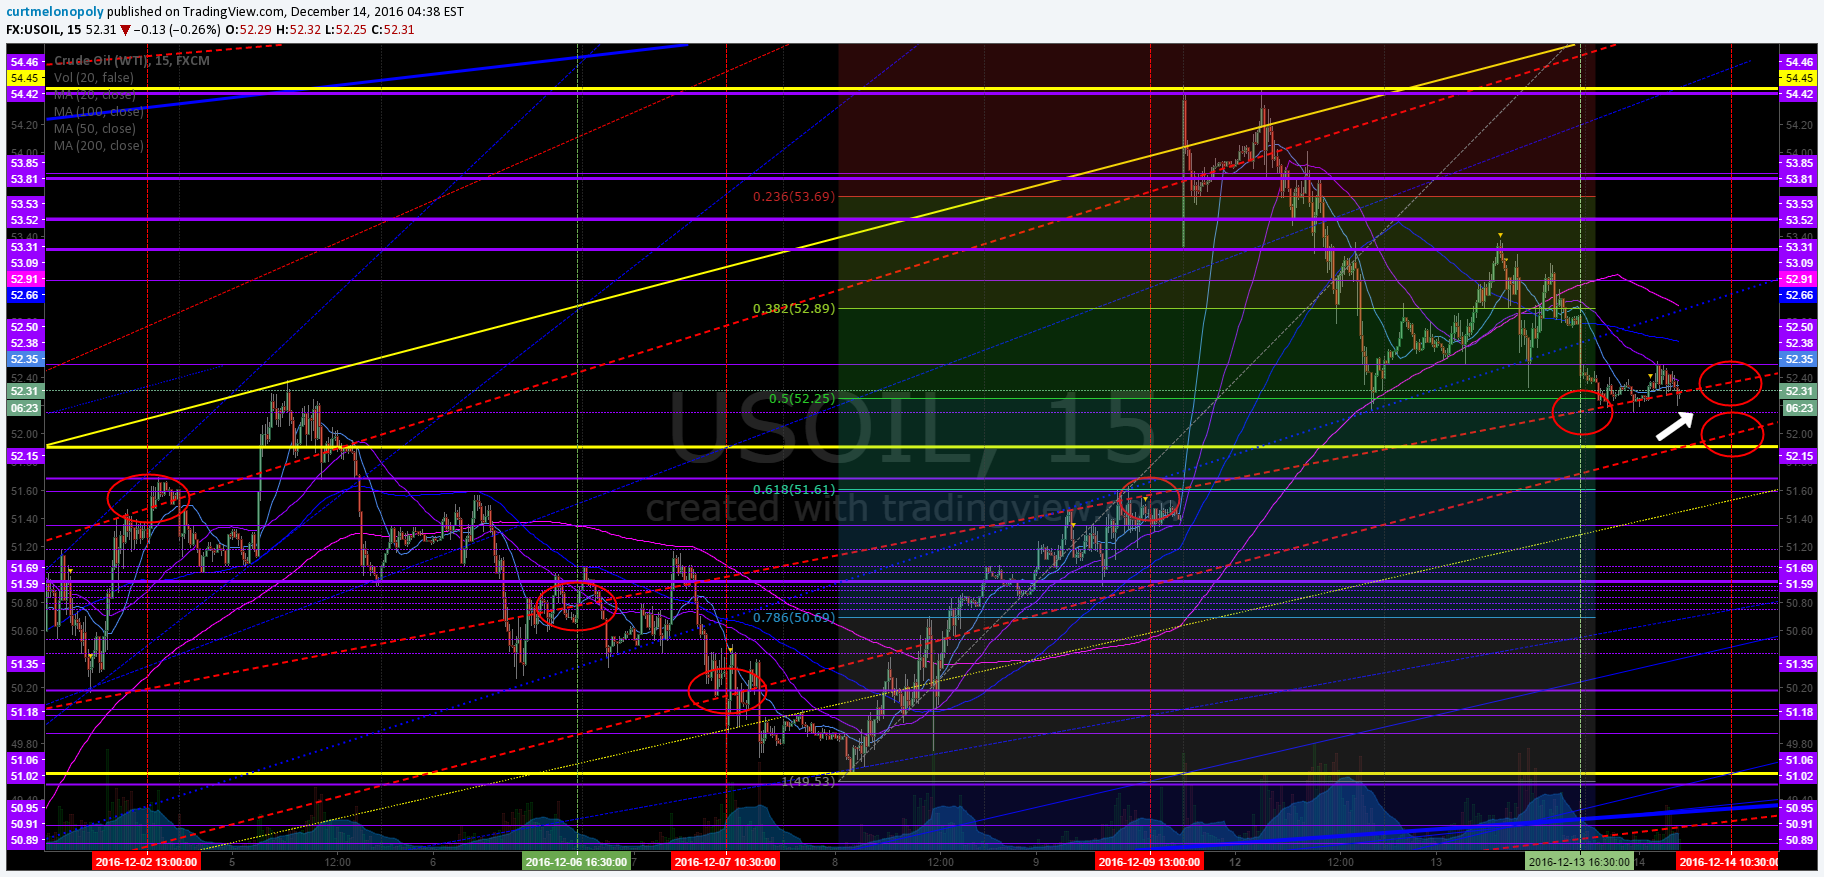
Crude Oil FX : $USOIL $WTI ($UWTI, $DWTI, $GUSH, $ERX, $DRIP, $ERY, $USO, $UCO, $SCO, $UWT, $DWT, $CL_F)
We had a crazy set-up and trade execution in the room yesterday that I am hoping I get time to do a video on this weekend! Chart with entry and exit points is below.
Outlook:
Tuesday algo target at 4:30 hit and Wednesday 10:30 AM both targets hit to the cent and second. We are looking toward Friday target now.
Trading Plan: I am in here on three entries – deep. Friday targets are above and below so this is a tough place.
Other Equities I like for Oil or Energy Trade: Tape / Chart – $ETE, $RIG. High Short Interest – $CRC, $EPE, $WLL, $RES, $JONE, $AREX, $REN, $CLR, $HP, $ATW, $SGY. Fundamentals: $EOG, Pipelines – $XLE: $HEP, $SXE, $KMI, $DPM, $TGS, $ENB, $EEP, $PTRC, $HGT

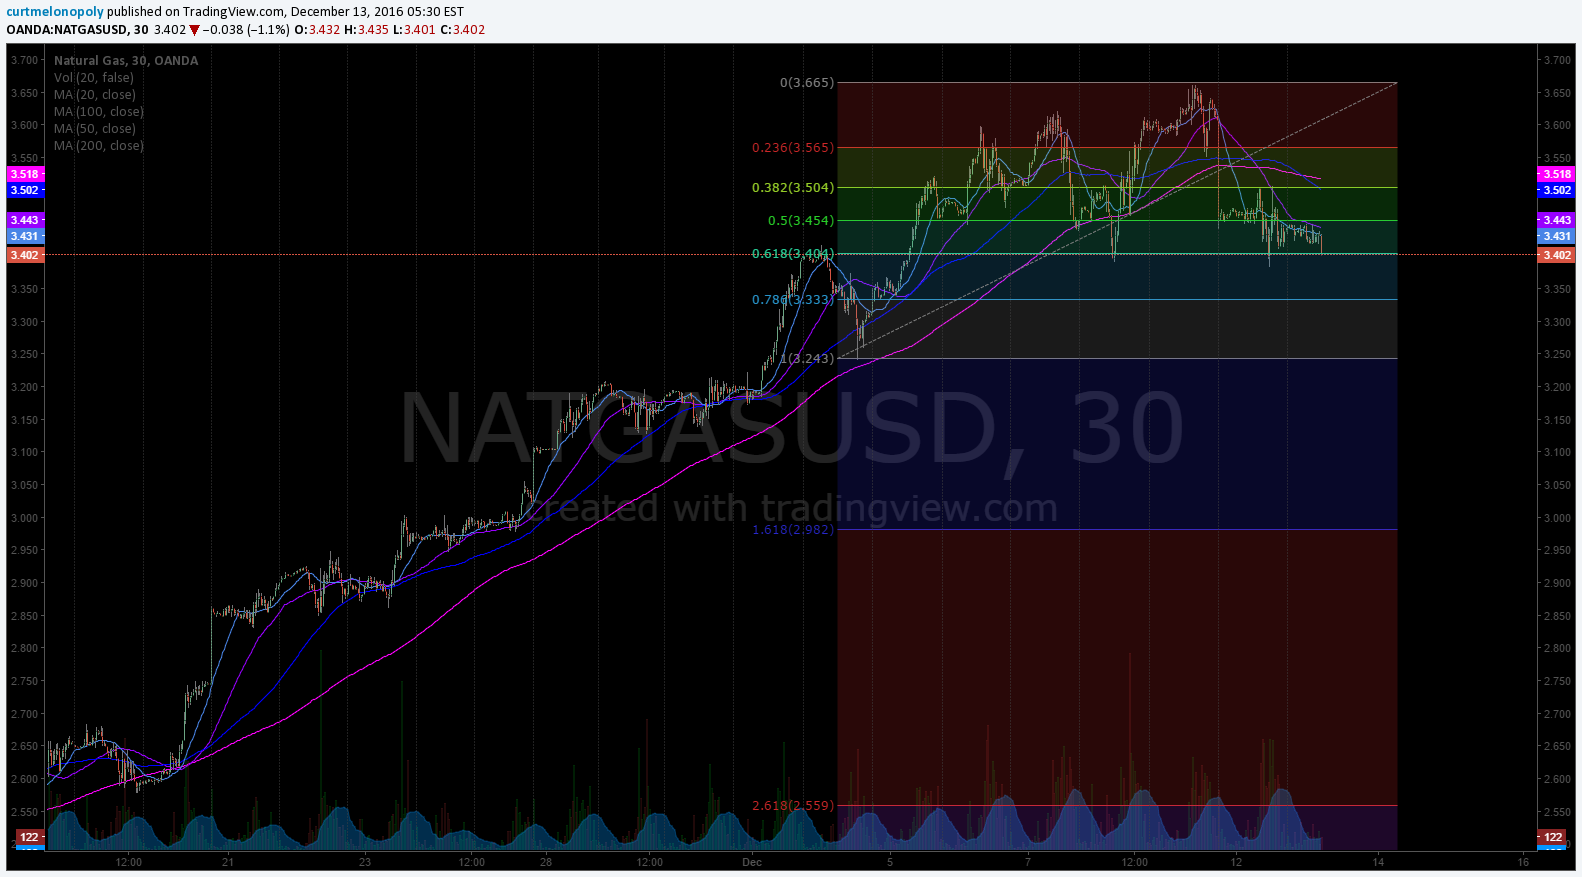
Natural Gas $NG_F $NATGAS ($UGAZ, $DGAZ):
Per yesterday:
Hit resistance as I thought and alerted.
Natural Gas hit heavy resistance, came off, now at a Fibonacci support. $NG_F $UGAZ $DGAZ
ON WATCH!!! This could get a considerable pop in to late Wednesday and even as far as in to late Monday next week is possible!!!
Natural gas lost that Fib support yesterday so now I am watching lower supports. I still think there is a possibility for a pop just after Fed speak!
ON CLOSE WATCH!
Study:
Now that a number of blog posts are being unlocked, it wouldn’t be a bad idea for traders to review them (especially new traders).
If you are trading relying on our charting or algorithms as trade indicators you should read this recent article,
Free scanners to find momentum stocks that you can easily review charts of for indicators that bring probability of your trade being successful up considerably. These are not useful for first 30 minute market open gap and go type plays (you need a good momentum scanner, level 2, and best to have hot-keys for the first 30 mins of gap and go trading)… but are very useful for intra day scalping (start with trending stocks and then look at indicators intra for simple set-ups – study scan study scan study scan).
http://finviz.com/
https://finance.yahoo.com/screener/predefined/ec5bebb9-b7b2-4474-9e5c-3e258b61cbe6
http://www.highshortinterest.com/
http://www.gurufocus.com/short-stocks.php
http://www.3xetf.com/all/
http://www.etf.com/channels/gold-etfs
GL!
Curtis
Article Topics: $EVOK, $SHIP, $ESEA, $DCIX, $TIG, Stockmarket, Pre-Market, Trading Plan, Wall Street, Stocks, Day-trading, Watchlist, Chatroom, Small Cap Oil, $CBMX, $JUNO, $GOLD, $SILVER, $USD/JPY, $USOIL $WTI, $VIX, $SPY, $NATGAS, $DWT, $UWT, $SLV, $GLD, $DXY