Skip to content

Compound Trading Group

  • About
  • White Paper
  • Returns
  • News
    • NOTICE of Online Information Meetings
  • Order
    • Terms
  • About
  • White Paper
  • Returns
  • News
    • NOTICE of Online Information Meetings
  • Order
    • Terms

Yearly Archives: 2018

  1.   »  
  2. Yearly Archives: 2018

Year: 2018

Trading Facebook (FB) Earnings Part 2 – Opportunity Knocks (Member Edition) $FB #trading #earnings

Trading Facebook (FB) Earnings Part 2 – Opportunity Knocks (Member Edition) $FB #trading #earnings

July 28, 2018October 4, 2018 Swing TraderSwing Trading$FB, Charting, Daytrade, earnings, FaceBook, Plan, Swing, Trading

How to Trade Facebook (FB) Earnings. Monday Trade in Facebook – Stock $STUDY Preparation. Technical Charting for Swing Trading and Day Trading. Member Edition of Report.

Trading Plan for Facebook, Inc. (FB), July 28 2018.

Monday I expect a big day for Facebook trade post earnings. What a fantastic opportunity to see some great day trading returns and possibly swing trade Facebook with large sizing.

In this follow-up report to the one published last week (Trading Facebook (FB) Earnings Wash-out on Revenue Growth Warning) are follow-up technical charting details for trading Facebook. The technical charts below will assist you on short time frame daytrading premarket and and market open and for entries toward swing trading possibilities.

If you are unaware of what occurred last week with Facebook earnings, this article explains: 

Facebook has the WORST day in Wall Street history as shares plunge 19% and $119 billion is wiped off company’s value, as analyst predicts more misery to come for the social media giant.

As mentioned in part one of this special report;

The last time we traded a Facebook wash-out the trade was one of our biggest winners of 2018 (thus far). We nailed the bottom of the sell-off and we followed the trade through as it gained upside until today. We have been out of the trade for a few weeks now in anticipation for today’s earnings announcement.

Below is one of many alerts issued to members in the last Facebook sell-off, we were in nice and early and banked considerably as a result:

$FB Facebook long side trade from 153.40 Mar 28 buy side trigger now testing buy sell trigger 167.51. See chart notes. #swingtrading

https://twitter.com/SwingAlerts_CT/status/984194323192266752

FB, long side, trade alert
$FB Facebook long side trade 153.40 Mar 28 buy side trigger testing buy sell trigger 167.51. See chart notes. #swingtrading

You can find the April 11, 2018 Facebook trade article from our blog here:

$FB Facebook Long Set-Up Testing Buy Sell Trigger #swingtrading (Public Edition)

Facebook Trading Plan:

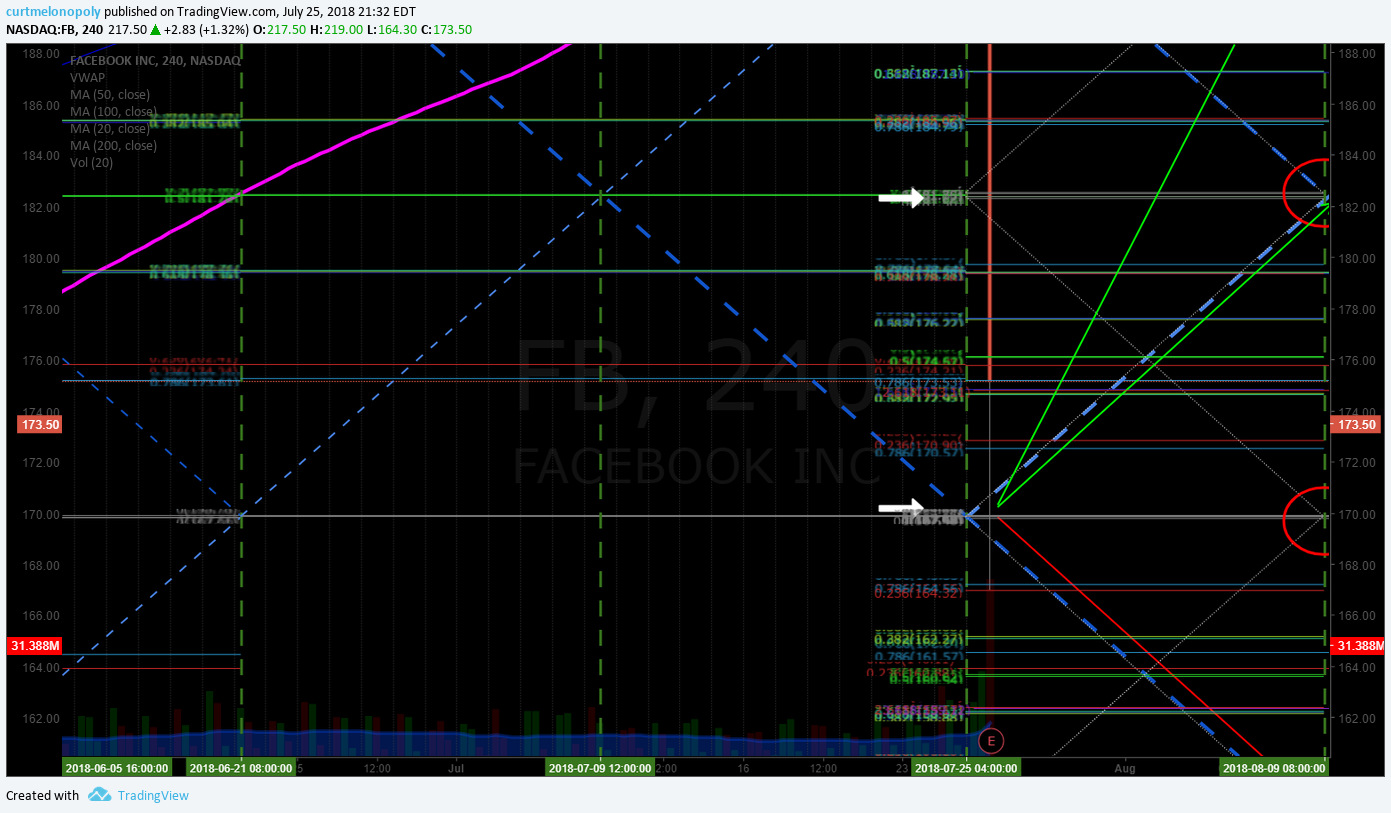
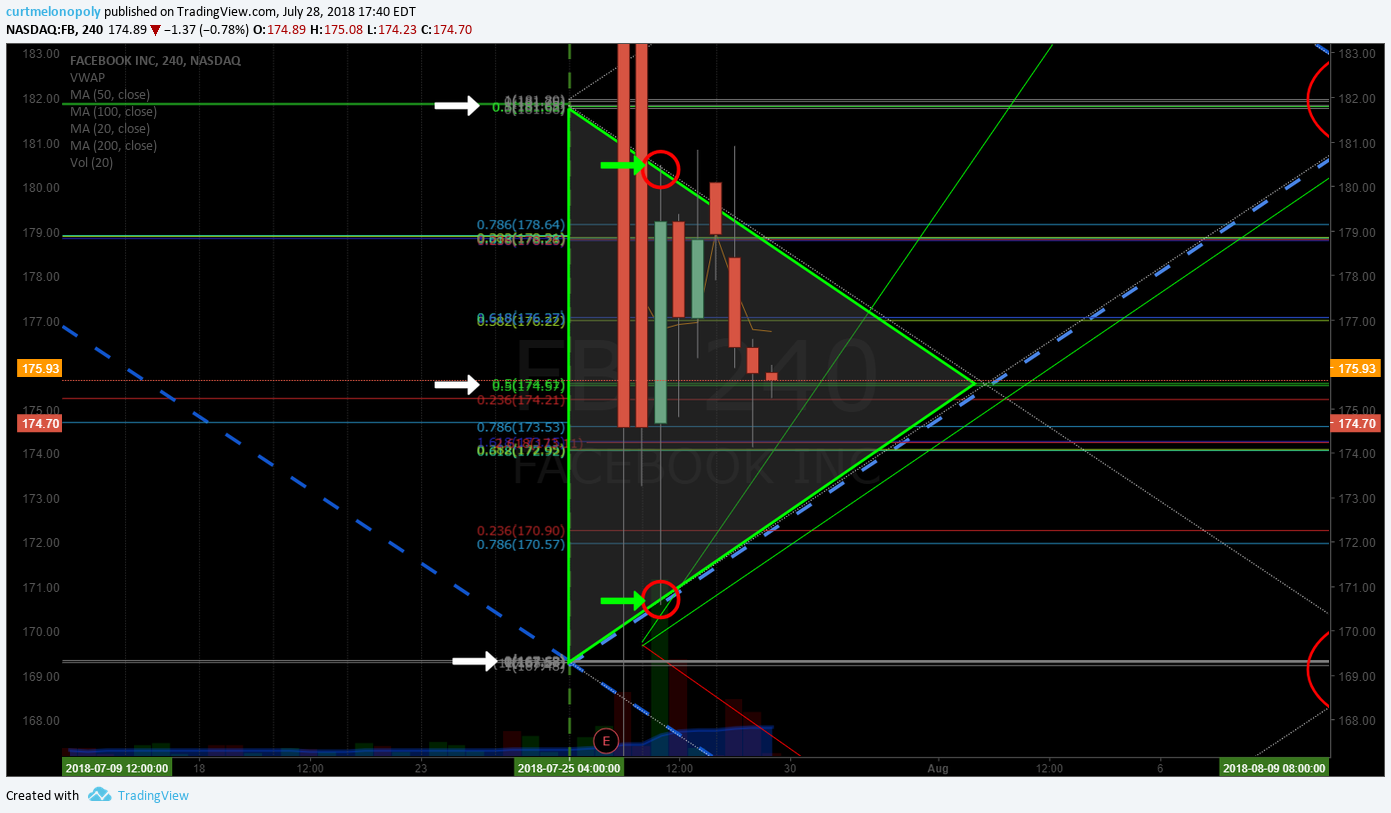
Facebook (FB) “On the Fly” Charting Model – Daytrading Chart with buy sell triggers for Monday. $FB #facebook #chart

Member version of this report is distributed in real-time (not delayed) and includes (in addition to a static chart) a link below to a live interactive Facebook daytrading chart on Trading View (with all technical levels).

Buy / sell triggers on the short time frame per chart (intended for short term day-trading):

153.51

160.59

167.61

174.60

181.60

188.79

FACEBOOK (FB) Closed Friday just above 50% Fibonacci retrace pivot in trading structure alerted to members $FB #swingtrade #daytrade

My trading plan includes watching the Fibonacci retrace pivot noted at 174.60. Trade above is a long to diagonal down slope trendline that trade used as resistance last week. I won’t likely be shorting as the sell-off likely has the stock in an over-sold position (to be determined).

If trade loses the pivot then I will be looking to the lower uptrending Fibonacci trendline (bottom of quad) for long positions and then trimming (as above) at Fibonacci downtrending diagonal quad wall.

For ease the chart has the lines highlighted in green. When trade moves to the next part of the trading structure I will trade the next structure in a similar manner.

The time price targets are on the chart as red circles and are always at the main buy sell trigger points at the mid quad, top of quad, and lower quad. Trade the FB stock in the direction of trend in the trading structure toward the price targets (date for each price target is listed at the bottom of the chart).

I will be trading FB in premarket Monday and the live trading room will be open. I will also send alerts to our Swing Trading and Day Trading alert feeds as possible as trade develops.

https://www.tradingview.com/chart/FB/3wIcsWtp-FACEBOOK-FB-Closed-Friday-just-above-50-Fibonacci-retrace-piv/

Facebook, trading, plan, swing, day trading, chart, earnings
FACEBOOK (FB) Closed Friday just above 50% Fibonacci retrace pivot in trading structure alerted to members $FB #swingtrade #daytrade

If you have any questions about this special Facebook trading report message me anytime. If you do not know how to take advantage of algorithmic structured trading charts please consider basic trade coaching of at least 3 hours to get on the winning side of your trading – you will find details here.

Cheers!

Curt

Temporary Promo Discounts (for new members only).

Subscribe to Weekly Swing Trading Newsletter service here Reg 119.00. Promo Price 83.30 (30% off). Promo Code “30P”. 

Or Real-Time Swing Trading Alerts Reg 99.00. Promo Price 69.37 (30% off). Promo Code “Deal30”.

I personally guarantee our swing trading service is one of the best in the business and it’s very reasonably priced considering the technical expertise invested in the platform (Lead Trader).

Subscribe to Swing Trading Service:

Swing Trading Bundle (Swing Trading Newsletter and Live Swing Trading Alerts).

Swing Trading Newsletter (Weekly Newsletter Published for Traders).

Real-Time Swing Trading Alerts (Private Member only Twitter Feed).

One-on-One Trade Coaching (Via Skype or In-Person).

Free Mailing List(s):

Join Email List for Free Trade Charting Trade Set-ups, Deals, Podcasts and Public Webinars.

Free Swing Trading Periodical Contact Form (Complimentary Swing Trade Set-Ups to Email)

Public Chat:

Visit our Free Public Chat Room on Discord.

Follow Me:

Tweets by swingtrading_ct

Read More
PreMarket Trading Plan Thurs July 26: Earnings, $FB, $AGN, OIL, $WTI, GOLD, Crypto, $BTC , US Dollar, $DXY more.

PreMarket Trading Plan Thurs July 26: Earnings, $FB, $AGN, OIL, $WTI, GOLD, Crypto, $BTC , US Dollar, $DXY more.

July 26, 2018July 28, 2018 Curt MelonopolyTrading Plan$AGN, $BTC, $FB, $WTI, Crypto, DXY, earnings, Gold, Oil, Plan, Premarket, Stocks, Trading, US Dollar, Watchlist

Compound Trading Premarket Trading Plan & Watch List Thursday July 26, 2018. 

In this edition: Earnings, $FB, $AGN, OIL, $WTI, GOLD, Crypto, $BTC , US Dollar, $DXY and more.

Welcome to the morning Wall Street trading day session at Compound Trading.

Notices:

Notes in red text in this report are more recently important.

July 24 Member Memo: Trade Coaching Boot Camp Prep, Machine Trading, Next Gen Models, Trade Alerts, Reporting, Swing Trading Earnings

Scheduled Events:

  • Thursday July 26 – Live Trading Room with lead trader and/or other team members as follows and as available (constant change in the markets);
    • 9:25 Market Open – access limited to live trading room members
    • 12:00 Mid Day Trade Review – access limited to live trading room members
      • Any other live trading sessions will be notified by email.
      • The above listed times are expected live trading time blocks only. Live voice broadcast will only occur if there is a trade set-up to discuss by the lead trader. Screen sharing will be active through-out each time frame.
      • Link: https://compoundtrading1.clickmeeting.com/livetrading
      • Password: **** (email for access if you do not have it, password changes will be emailed when changed only)
      • For membership access, options here: https://compoundtrading.com/overview-features/
      • Any questions send me an email info@compoundtrading.com
  • July 25-27 – Weekly newsletter reporting and invoicing distributed to members (delayed this week due to next gen algorithms being integrated in to our trading platforms).
  • July 23-July 31 – Swing trading reports to include video chart analysis recaps for the 100 equities we cover (from mid day swing trading reviews) and sent to our subscribers daily in lieu of the weekly swing trading report (mailing list subscribers receive a complimentary version without algorithmic charting).
  • End of July – Next generation algorithm models roll out in to August 14, 2018 (machine trading Gen 1).
  • End of July – New pricing structure published representing next generation algorithm models (existing members no change).
  • End of July – Trading Profit and Loss Published for Q1 and Q2 2018 (a report detailing trading / alert performance of our team).
  • July 28 – 29, Santo Domingo – #IA Intelligent Assisted Platform (private, internship & staff training / development).
  • Aug 25 – 26, Santo Domingo – Oil Algorithm (EPIC) Multi-User License Trade Execution & Integration (private invitational, institutional).
  • Sept 14 – 16, Cabarete – Trade Coaching Event – Learn How to Trade or Take Your Trading to the Next Level (public, retail).

Machine Trading Coding Team Mandate: In current development and roll-out (1) Intelligent Assisted #IA Trading Platform (Code Algorithm Models), (2) Run 24 Hour Crypto Trading Desk, (3) Alert Trade Set-ups to Member Alert Feeds (for all models) and near future (4) Machine Learning. 

Premarket Report: On lead trader availability basis only (the premarket reports are not published every market day).

Private Member Discord Server Chat Rooms: BE SURE to get in to each private Discord server specific to your specific subscription type (bundles) – many of the updates as we go forward will be posted in there and detailed trading plans for alerted trades are often discussed by our lead trader in the rooms. This includes the SWING TRADING platform also. IF YOU NEED A LINK / INVITE email us.

https://twitter.com/CompoundTrading/status/880670140454637569

Real-time Trade Alerts:

Real-time Trade Alerts for Oil, Swing Trading, Day Trading, Bitcoin are available to subscribers by following specific alert Twitter feeds. Oil Trading Alerts, Swing Trading Alerts, Day Trading Alerts, Bitcoin Trading Alerts.

Disclaimer / Disclosure:

Subscribers must read disclaimer.

Recent Blog / Video / Social Posts: 

#BitcoinTrading 101: A Beginner’s Guide to Getting Started $BTCUSD $XBTUSD $BTC https://compoundtrading.com/bitcointrading-101-beginners-guide-getting-started-btcusd-xbtusd-btc/ …

https://twitter.com/CompoundTrading/status/927397024315662336

How to Use EPIC Oil Algorithm: $USOIL, $WTI, $CL_F, $USO, $UCO, $SCO, $UWT, $DWT, #OIL, #OOTT: http://youtu.be/hawVV31G9bg?a via @YouTube

https://twitter.com/CompoundTrading/status/889148655785177088

How to Use ROSIE Gold Algorithm: #GOLD, $GLD, $XAUUSD, $GDX, $GDXJ, $NUGT, $DUST, $JNUG, $JDST

https://twitter.com/CompoundTrading/status/889147527278333952

Recent Chart / Trade Set-Ups: 

See You Tube for other recent video posts. Listed from most recent.

Password: selloff Protected: Trading Facebook (FB) Earnings Wash-out on Revenue Growth Warning (Member Edition) $FB #trading

Password: AR, Protected: Swing Trading Report (Members): Earnings Season Charting July 24 $RIOT, $CELG, $ARWR, $EXTR, $EDIT, $SOHU, $ESPR, $LPSN, $XOMA …

Password: WOW, Protected: Swing Trading Report (Members): Earnings Season Charting July 24 $SPY, OIL, $VIX, $DXY, $GOOGL, $HCLP, $ARRY, $ARWR, $CDNA, $XXII, $SSW

Unlisted Private Member Video – Swing Trading Special Report $CELG, $RIOT, $ARWR, $EXTR, $EDIT, $MBRX, $SOHU, $ESPR, $LPSN, $XOMA.

Unlisted Private Member Video – Swing Trading Special Report $SPY, OIL, $VIX, $DXY, $GOOGL, $HCLP, $ARRY, $ARWR, $CDNA, $XXII, $SSW

Unlisted Private Member Video – Swing Trading Set-ups Special Report; $VIX, $DXY, $SPY, $DIS, $RCL, $RKDA, $SQ, $HEAR, $TGTX, $SMIT

Password: DOL Protected: Swing Trading Report (Earnings Season Special Report) July 19: $VIX, $DXY, $SPY, $DIS, $RCL, $RKDA, $SQ, $HEAR, $TGTX, $SMIT and more.

“The Nut Hand” Today’s Huge Oil Trade Win. Exactly How It Was Done. How I Knew & How You Can Too.

How to Swing Trade Like the Pros and Win Most Trades. #swingtrading #freedomtraders

Password: IC Protected: How to Trade Allergan (AGN) Stock Move (Exclusive) $AGN #swingtrading #daytrading #chart

FITBIT INC CLASS A (NYSE: FIT). How to Trade FitBit for 40% Gain (Member Exclusive) $FIT #swingtrading #daytrading #chart

Password: TRADEAAPL Protected: Trading Apple’s Stock Move (Member Exclusive) $AAPL #swingtrading

Password: SWINGDXY, Protected: Trading US Dollar Index (Part 2 – Member Exclusive) $DXY $UUP #USD #SwingTrading #Daytrading

Password: swing Protected: Trade Set-Ups w/ Video #EIA, Oil, $TSLA, $NFLX, $ESPR, $PG, $AAPL, $SPY, $CARA, $EGY, $GERN, $BPT more. #swingtrading

CRITICAL Oil Trade. Weekly Timing. EPIC Oil Algorithm Channel $USOIL $WTI $CL_F $USO #OilTrading #EIA

Feature Post with Charting: How to Trade the US Dollar Index Move (Part 1) $DXY $UUP #USD #trading #chart #algorithm https://compoundtrading.com/feature-post-with-charting-how-to-trade-the-us-dollar-index-move-part-1-dxy-uup-usd-trading-chart-algorithm/

Charts, Video and Summary of Swing Trade Set-ups May 21, 2018 $PSTG, $ITCI, $AAPL, $SPY, $NFLX, $PG, $BOXL, $TRXC more.

Feature Post: 12 of Last 13 Oil Chart Time-Cycles Have Trend Reversal. $USOIL $WTI $CL_F $USO $UCO $UWT $DWT #OIL #OOTT

Password: SET Protected: Swing Trade Set-Ups (May 15/16 Member Edition) $WTI, #OIL, $BTC, Bitcoin, $AMBA, $AMD, $BLNK, $ITCI,, $SPY, $DIS, $LAC, $BOX, $AAOI more.

Password: AI Protected: How to Trade Pure Storage Earnings in Six Days (Member Edition) $PSTG

Recent Educational Articles / Videos:

I get a lot of Q’s on How to Trade our models, this vid has 5 min explanation at 1:00 min-6:00 min. https://www.youtube.com/watch?v=QrXbE7lojAg&t=3s … – Fib Trendlines, Trading structure/quads, Price targets, Main support resistance (buy sell triggers), Time cycles, Moving averages, Trading trims/adds.

I get a lot of Q's on How to Trade our models, this vid has 5 min explanation at 1:00 min-6:00 min. https://t.co/oqezvVcn0y … – Fib Trendlines, Trading structure/quads, Price targets, Main support resistance (buy sell triggers), Time cycles, Moving averages, Trading trims/adds.

— Melonopoly (@curtmelonopoly) May 13, 2018

Trading Plan (Buy, Hold, Sell) Watch Lists. Morning Momentum / Gap / News / PR / IPO / SEC Filings / Earnings Stocks on Watch: 

Stocks making the biggest moves premarket: CMCSA, LUV, FB, QCOM & more –

Stocks making the biggest moves premarket: CMCSA, LUV, FB, QCOM & more – https://t.co/Txh5AkjgVD

— Melonopoly (@curtmelonopoly) July 26, 2018

Market Observation:

Markets as of 8:14 AM: US Dollar $DXY trading 94.23, Oil FX $USOIL ($WTI) trading 689.23, Gold $GLD trading 1228.14, Silver $SLV trading 15.52, $SPY 283.34, Bitcoin $BTC.X $BTCUSD $XBTUSD 8210.00 and $VIX trading 12.3.

Momentum Stocks to Watch:  $SVU $BPI $ARNC $XLNX

News: 

$AGN Allergan’s stock set to rally after earnings beat and raise, new stock repurchase program

https://twitter.com/CompoundTrading/status/1022447396003958786

$DPW DPW Holdings’ Enertec Systems awarded $4.3M contract

Recent SEC Filings:

Insider Buys Of The Week: BlackRock, Dish Network, Walgreens https://benzinga.com/z/12054592 $BLK $DISH $WBA

Recent IPO’s:

IPOs expected to price/trade today*:

– Aurora Mobile $JG
– Berry Petroleum $BRY
– Cango $CANG
– Focus Financial Partners $FOCS
– Liquidia Technologies $LQDA
– Pinduoduo $PDD
– Tenable Holdings $TENB

Your Thursday morning Wake Up Call:

IPOs expected to price/trade today*:

– Aurora Mobile $JG
– Berry Petroleum $BRY
– Cango $CANG
– Focus Financial Partners $FOCS
– Liquidia Technologies $LQDA
– Pinduoduo $PDD
– Tenable Holdings $TENB

*subject to change

— Benzinga (@Benzinga) July 26, 2018

Biotech Allakos prices IPO at $18, above price range

$RUBY 10.3M shares at $23 and $CRNX 6m shares at $17

$CRNX Crinetics Pharmaceuticals prices IPO at $17 a share

The IPO Outlook For The Week: Tech & International Exposure https://benzinga.com/z/12052697 $AQST $BE $BRY $JG $CANG $FOCS $PDD $TENB $DAVA $OPRA

The IPO Outlook For The Week: Tech & International Exposure https://t.co/A0rfpmunIn $AQST $BE $BRY $JG $CANG $FOCS $PDD $TENB $DAVA $OPRA https://t.co/Hrc0OwWq24

— Melonopoly (@curtmelonopoly) July 22, 2018

Earnings: 

Mastercard stock falls after company reports in-line revenue, earnings beat

McDonald’s earnings and sales beat estimates

Bristol-Myers shares lift on Q2 profit, revenue beats

Xerox misses profit expectations but beats on revenue, sets $1 billion buyback plan

Raytheon shares rise after Q2 profit, revenue beats

StockTwits Earnings to Watch

Tue – $T $VZ $LMT $JBLU $BIIB $IRBT $MMM $LLY $TXN

Wed – $FB $AMD $F $GILD $PYPL $V $BA $HM $KO $ABX

Thu – $AMZN $INTC $SBUX $CMG $FSRL $SPOT $MCD

Fri – $TWTR $XOM $ABBV $CVX

Via @StockTwits

#earnings for the week

$AMZN $AMD $FB $TWTR $GOOGL $BA $T $V $INTC $LRCX $HAL $LMT $PYPL $MA $VZ $MMM $CELG $MCD $HAS $F $ABBV $XOM $SBUX $BIIB $KO $AAL $PETS $ALGN $CMG $GRUB $RTN $UAA $GILD $NTGR $UTX $HOG $WDC $AMTD $NOK $DGX $UPS $JBLU $GM $CVX

http://eps.sh/cal

#earnings for the week$AMZN $AMD $FB $TWTR $GOOGL $BA $T $V $INTC $LRCX $HAL $LMT $PYPL $MA $VZ $MMM $CELG $MCD $HAS $F $ABBV $XOM $SBUX $BIIB $KO $AAL $PETS $ALGN $CMG $GRUB $RTN $UAA $GILD $NTGR $UTX $HOG $WDC $AMTD $NOK $DGX $UPS $JBLU $GM $CVX https://t.co/r57QUKKDXL https://t.co/rFjdIyBH0d

— Melonopoly (@curtmelonopoly) July 22, 2018

Trade Set-up Alerts, Charts & Reports. Recent / Current Holds, Open and Closed Trades:

Please refer to the date at top left of each chart (charts are often carried forward for sometime).

FACEBOOK (FB) Trading Facebook wash-out on earnings. Trading levels for daytrading and swingtrading. $FB #daytrade #swingtrade #chart

FB, daytrading, swingtrading, chart, technical, trading
FACEBOOK (FB) Trading Facebook wash-out on earnings. Trading levels for daytrading and swingtrading. $FB #daytrade #swingtrade #chart

Scalp to start the day. EPIC the Oil Algorithm $USOIL $WTI $USO #Oil #trading

Scalp to start the day. EPIC the Oil Algorithm $USOIL $WTI $USO #Oil #trading pic.twitter.com/4foUVxkv3z

— Melonopoly (@curtmelonopoly) July 26, 2018

100% personal alerted oil trade win rate documented, recorded, alerted real time to feed continues for months (we did have one loss alert by a tech a few weeks back). EPIC the Oil Algorithm FX $USOIL $WTI $USO $UWT $DWT #OIl #OOTT #Trading @EPICtheAlgo

100% personal alerted oil trade win rate documented, recorded, alerted real time to feed continues for months (we did have one loss alert by a tech a few weeks back). EPIC the Oil Algorithm FX $USOIL $WTI $USO $UWT $DWT #OIl #OOTT #Trading @EPICtheAlgo pic.twitter.com/pKL1iKE5T1

— Melonopoly (@curtmelonopoly) July 25, 2018

The $RIOT daytrade from yesterday went well: 7.30s – 8.40s nice mover and returns.

Working well #daytrading #towin $RIOT #blockchain pic.twitter.com/CyaVAM35UB

— Melonopoly (@curtmelonopoly) July 24, 2018

Arrow Pharmaceuticals (ARWR) Over mid quad resistance. Long side bullish bias. $ARWR #swingtrading #earnings

$ARWR, earnings, swing trading, chart
Arrow Pharmaceuticals (ARWR) Over mid quad resistance. Long side bullish bias. $ARWR #swingtrading #earnings

ALPHABET (GOOGLE) Trading over main resistance pivot 1211.60 intra 1262.34 on earnings 1318.52 price target. $GOOGL #swingtrading

$GOOGL, ALPHABET, stock, chart, swingtrading, earnings
ALPHABET (GOOGLE) Trading over main resistance pivot 1211.60 intra 1262.34 on earnings 1318.52 price target. $GOOGL #swingtrading

ARROWHEAD Pharna (ARWR) Took first long side entry today on swing trade over mid quad pivot $ARWR

$ARWR, swing trade, alert, chart
ARROWHEAD Pharna (ARWR) Took first long side entry today on swing trade over mid quad pivot $ARWR

EDITAS MEDICINE (EDIT) Keeps hitting mid channel targets on chart testing 200 MA $EDIT #pricetargets #chart

$EDIT, swing, chart, trade, symmetry
EDITAS MEDICINE (EDIT) Keeps hitting mid channel targets on chart testing 200 MA $EDIT #pricetargets #chart

Celgene (CELG) trading 86.81 with earnings in one day at quad wall resistance over mid quad support $CELG

CELG, chart
Celgene (CELG) trading 86.81 with earnings in one day at quad wall resistance over mid quad support $CELG

RIOT BLOCKCHAIN (RIOT) over 200 MA on 240 Min chart closed 8.40 with trade entries 7.30s today. #trading $RIOT

$RIOT, blockchain, chart trade
RIOT BLOCKCHAIN (RIOT) over 200 MA on 240 Min chart closed 8.40 with trade entries 7.30s today. #trading $RIOT

Goldman warns of liquidity-fueled sell-off after ‘volmageddon’ https://bloom.bg/2v1ggWS

Goldman warns of liquidity-fueled sell-off after ‘volmageddon’ https://t.co/qtnhhrvPmk pic.twitter.com/jWDcwkA9O6

— Bloomberg Markets (@markets) July 24, 2018

MACD still trending down on daily oil chart with price above 100 MA under 20 and 50. #OIL $USOIL $WTI

MACD, Daily, Oil, Chart
MACD still trending down on daily oil chart with price above 100 MA under 20 and 50. #OIL $USOIL $WTI

Bitcoin trading like a conventional equity now. Launched off 50 MA testing 100 MA resistance soon. $BTCUSD $BTC #Bitcoin #premarket https://twitter.com/CryptotheAlgo/status/1019561358600409088

Bitcoin, chart, BTC
Bitcoin trading like a conventional equity now. Launched off 50 MA testing 100 MA resistance soon. $BTCUSD $BTC #Bitcoin #premarket

US Dollar Index (DXY) Chart. Perfect move from structure to structure at resistance now to next possible. $DXY $UUP #USD #swingtrading #dollar

US Dollar, algorithm, chart
US Dollar Index (DXY) Chart. Perfect move from structure to structure at resistance now to next possible. $DXY $UUP #USD #swingtrading #dollar

Gold chart (Daily) MACD may cross up here at previous December low support test. #GOLD #CHART $GC_F $XAUUSD $GLD

Gold, Daily, MACD, Chart
Gold chart (Daily) MACD may cross up here at previous December low support test. #GOLD #CHART $GC_F $XAUUSD $GLD

Gold chart monthly – trade sitting on 50 MA test and under bottom trendline. #Gold #Chart $GLD $XUAUSD $GC_F

Gold, Chart, 50 MA, Support test
Gold chart monthly – trade sitting on 50 MA test and under bottom trendline. #Gold #Chart $GLD $XUAUSD $GC_F

SILVER likely to get a bounce at pivot area to test underside of diagonal trend line #onwatch

SILVER, Weekly, chart
SILVER likely to get a bounce at pivot area to test underside of diagonal trend line #onwatch

ALLERGAN (AGN). Excellent swing trade in progress trading 177s targets 180.21 184.21 189.03 etc. $AGN #chart

AGN, swing trade
ALLERGAN (AGN). Excellent swing trade in progress trading 177s targets 180.21 184.21 189.03 etc. $AGN #chart

NETFLIX (NFLX) Triggering long in premarket over 400.00 targets 412.00 then 422.00 a key range pivot resistance. $NFLX #swingtrading

NFLX, swing, trade, premarket
NETFLIX (NFLX) Triggering long in premarket over 400.00 targets 412.00 then 422.00 a key range pivot resistance. $NFLX #swingtrading

Market Outlook, Market News and Social Bits From Around the Internet:

Your Thursday morning Speed Read:

– Markets await Amazon’s afternoon Q2 report with bated breath – will it boost its market cap to $1T? $AMZN
– Dunkin Brands’ bakes up a Q2 beat, but cuts FY18 outlook 🍩 $DNKN
– Iran plans national cryptocurrency to circumvent US sanctions $SPY

Your Thursday morning Speed Read:

– Markets await Amazon's afternoon Q2 report with bated breath – will it boost its market cap to $1T? $AMZN
– Dunkin Brands' bakes up a Q2 beat, but cuts FY18 outlook 🍩 $DNKN
– Iran plans national cryptocurrency to circumvent US sanctions $SPY

— Benzinga (@Benzinga) July 26, 2018

#5Things
-Trump, Juncker cool trade tensions
-Facebook plunges
-It’s ECB day
-Markets rise
-Another huge earnings day
https://bloom.bg/2LQ7DWC

#5Things
-Trump, Juncker cool trade tensions
-Facebook plunges
-It's ECB day
-Markets rise
-Another huge earnings dayhttps://t.co/4susNk7wYl pic.twitter.com/xQxuV9XCh5

— Bloomberg Markets (@markets) July 26, 2018

If you are new to our trading service you should review recent blog posts, the Compound Trading YouTube Channel and at minimum our algorithm Twitter feeds because they do tell a story in terms of the market and how the inflections of the market determine our day to day trading. You will notice the algorithmic modelling has been undeniably accurate with many time-frames (intra-day, weeks and months out) so I myself have learned to respect the math (they have taken me from a 60% hit rate to 80%+ all publicly posted live trade alerts).

Momentum Stocks (Market Open and Intra-Day):

I do trade morning momo stocks, but I do avoid much of the day trading risk (preferring to daytrade only what is structurally set-up also on the swing trade side and to my advantage in the algorithmic model charting). I often avoid the first 30 minutes (gap and go) and trade momentum stocks or structured (per explanation in previous sentence) stocks later in day after a wash-out looking for a snap-back trade that can possibly also become a strong swing or longer term trade that I can leg in to. Just prior to open and shortly after open I post momentum stocks to the trade chat room (and Twitter and Stocktwits if I have time).

Some of my Favorite Intra-day Trading Set-Ups:

(1) Momentum Stock Wash-Outs for Snap Back, (2) Bad News Wash-outs on Stocks with High Institutional Ownership, (3) Getting on the Right Side of a Trend Change and scaling in my position and (4) Our Algorithm Charting Model Set-Ups.

The momentum stocks (from previous days and morning trade) I continue to watch through the day for indicators that allow a trade.

Morning Stock Watch-Lists for my Favorite Set-Ups:

(1) Pre-Market Gainers Watch-List: $SVU $TAOP $CRMD $ARNC $UAA $UA $AWX $XLNX $AMD $QCOM $BTI $TRCH $DPW $GNC $CNHI $SQQQ $CMCSA

(2) Pre-market Decliners Watch-List :

(3) Other Watch-List:

(4) Regular Algo Charting Watch-List: Gold $GC_F $GLD, Miners $GDX ($NUGT, $DUST, $JDST, $JNUG), Silver $SLV $SI_F ($USLV, $DSLV), Crude Oil FX: $USOIL $WTI ($UWT, $DWT, $USO, $UCO, $CL_F, $UWT, $DWT), Natural Gas $NG_F ($UGAZ, $DGAZ), S & P 500 $SPY $ES_F ($SPXL, $SPXS), US Dollar Index $DXY ($UUP), Volatility $VIX ($TVIX, $UVXY), $BTCUSD Bitcoin.

(5) Recent Upgrades: $DAN $FCB $XLNX $NSC $IART $FFBC $FCX $EDU $CBRL

(6) Recent Downgrades: $DDD $HFWA $ROIC $FB $NGD $ELF $SNBR $OC $CHFC $CCJ $SKX

Stay tuned in Stock Chat Room for more pre-market stocks on watch.

Study:

For new readers, a review of our unlocked posts on our blog would help you get in to the story we are following with the securities listed in this newsletter.

Free scanners to find momentum stocks that you can easily review charts of for indicators that bring probability of your trade being successful up considerably. These are not useful for first 30 minute market open gap and go type plays (you need a good momentum scanner, level 2, and best to have hot-keys for the first 30 mins of gap and go trading)… but are very useful for intra day scalping and swing trading (start with trending stocks and then look at indicators intra for simple set-ups – study scan study scan study scan).

http://finviz.com/

https://finance.yahoo.com/screener/predefined/ec5bebb9-b7b2-4474-9e5c-3e258b61cbe6

http://www.highshortinterest.com/

http://www.gurufocus.com/short-stocks.php

http://www.3xetf.com/all/

http://www.etf.com/channels/gold-etfs

GL!

Curtis

Algorithm Twitter feeds can be found here: $BTC (@CryptotheAlgo) $WTI (@EPICtheAlgo), $VIX (@VexatiousVIX), $SPY (@FREEDOMtheAlgo), $GLD (@ROSIEtheAlgo), $SLV (@SuperNovaAlgo), $DXY (@DXYUSD_Index). Our Swing Trading Twitter feed is found here: https://twitter.com/swingtrading_ct. Our lead trader Twitter feed is here @curtmelonopoly

Article Topics: Premarket, Watchlist, Stocks, Trading, Plan, Earnings, $FB, $AGN, OIL, $WTI, GOLD, Crypto, $BTC , US Dollar, $DXY

Read More
Bitcoin Algorithm (Crypto). Thurs July 26. $BTC $XBTUSD $XBT $ETH $LTC $XRP #Bitcoin #Algorithm

Bitcoin Algorithm (Crypto). Thurs July 26. $BTC $XBTUSD $XBT $ETH $LTC $XRP #Bitcoin #Algorithm

July 26, 2018December 30, 2018 Crypto the AlgoBitcoin (BTC) Algorithm (Crypto)$BTC, $BTC.X, $BTCUSD, $ETH, $LTC, $XBTUSD, $XRP, Algorithm, BITCOIN, Chart, Crypto, price targets, time cycles, Trade

Bitcoin Algorithm Report (Crypto). Thursday July 26, 2018. Includes Time Cycles, Price Targets and Buy / Sell Triggers.

$BTC $BTCUSD $XBTUSD $XBT $BTC.X $ETH $LTC $XRP #Bitcoin #Crypto

Hello, my name is Crypto the Bitcoin Algorithm. Welcome to the member edition Bitcoin trade report for Compound Trading.

Like our other algorithmic chart models, I am in development and testing for coding phase to be used as an intelligent assistant for our traders. My algorithm charting model is specifically suitable for the use and purpose of trading Bitcoin $BTCUSD, Bitcoin/USD perpetual swaps $XBTUSD, Bitcoin related equities and you will find additional preliminary algorithmic modeling for $ETH, $LTC and $XRP in this report.

Note: The $XBTUSD (Bitcoin swaps) model is built on a chart from BitMEX. Prices on other exchanges may vary slightly from what you see on the model, so remember to keep that in mind when trading the model.

Notices: 

  • More extensive chart models for $BTCUSD, $ETHUSD, $XRPUSD, $LTCUSD and others (such as a few bitcoin related equities) will be featured in future reporting.
  • Join us in our private Crypto Trading room server on discord!
  • For newer users – read the blog post about how to trade Bitcoin here.

Primary Methods of Bitcoin Trade: 

The primary method of trade we have found works with the most predictability is to wait for bitcoin to breach the upper right wall of a quadrant (the orange, blue or grey diagonal dotted lines – the thicker lines are more significant as they represent wider time-frames) and confirm over the next horizontal Fibonacci resistance. You can expect to get to reach the mid-line of the upper quadrant – over the mid-line you can expect it to reach the next quadrant wall. Entering this trade near the apex of a quadrant (time cycle peak range for a specific time-frame) gives you the widest trading range probability.

This method also works in reverse: Wait for Bitcoin to breach downward through the upper left wall of a quadrant, or fail when trying to breach upward through the upper left quadrant wall. Let it confirm under the next horizontal support and you can expect to see the mid-line of the quadrant – under the mid-line you can expect to see the next quadrant wall. Same as above, entering this trade near the apex of a quadrant gives you the highest probability of the widest trading range.

Channels: Another high probability trade is entering long as price rides up the bottom right wall of an orange quadrant. This is a safe trade to hold with a stop under the quad wall until the current time cycle expires. This trade works in reverse as well. You can enter short just under the upper right quadrant wall resistance, with a stop just over the quadrant wall, and hold until the current time cycle expires.

Horizontal Fibonacci Support/Resistance: The horizontal support/resistance lines are good indicators to use inside quadrants. The light green 0.5 Fibonacci line and the grey 1.0 or 0 Fibonacci levels (mid-lines) are the most significant. Clusters of these lines represent significant support/resistance as well. Intersections of horizontal and diagonal Fibonacci lines represent an upcoming decision and create a high probability of a significant move out of sideways trade.

Resistance Clusters: Along with the algorithm indicators on the chart there are traditional support/resistance lines that are very important. When these lines converge volatility tends to increase. Under the cluster is a high probability short. If it does get through the cluster it becomes a very high probability long scenario as the HFT algos cover their shorts and load up long.

Targets: Red circles on charting. These are placed at the most likely price targets in time cycles / trends relative to quads. These are still in very early stage of development/testing and should be used for observation only at this point. Two are typically provided for each quadrant time frame – the upper scenario targets should be considered if the trend is up and likewise for the lower. I do not recommend entering trades based on these targets. Also, at times the mid quad support / resistance line is highlighted with a target if trade is not extremely bullish or bearish.

Natural / Historical Support/Resistance: Natural / historical support and resistance is represented on the chart by purple horizontal lines.

Conventional Charting: Conventional charting should be weighed against the model(s) with all trade decisions.

In summary, our first generation Bitcoin algorithm chart model uses the following indicators (listed from most predictable to least in terms of win rate): 

  1. Trading range created by long term algorithmic modeled quadrant support and resistance (blue dotted lines)
  2. Trading range between buy/sell trigger levels (grey/green arrows and solid lines)
  3. Directional channels formed by long term algorithmic modeled support and resistance
  4. Horizontal Fibonacci support and resistance (multi-colored horizontal lines)
  5. Conventional Natural support and resistance (purple horizontal lines)
  6. Long term conventional trend lines (red diagonal lines)
  7. Conventional MA’s 

Bitcoin Algorithm – Daily Chart (Suitable for Swing Trading):

Click link to open initial chart viewer screen, then share button at bottom right of screen, then make it mine, then double click on chart body to hide or reveal indicators at bottom of chart (MACD etc).

Bitcoin Algorithm. Daily chart model testing 50 MA resistance in possible turn up channel. 207 AM July 26 $BTC $XBTUSD #Bitcoin #Algorithm

https://www.tradingview.com/chart/XBTUSD/Lyw66Jra-Bitcoin-Algorithm-Daily-chart-model-testing-50-MA-resistance-in/

Bitcoin, daily, algorithm, chart
Bitcoin Algorithm. Daily chart model testing 50 MA resistance in possible turn up channel. 207 AM July 26 $BTC $XBTUSD #Bitcoin #Algorithm

Bitcoin Algorithm. Daily chart model testing 50 MA resistance in possible turn. 302 AM July 17 $BTC $XBTUSD #Bitcoin #Algorithm

https://www.tradingview.com/chart/XBTUSD/9ewRlQWC-Bitcoin-Algorithm-Daily-chart-model-testing-50-MA-resistance-in/

Bitcoin, algorithm, daily
Bitcoin Algorithm. Daily chart model testing 50 MA resistance in possible turn. 302 AM July 17 $BTC $XBTUSD #Bitcoin #Algorithm

Bitcoin Trading Plan (Observations / Chart Indicators):

July 26 – As with the last two previous reports, it is a 50 MA resistance test but the trajectory of downdraft is changing and a turn is possible soon. Watching.

July 17 – As with previous, it is a 50 MA test but the trajectory of downdraft is changing and a turn is possible soon. Patiently watching.

July 9 – Trading just under 50 MA, watching for a decision at the 50 MA test for direction.

June 26 – Range bound trade – waiting for a direction.

June 19 – My current bias and trading plan is exactly what it was last report (range bound trade)

June 11 – If Bitcoin $XBTUSD dumps lower than 5900.00 then high probability it continues in down channel (illustrated down channel with yellow arrows). It holds and up channel is in play (also illustrated on charting).

On the daytrading chart below it seems too early to comment on a bias… looking for structure to build.

My personal bias is it should turn up channel, conventionally that makes sense in trading after a dump, however, the 5900.00 is key as a mid quad area.

A few tweets / comments in private Bitcoin member serve recently reflecting my bias:

And we’re there 🙂 Bitcoin $BTC #BTCUSD #Bitcoin #Charting #crypto

And we're there 🙂 Bitcoin $BTC #BTCUSD #Bitcoin #Charting #crypto pic.twitter.com/fK3u1dM7mx

— Melonopoly (@curtmelonopoly) June 10, 2018

Bitcoin Algorithm. 30 Minute Charting (Suitable for Daytrading BTC).

Bitcoin Algorithm. Daytrading 30 min chart with buy sell triggers (white arrows) 324 AM July 26 $BTC $XBTUSD #Bitcoin #Algorithm

https://www.tradingview.com/chart/XBTUSD/K0fIRnAA-Bitcoin-Algorithm-Daytrading-30-min-chart-with-buy-sell-trigger/

Bitcoin, 30 Min, daytrading, algorithm
Bitcoin Algorithm. Daytrading 30 min chart with buy sell triggers (white arrows) 324 AM July 26 $BTC $XBTUSD #Bitcoin #Algorithm

Bitcoin Algorithm. Daytrading 30 min chart with buy sell triggers (white arrows) 327 AM July 17 $BTC $XBTUSD #Bitcoin #Algorithm

https://www.tradingview.com/chart/XBTUSD/kyQQq1Sz-Bitcoin-Algorithm-Daytrading-30-min-chart-with-buy-sell-trigger/

Bitcoin, daytrading, chart
Bitcoin Algorithm. Daytrading 30 min chart with buy sell triggers (white arrows) 327 AM July 17 $BTC $XBTUSD #Bitcoin #Algorithm

Bitcoin Algorithm. Daytrading 30 min chart with buy sell triggers (white arrows) 136 AM July 9 $BTC $XBTUSD #Bitcoin #Algorithm

https://www.tradingview.com/chart/XBTUSD/uN4whjKx-Bitcoin-Algorithm-Daytrading-30-min-chart-with-buy-sell-trigger/

Bitcoin, 30 min, daytrading, algorithm
Bitcoin Algorithm. Daytrading 30 min chart with buy sell triggers (white arrows) 136 AM July 9 $BTC $XBTUSD #Bitcoin #Algorithm

Recent Bitcoin Real-Time Trade Alerts / Charting Set-up Alerts

If you are reviewing this newsletter (as a historical unlocked post) and not a member of our service and would like a tour of our private discord server (trading chat / alerts etc) or our private Twitter member $BTC alert feed let us know. You can check out our call rate for yourself. Transparent trading is important to us.

July 26 – Alert examples will be updated soon.

Intra bottom call. White arrow – alert sent. Green arrow – buy trigger. Red arrow – resistance (mid quad) on chart per alert sent. $BTC $XTUSD #Bitcoin #Cryptotrading

Intra bottom call. White arrow – alert sent. Green arrow – buy trigger. Red arrow – resistance (mid quad) on chart per alert sent. $BTC $XTUSD #Bitcoin #Cryptotrading pic.twitter.com/RM68yktgur

— Melonopoly (@curtmelonopoly) May 20, 2018

May 13 – Will post recent alerts soon when time allows.

Per recent;

April 29 – There have been many calls since bottom on our private server and private twitter feed… I’m not going to take the time to post them here right now but I will post this rant of tweets… the private member alerts I’ll post next report if time (they were all spot on alerts).

I even told ya how I knew where the bottom was. $BTC #Bitcoin #algorithm

I even told ya how I knew where the bottom was. $BTC #Bitcoin #algorithm

Next should be insane trading in crypto space. Could be wrong… but I’m feelin it. #crypto $BTC $XBT $ETH $LTC #trading screenshot

Next should be insane trading in crypto space. Could be wrong… but I’m feelin it. #crypto $BTC $XBT $ETH $LTC #trading screenshot

Next should be insane trading in crypto space. Could be wrong… but I’m feelin it. #crypto $BTC $XBT $ETH $LTC #trading

Next should be insane trading in crypto space. Could be wrong… but I’m feelin it. #crypto $BTC $XBT $ETH $LTC #trading

$BTC near HOD and some bullish action on intra. Tweet screen shot.

$BTC near HOD and some bullish action on intra. Tweet screen shot.

$BTC near HOD and some bullish action on intra. $BTC #bitcoin #calls

$BTC near HOD and some bullish action on intra. $BTC #bitcoin #calls

Technical precision trading. Price target hit perfect on daytrading algorithm model charting. $BTC $XBT #Bitcoin #Crypto #Trading

Bitcoin, price, target, hit, alert
Technical precision trading. Price target hit perfect on daytrading algorithm model charting. $BTC $XBT #Bitcoin #Crypto #Trading

Technical precision trading. Price target hit perfect on daytrading algorithm model charting. $BTC $XBT #Bitcoin #Crypto #Trading pic.twitter.com/l1pafs56QD

— Crypto the BTC Algo (@CryptotheAlgo) April 18, 2018

Bitcoin coming in to a possible buy trigger zone on daytrading chart. $BTC #Bitcoin

https://twitter.com/BTCAlerts_CT/status/978317583987429376

Bitcoin, realtime, trade, alert
Bitcoin coming in to a possible buy trigger zone on daytrading chart. $BTC #Bitcoin

$BTC Bitcoin popped now 400 points since alert of support. Not a bad RR here for long test. If nothing else a day trade.

https://twitter.com/BTCAlerts_CT/status/978397655796801538

Bitcoin time price cycle peak coming April 7 – path of least resistance down target but my bias is to up. Trade price. We start trading live again Monday so I’ll broadcast our trading group moves live for this setup. $BTC #Bitcoin #trading #crypto (alerted in private member Discord server)

Bitcoin, trading, timecycle, chart
Bitcoin time price cycle peak coming April 7 – path of least resistance down target but my bias is to up. Trade price. $BTC #Bitcoin #trading #crypto.png

And the result…. price is dumping in to lower target identified on trade alert…. intrad-day getting close. Charting wins. Trader bias not so good on this one.

price tragets, Bitcoin
Bitcoin did dump in to down target.

Ethereum Algorithm. Basic Charting Model on Daily Time Frame:

Ethereum Algorithm. Daily Chart. Price testing 50 MA resistance, in channel. On watch. July 26 26 332 AM $ETH $ETHUSD #Ethereum #Algorithm

https://www.tradingview.com/chart/ETHUSD/uYLjkn7m-Ethereum-Algorithm-Daily-Chart-Price-testing-50-MA-resistance/

Ethereum, algorithm, trading
Ethereum Algorithm. Daily Chart. Price testing 50 MA resistance, in channel. On watch. July 26 26 332 AM $ETH $ETHUSD #Ethereum #Algorithm

Ethereum Algorithm. Daily Chart. 625 resistance 418 support July 9 316 AM $ETH $ETHUSD #Ethereum #Algorithm

https://www.tradingview.com/chart/ETHUSD/yTHWkDW3-Ethereum-Algorithm-Daily-Chart-625-resistance-418-support-July/

ETHUSD, Ethereum, Algorithm
Ethereum Algorithm. Daily Chart. 625 resistance 418 support July 9 316 AM $ETH $ETHUSD #Ethereum #Algorithm

Ethereum Algorithm. Daily Chart. Price in channel, with weak trade. On watch. June 26 434 AM $ETH $ETHUSD #Ethereum #Algorithm

https://www.tradingview.com/chart/ETHUSD/rWA1pk6D-Ethereum-Algorithm-Daily-Chart-Price-in-channel-with-weak-tra/

Ethereum, algorithm, $ETH
Ethereum Algorithm. Daily Chart. Price in channel, with weak trade. On watch. June 26 434 AM $ETH $ETHUSD #Ethereum #Algorithm

Litecoin Algorithm. Basic Charting Model.

Primary buy sell triggers on Litecoin daily chart:

475.00

381.00

287.00

192.00

98.00

July 26 – No significant change to below;

Litecoin Algorithm. LTC showing signs of possible bottom turn reversal. July 17 332 AM $LTCUSD #Litecoin #Algorithm

https://www.tradingview.com/chart/LTCUSD/tIYi5Tb4-Litecoin-Algorithm-LTC-showing-signs-of-possible-bottom-turn-re/

Litcoin, LTC, Chart
Litecoin Algorithm. LTC showing signs of possible bottom turn reversal. July 17 332 AM $LTCUSD #Litecoin #Algorithm

Litecoin Algorithm. LTC still in down trend channel. July 9 324 AM $LTCUSD #Litecoin #Algorithm

https://www.tradingview.com/chart/LTCUSD/qwS0iEZr-Litecoin-Algorithm-LTC-still-in-down-trend-channel-July-9-324/

LTC, Litcoin, Algorithm
Litecoin Algorithm. LTC still in down trend channel. July 9 324 AM $LTCUSD #Litecoin #Algorithm

Ripple Basic Algorithm Charting Model $XRP

July 26 – No noteworthy change.

July 17 – No noteworthy change.

July 9 – No noteworthy change.

May 13 – Ripple needs .932 for a chance for a bullish structured run. $XRP $XRPUSD.

https://www.tradingview.com/chart/XRPUSD/Bh8cPwbQ-Ripple-needs-932-for-a-chance-for-a-bullish-structured-run-XR/

I put some tighter time from Fib structure in the model for those that asked for daytrading signals.

$XRP. algorithm
Ripple needs .932 for a chance for a bullish structured run. $XRP $XRPUSD

Per recent;

May 10 – Nothing to report. Flat.

April 29 – $XRP flat but over 200 MA on daily.

BUT still great returns from 40s to near 90s WOW.

https://www.tradingview.com/chart/XRPUSD/0aDABOJz-XRP-flat-but-over-200-MA-on-daily/

$XRP flat but over 200 MA on daily.

Per recent;

April 22 – $XRP over .888 targets 1.31 then 1.65 mid term. Daytrading model on -deck. #ripple

https://www.tradingview.com/chart/XRPUSD/zIn8bXCj-XRP-over-888-targets1-31-then-1-65-mid-term-Daytrading-model/

$XRP, price targets, chart, Ripple
$XRP over .888 targets1.31 then 1.65 mid term. Daytrading model on -deck. #ripple

Crypto News:

Crypto Markets Recover After Weekend Losses Saw Bitcoin at Lowest 2018 Level

https://cointelegraph.com/news/crypto-markets-recover-after-weekend-losses-saw-bitcoin-at-lowest-2018-level

< End of report >

Any questions give us a shout anytime!

Follow Me:

Live Twitter Alert Feed for Bitcoin Trade Set-ups: @BTCAlerts_CT, Public Feed: @cryptothealgo

To Subscribe to our Crypto Services:

Link to Services and Pricing Overview (master list).

Link to Standalone $BTC Crypto Newsletter.

Link to Real-Time Live Bitcoin Alerts (Twitter).

Link to Crypto Bundle (Alerts, Private Trading Discord Server, Newsletter).

Review historical (unlocked to public) Weekly Bitcoin Newsletter Algorithm Reporting. Scroll down landing page to get to historical reports.

Post topics; Crypto, Algorithm, BTC, Bitcoin, chart, $BTC, $BTCUSD, $XBTUSD, $BTC.X, $ETH, $LTC, $XRP, trade, price targets, time cycles

Read More
SP500 Algorithm (SPY). Thurs July 26 Report. $SPY $ES_F $SPXL, $SPXS #SPY #Algorithm

SP500 Algorithm (SPY). Thurs July 26 Report. $SPY $ES_F $SPXL, $SPXS #SPY #Algorithm

July 26, 2018December 30, 2018 FREEDOM SPYSP500 (SPY) Algorithm$ES_F, $SPXL, $SPXS, Algorithm, Chart, Model, SP500, SPY

S&P 500 SPY Trading Algorithm Update Thursday July 26, 2018.

$SPY $ES_F ($SPXL, $SPXS) Chart Observations

My name is Freedom the SPY Algo ($SPY). Welcome to my S&P 500 trade report for Compound Trading Group.

Below you will find algorithmic model charting based on Fibonacci extensions, timing and various other principles. This is a very early stage development model (generation 2 – 5 modeling rolls out in 2018 and as a result the reporting frequency increase significantly – our more advanced algorithm chart models are 4th and 5th generation, such as EPIC the Oil Algo that is graduating to #IA coding).

Notices:

NA

How to use this charting model:

This S&P 500 (SPY) algorithm report includes a 1 minute model and a 60 minute model with buy sell triggers and reports in near future will include other time-frames for different styles / time-frames of trade.

The simplest way to use the charting is to consider all lines support and resistance decisions with the horizontal grey lines (marked with grey arrows) to be significant trading ranges in the model. The thicker the line the more important. And please consider that all support and resistance lines are approximate as this is a working chart model (a work-sheet). Horizontal and diagonal dotted lines are consider support and resistance.

This chart model is best weighed against conventional charting and used in conjunction with a conventional chart.

If you have questions about the best use of the chart model or private coaching options email our developers anytime at info@compoundtrading.com.

SP500 Algorithm (SPY). 1 Min Chart (Intra-Day Trading) $SPY.

Current Buy / Sell Triggers for $SPY SP500:

292.29

290.70

289.15

287.58

286.00

284.45

282.88

281.30

279.74

278.17

276.61

275.02

273.46

271.89

270.33

268.75

267.20

265.62

264.04

262.47

260.92

When you open the live chart below in “viewer” mode you can then click on the share button at bottom right and then click on “make it mine” to open real-time chart. Double click the body of the chart to remove or institute indicators at bottom of chart (MACD, Stoch RSI, SQZMOM).

SP500 Algorithm (SPY). 1 Min chart. Current trade. Buy sell triggers, fibs, quads, MA’s. July 26 137 AM. $SPY $ES_F $SPXL $SPXS #Algorithm #SPY

https://www.tradingview.com/chart/SPY/lccTrs0g-SP500-Algorithm-SPY-1-Min-chart-Current-trade-Buy-sell-trig/

$S{Y, Algorithm, 1 min
SP500 Algorithm (SPY). 1 Min chart. Current trade. Buy sell triggers, fibs, quads, MA’s. July 26 137 AM. $SPY $ES_F $SPXL $SPXS #Algorithm #SPY

SP500 Algorithm (SPY). 1 Min chart. Current trade. Buy sell triggers, fibs, quads, MA’s. July 17 612 AM. $SPY $ES_F $SPXL $SPXS #Algorithm #SPY

https://www.tradingview.com/chart/SPY/RSJxfXQp-SP500-Algorithm-SPY-1-Min-chart-Current-trade-Buy-sell-trig/

SPY, Algorithm, 1 min
SP500 Algorithm (SPY). 1 Min chart. Current trade. Buy sell triggers, fibs, quads, MA’s. July 17 612 AM. $SPY $ES_F $SPXL $SPXS #Algorithm #SPY

SP500 Algorithm (SPY). 60 Minute Chart (Swing Trading) $SPY:

SP500 Algorithm (SPY). 60 Min Gen 1. Current trade above pivot. Buy sell triggers, fibs, quads, MA’s. July 26 148 AM. $SPY $ES_F $SPXL $SPXS #Algorithm #SPY

https://www.tradingview.com/chart/SPY/9cm3Qhzn-SP500-Algorithm-SPY-60-Min-Gen-1-Current-trade-above-pivot/

SPY, 60 min, algorithm, chart
SP500 Algorithm (SPY). 60 Min Gen 1. Current trade above pivot. Buy sell triggers, fibs, quads, MA’s. July 26 148 AM. $SPY $ES_F $SPXL $SPXS #Algorithm #SPY

SP500 Algorithm (SPY). 60 Min Gen 1. Current trade above pivot. Buy sell triggers, fibs, quads, MA’s. July 17 532 AM. $SPY $ES_F $SPXL $SPXS #Algorithm #SPY

https://www.tradingview.com/chart/SPY/7kqXrSdT-SP500-Algorithm-SPY-60-Min-Gen-1-Current-trade-above-pivot/

SPY, Algorithm, 60 Min
SP500 Algorithm (SPY). 60 Min Gen 1. Current trade above pivot. Buy sell triggers, fibs, quads, MA’s. July 17 532 AM. $SPY $ES_F $SPXL $SPXS #Algorithm #SPY

SP500 Algorithm (SPY). 60 Min Gen 1. Current trade. Buy sell triggers, fibs, quads, MA’s. July 11 147 AM. $SPY $ES_F $SPXL $SPXS #Algorithm #SPY

https://www.tradingview.com/chart/SPY/7Isu84c0-SP500-Algorithm-SPY-60-Min-Gen-1-Current-trade-Buy-sell-tri/

SPY, algorithm, 60 min
SP500 Algorithm (SPY). 60 Min Gen 1. Current trade. Buy sell triggers, fibs, quads, MA’s. July 11 147 AM. $SPY $ES_F $SPXL $SPXS #Algorithm #SPY

SP500 (SPY) Conventional Charting Considerations $SPY:

July 26, 2018 – Structure from previous still intact.

SP500 (SPY) Chart – MACD still turned down, messy structure. $SPY $ES_F $SPXL $SPXS #SPY #Chart

SPY chart with bearish (or at best indecisive) overtones in its structure.

https://www.tradingview.com/chart/SPY/0AunkmGQ-SP500-SPY-Chart-MACD-still-turned-down-messy-structure-SP/

MACD, SPY, bearish
SP500 (SPY) Chart – MACD still turned down, messy structure. $SPY $ES_F $SPXL $SPXS #SPY #Chart

SP500 (SPY) Chart with trendlines to watch – MACD to likely turn down today. June 18 649 AM $SPY $ES_F $SPXL $SPXS #SPY #Chart

https://www.tradingview.com/chart/SPY/BPGlqYIc-SP500-SPY-Chart-with-trendlines-to-watch-MACD-to-likely-turn/

SPY, daily, chart, MACD, trend lines
SP500 (SPY) Chart with trendlines to watch – MACD to likely turn down today. June 18 649 AM $SPY $ES_F $SPXL $SPXS #SPY #Chart

Per recent;

SP500 (SPY) Chart – Trade above moving averages MACD is turned up on daily. June 12 1213 AM $SPY $ES_F $SPXL $SPXS #SPY #Chart

https://www.tradingview.com/chart/SPY/Wjep6hpw-SP500-SPY-Chart-Trade-above-moving-averages-MACD-is-turned-u/

SPY, SP500, MACD, Daily, Chart
SP500 (SPY) Chart – Trade above moving averages MACD is turned up on daily. June 12 1213 AM $SPY $ES_F $SPXL $SPXS #SPY #Chart

Recent Real-Time Alerts, Trading, Model Price Target hits etc.

July 26 – Alert and price target examples will be updated soon.

Per recent;

9:56 AM – 19 Apr 2018 $SPY Divergent trade returning to target area it tried to pass in the fast lane. See previous recent posts.

$SPY Divergent trade returning to target area it tried to pass in the fast lane. See previous recent posts. pic.twitter.com/3vo4sgNXKH

— Melonopoly (@curtmelonopoly) April 19, 2018

$SPY, divergent, trade, alert
$SPY Divergent trade returning to target area it tried to pass in the fast lane. See previous posts..png

5:18 AM – 18 Apr 2018 That 273.20 mark that comes due in a time cycle peak for $SPY at around 2:00 EST today…. that’s the start of a double extension getting really stretched on the models – corresponds with everything that moved. There ain’t much room available above that short term. Rest on deck.

That 273.20 mark that comes due in a time cycle peak for $SPY at around 2:00 EST today…. that's the start of a double extension getting really stretched on the models – corresponds with everything that moved. There ain't much room available above that short term. Rest on deck. pic.twitter.com/wKfBQ9njDc

— Melonopoly (@curtmelonopoly) April 18, 2018

4:48 AM – 18 Apr 2018 $SPY long side trade cleared mid quad and quad wall. Closed 270.19, next res trims 270.22, 270.45, 271.99, 273.25

https://twitter.com/SwingAlerts_CT/status/986526884790927360

$SPY, trade, alert, chart
$SPY long side trade cleared mid quad and quad wall. Closed 270.19, next res trims 270.22, 270.45, 271.99, 273.25

3:37 PM – 13 Apr 2018 The resistance dump after the alert and the 50 MA support may become your buy area Mon morning. $SPY #swingtrading https://www.tradingview.com/chart/SPY/H375XWXb-The-resistance-dump-after-the-alert-and-the-50-MA-support-may-be/ …

https://twitter.com/SwingAlerts_CT/status/984878380284858369

$SPY, alert, feed
The resistance dump after the alert and the 50 MA support may become your buy area Mon morning. $SPY #swingtrading.png

11:05 AM – 13 Apr 2018 $SPY trim quad resistance alert worked well.

https://twitter.com/SwingAlerts_CT/status/984809783768346624

$SPY, trading, alert
$SPY trim quad resistance alert worked well.

9:31 AM – 13 Apr 2018 $SPY upside resistance trim alert to long side as it approaches 268.00 mid quad res

https://twitter.com/SwingAlerts_CT/status/984786277189988352

$SPY, twitter, alert
$SPY upside resistance trim alert to long side as it approaches 268.00 mid quad res

$SPY at upside resistance pivot and structured trade worked out. Trim longs add above.

https://www.tradingview.com/chart/SPY/JbhGvFKm-SPY-at-upside-resistance-pivot-and-structured-trade-worked-out/

$SPY, upside resistance
$SPY at upside resistance pivot and structured trade worked out. Trim longs add above.

$SPY building structure near the buy trigger and channel bottom we expected. It’s long while it holds area. Trading 261.23 intra day.

https://twitter.com/SwingAlerts_CT/status/981571557771350018

https://www.tradingview.com/chart/SPY/hmAGDbrc-SPY-building-structure-near-the-buy-trigger-and-channel-bottom/

$SPY, chart, structure
$SPY building structure near the buy trigger and channel bottom we expected. It’s long while it holds area.

$SPY Time cycle peak on this simple model is now. If its going to follow channel up it will be soon that it starts. If not, it could be another channel down yet.

https://www.tradingview.com/chart/SPY/IDiDMAVs-SPY-Time-cycle-peak-on-this-simple-model-is-now-If-its-going-t/ …

https://twitter.com/DayAlerts_CT/status/978990333278253056/photo/1pic.twitter.com/50zcoPctuv

$SPY, timecycle, charting
$SPY Time cycle peak on this simple model is now. If its going to follow channel up it will be soon that it starts.

Best with your trades and look forward to seeing you in the room!

Freedom the $SPY Algo

Tweets by FREEDOMtheAlgo

Article Topics: SP500, Algorithm, SPY, $SPY, Chart, Model, $ES_F, $SPXL, $SPXS

Read More
Swing Trading Report (Mailing List Edition): Earnings Charting July 24 $RIOT, $CELG, $ARWR, $EXTR, $EDIT, $SOHU, $ESPR, $LPSN, $XOMA …

Swing Trading Report (Mailing List Edition): Earnings Charting July 24 $RIOT, $CELG, $ARWR, $EXTR, $EDIT, $SOHU, $ESPR, $LPSN, $XOMA …

July 26, 2018July 26, 2018 Swing TraderGeneral Complimentary Newsletters, Swing Newsletters, Swing Trading$ARWR, $CELG, $EDIT, $ESPR, $EXTR, $GTHX, $IPI, $LPSN, $MBRX, $PDLI, $RIOT, $SOHU, $WTI, $XOMA, DXY, Oil, SPY

Special Earnings Season Swing Trading Report and Video for July 24, 2018 (Part B).

In this Edition: OIL, $WTI, $SPY, $DXY, $CELG, $RIOT, $ARWR, $GTHX, $EXTR, $EDIT, $IPI, $MBRX, $SOHU, $PDLI, $ESPR, $LPSN, $XOMA and more.

What’s New!

  • Interested in free swing trading setups? Click here to sign up for the Complimentary Swing Trading Report Mailing List.
  • Now available for serious traders – Legacy All Access Membership.

The Mid Day Trade Set-Ups Video:

Trade set-ups on this video; OIL, $WTI, $SPY, $DXY, $CELG, $RIOT, $ARWR, $GTHX, $EXTR, $EDIT, $IPI, $MBRX, $SOHU, $PDLI, $ESPR, $LPSN, $XOMA and more. 

Mid Day Chart Swing Trading Set-ups July 24, 2018 Summary:

July 24 Swing Trading Special Earnings Season Report (mailing list version) that will become the premise for our next major entries.

Stocks reviewed on this 2nd video in the series for earnings: OIL, $WTI, $SPY, $DXY, $CELG, $RIOT, $ARWR, $GTHX, $EXTR, $EDIT, $IPI, $MBRX, $SOHU, $PDLI, $ESPR, $LPSN, $XOMA.

We are reviewing all one hundred equities we have in coverage on our swing trading platform – all over the next ten days or so for earnings trading season.

This is from June 24 report cycle (last time these equities were reported to members) and now reviewed July 24, 2018. Members can refer to that report for charting to reference in the video (if not included below).

OIL $WTI – Looking for a sizeable entry at decision on the resistance on-deck trading 68..81. Waiting on the decision either side of resistance.

$SPY SP500 – Near target hit in time frame from yesterday’s video alert long trigger over 281 ish and came close to price target 282.46. Missing most bullish target but close. 283.80 next resistance, then 285.24. Intra day support 281.10 main support 278.64 for quad trading range Aug 2. 289.07 Aug 2 bullish scenario targets 294.25 then 299.53 in the model.

US Dollar $DXY – main pivot 94.54 in this structure and trading intra day just above. 96.50 – 97 is upside bullish target if price gets over light blue downtrending TL line. Trading channels are also discussed on video as is lower support.

$CELG – 87.84 resistance at quad wall (down trending TL Fibonacci) upside targets if it runs 86.12 88.70, 91.60 96.10 July 25. Earnings in two days.

$RIOT – entries 7.30s to 7.60s ish today and released on its way up in to the 8s. Fantastic day trade. Swing trading most bullish price target resistance 9.70s.

$ARWR – Earnings 14 days trading 16.61 intra day, took a first 30% sizing trade on a swing long a little higher on the day. 16.25 main support. Will add on pullbacks at supports discussed in video. Low 20s is the price target range. Trading plan scenarios for upside and downside trade are discussed on video and sizing for each scenario.

$GTHX – Trade is at mid quad primary range resistance so a decision is near. 49.01 is buy side trigger if it holds on any given day at close. Main support 44.40 in structure. Pull back buy triggers are discussed on video.

$EXTR – Indicators are up but Stoch RSI is really high, short side alert worked, Sept 5th 7.16 lower price target in sell-off, support test at 8.49 trading 8.78. Earnings 15 days. If it gets bullish 9.29 resistance with 9.95 bullish target Sept 5 and I would be very cautious.

$EDIT – Algorithm model trade is predictable hitting price targets through the channel. Intra sitting on mid quad support and 200 MA. Channel in chart. Symmetry is excellent. Downside support is 30.53 quad wall intra, 28.00 support in sell off and 25.55 support. 27.93 price target Sept 29 in a downside. Trading plan discussed in video and how it should trade through the channel.

$IPI Intrepid Potash – 200 MA upside resistance on weekly chart. Would be nice to see MACD down and turn for an entry. Alarming chart for a possible breach of 200 MA to upside.

$MBRX – Main pivot 2.46 has held and this is a fantastic short each time it gets in that area of resistance.

$SOHU – Long long term trend is down, MACD trending down, earnings on deck in 6 days. Iffy chart, I would be cautious with this one.

$PDLI – Short side worked, we never did see buy trigger hit in dump, resistance areas for upside 2.92 3.05 3.21. Earnings in 12 days. Over 200 MA I may be interested in a trade.

$ESPR – Wash-out was an okay trade set up, MACD is about to turn up on the weekly structure, Stoch RSI is turned up. It is above 200 MA. Looking better. 49.60 main resistance trading 43.35. 20 50 MA weekly will be next resistance after 49.60. Trade trigger over 44.63 is a serious look.

$LPSN LivePerson – Indicators are all up, earnings in 8 days, bulls have bought in to earnings, main resistance 25.10 ish and support around 20.40 and trading 24.35 intra. Watching for a break over 25.10 ish. Not interested in a pull back buy unless it got to 20 MA. Watch the main resistance 25.90. Mid pivot main 23.50 (trading right above intra day).

$XOMA – Trade below bottom target, trading at main pivot intra day, not sure which direction it will take. Likely see some upside but unsure, 26.70 is main buy zone consideration. Will review then.

Charts and Chart Links for Member Version Only

(Mailing list versions that may be made available from time to time do not include charting or chart links).

For charts that are not included below but are on the video, members can refer to most recent swing trading report that has the chart and/or chart link.

Cheers!

Curt

Temporary Promo Discounts (for new members only).

Subscribe to Weekly Swing Trading Newsletter service here Reg 119.00. Promo Price 83.30 (30% off). Promo Code “30P”. 

Or Real-Time Swing Trading Alerts Reg 99.00. Promo Price 69.37 (30% off). Promo Code “Deal30”.

I personally guarantee our swing trading service is one of the best in the business and it’s very reasonably priced considering the technical expertise invested in the platform (Lead Trader).

Subscribe to Swing Trading Service:

Swing Trading Bundle (Swing Trading Newsletter and Live Swing Trading Alerts).

Swing Trading Newsletter (Weekly Newsletter Published for Traders).

Real-Time Swing Trading Alerts (Private Member only Twitter Feed).

One-on-One Trade Coaching (Via Skype or In-Person).

Free Mailing List(s):

Join Email List for Free Trade Charting Trade Set-ups, Deals, Podcasts and Public Webinars.

Free Swing Trading Periodical Contact Form (Complimentary Swing Trade Set-Ups to Email)

Public Chat:

Visit our Free Public Chat Room on Discord.

Follow Me:

Tweets by swingtrading_ct


Read More
Trading Facebook (FB) Earnings Wash-out Revenue Growth Warning (Mailing List Edition) $FB #trading

Trading Facebook (FB) Earnings Wash-out Revenue Growth Warning (Mailing List Edition) $FB #trading

July 25, 2018July 25, 2018 Swing TraderGeneral Complimentary Newsletters, Swing Newsletters, Swing Trading$FB, Chart, Daytrading, earnings, FaceBook, Sell-off, Swingtrading, Trading, washout

How to Trade Facebook (FB) Earnings Wash-out. Technical Charting for Swing Trading and Day Trading. Mailing List Edition of Report.

Facebook, Inc. (FB) plunged in after hours trade today falling from 218.62 high of day to 164.30 in a spectacular after hours trading session.

In this report are the technical charting details for trading Facebook in the coming days and weeks. The charts below will assist you on short time frame daytrading in premarket and market open tomorrow. Also included in this report are longer time frame daytrading levels and swing trading buy sell triggers for Facebook stock trade.

The reason for the sell-off is detailed in a Market Watch article from earlier today;

Facebook stock drops more than 20% after warning that revenue growth will take a hit

https://www.marketwatch.com/story/facebook-stock-crushed-after-revenue-user-growth-miss-2018-07-25

Facebook earnings include ‘nightmare guidance’ that lopped more than $100 billion off its market cap in after-hours trading.

“As I’ve said on past calls, we’re investing so much in security that it will significantly impact our profitability,” Zuckerberg said. “We’re starting to see that this quarter.”

The stock didn’t fall off a cliff until Chief Financial Officer David Wehner disclosed that the social-media giant expects the revenue-growth slowdown to continue.

“Our total revenue-growth rates will continue to decelerate in the second half of 2018, and we expect our revenue-growth rates to decline by high-single-digit percentages from prior quarters sequentially in both Q3 and Q4,” he said on the conference call. Wehner also said Facebook still expects expenses to grow 50% to 60% from last year.

The last time we traded a Facebook wash-out the trade was one of our biggest winners of 2018 (thus far). We nailed the bottom of the sell-off and we followed the trade through as it gained upside until today. We have been out of the trade for a few weeks now in anticipation for today’s earnings announcement.

Below is one of many alerts issued to members in the last Facebook sell-off, we were in nice and early and banked considerably as a result:

$FB Facebook long side trade from 153.40 Mar 28 buy side trigger now testing buy sell trigger 167.51. See chart notes. #swingtrading

https://twitter.com/SwingAlerts_CT/status/984194323192266752

FB, long side, trade alert
$FB Facebook long side trade 153.40 Mar 28 buy side trigger testing buy sell trigger 167.51. See chart notes. #swingtrading

You can find the April 11, 2018 Facebook trade article from our blog here:

$FB Facebook Long Set-Up Testing Buy Sell Trigger #swingtrading (Public Edition)

During the last Facebook sell-off swing trade price plunged in to the 150’s and the article link takes the trade step by step from the low 160’s.

When this first set-up I alerted it a number of times in different ways on different platforms – I even texted people and sent private messages. I was screaming this from the rooftops..

As time goes on in your trading life you learn over and over again how this particular type of set-up has profit written all over it. The secret however, is knowing where your trading chart structure is in advance of trade getting to that area of restructuring after the wash-out. Knowing that is key.

STEP 1: Getting in to the Facebook trade in premarket or at market open tomorrow morning (Thursday July 26, 2018).

The chart below will help you with short time-frame entries to get your positioning right, get on the right side of the trade so that you can then leg in to a sizeable swing trade if you want from there forward (pending trading action in the morning).

My trading plan for Facebook will be to do exactly that, daytrade it in premarket tomorrow with the objective of getting some profit side room in the trade so that I can leg in to a more significant swing trading position.

I should note that considering the company’s guidance on the earnings call today that I do not expect the same ROI as the last trade we started in April of 2018.

Facebook (FB) “On the Fly” Facebook Daytrading Chart with buy sell triggers for premarket Thursday. $FB #facebook #chart

Member version of this report includes (in addition to a static chart) a link below to a live interactive Facebook daytrading chart on Trading View (with all technical levels and a list of buy sell triggers etc).

$FB, Facebook, daytrading, chart, technical, levels
Facebook (FB) On the fly Facebook Daytrading Chart with buy sell triggers for premarket Thursday. $FB #facebook #chart

The 167.50 notation on the chart above is in reference to a series of tweets I published on my personal Twitter feed when the earnings sell off was in motion as follows;

Watching $FB close now

Watching $FB close now

— Melonopoly (@curtmelonopoly) July 25, 2018

167.50 would be nice $FB

167.50 would be nice $FB

— Melonopoly (@curtmelonopoly) July 25, 2018

next magic

next magic

— Melonopoly (@curtmelonopoly) July 25, 2018

167.50 hit $FB

167.50 hit $FB

— Melonopoly (@curtmelonopoly) July 25, 2018

magic show restructure in progress $FB

magic show restructure in progress $FB pic.twitter.com/jOUbPr12IE

— Melonopoly (@curtmelonopoly) July 25, 2018

STEP 2: Long Daytrade and Swingtrading Time Frames.

FACEBOOK (FB) Trading Facebook wash-out on earnings. Trading levels for daytrading and swingtrading. $FB #daytrade #swingtrade #chart

Member version of this charting includes (in addition to a static chart) a link below to a live interactive Facebook daytrading / swingtrading chart on Trading View (with all technical levels including buy/sell triggers, MA’s, quad walls, Fibonacci support and resistance, price targets and more).

Trade toward price target trajectory between the Fibonacci resistance and support levels (paying attention to quad walls – Fib diagonal trendlines). Trim heavy at buy sell triggers and add above or below depending on your trending direction of trade.

FB, daytrading, swingtrading, chart, technical, trading
FACEBOOK (FB) Trading Facebook wash-out on earnings. Trading levels for daytrading and swingtrading. $FB #daytrade #swingtrade #chart

Cheers!

Curt

Temporary Promo Discounts (for new members only).

Subscribe to Weekly Swing Trading Newsletter service here Reg 119.00. Promo Price 83.30 (30% off). Promo Code “30P”. 

Or Real-Time Swing Trading Alerts Reg 99.00. Promo Price 69.37 (30% off). Promo Code “Deal30”.

I personally guarantee our swing trading service is one of the best in the business and it’s very reasonably priced considering the technical expertise invested in the platform (Lead Trader).

Subscribe to Swing Trading Service:

Swing Trading Bundle (Swing Trading Newsletter and Live Swing Trading Alerts).

Swing Trading Newsletter (Weekly Newsletter Published for Traders).

Real-Time Swing Trading Alerts (Private Member only Twitter Feed).

One-on-One Trade Coaching (Via Skype or In-Person).

Free Mailing List(s):

Join Email List for Free Trade Charting Trade Set-ups, Deals, Podcasts and Public Webinars.

Free Swing Trading Periodical Contact Form (Complimentary Swing Trade Set-Ups to Email)

Public Chat:

Visit our Free Public Chat Room on Discord.

Follow Me:

Tweets by swingtrading_ct

Read More
Trading Facebook (FB) Earnings Wash-out on Revenue Growth Warning (Member Edition) $FB #trading

Trading Facebook (FB) Earnings Wash-out on Revenue Growth Warning (Member Edition) $FB #trading

July 25, 2018October 4, 2018 Swing TraderSwing Trading$FB, Chart, Daytrading, earnings, FaceBook, Sell-off, Swingtrading, Trading, washout

How to Trade Facebook (FB) Earnings Wash-out. Technical Charting for Swing Trading and Day Trading. Member Edition of Report.

Facebook, Inc. (FB) plunged in after hours trade today falling from 218.62 high of day to 164.30 in a spectacular after hours trading session.

In this report are the technical charting details for trading Facebook in the coming days and weeks. The charts below will assist you on short time frame daytrading in premarket and market open tomorrow. Also included in this report are longer time frame daytrading levels and swing trading buy sell triggers for Facebook stock trade.

The reason for the sell-off is detailed in a Market Watch article from earlier today;

Facebook stock drops more than 20% after warning that revenue growth will take a hit

https://www.marketwatch.com/story/facebook-stock-crushed-after-revenue-user-growth-miss-2018-07-25

Facebook earnings include ‘nightmare guidance’ that lopped more than $100 billion off its market cap in after-hours trading.

“As I’ve said on past calls, we’re investing so much in security that it will significantly impact our profitability,” Zuckerberg said. “We’re starting to see that this quarter.”

The stock didn’t fall off a cliff until Chief Financial Officer David Wehner disclosed that the social-media giant expects the revenue-growth slowdown to continue.

“Our total revenue-growth rates will continue to decelerate in the second half of 2018, and we expect our revenue-growth rates to decline by high-single-digit percentages from prior quarters sequentially in both Q3 and Q4,” he said on the conference call. Wehner also said Facebook still expects expenses to grow 50% to 60% from last year.

The last time we traded a Facebook wash-out the trade was one of our biggest winners of 2018 (thus far). We nailed the bottom of the sell-off and we followed the trade through as it gained upside until today. We have been out of the trade for a few weeks now in anticipation for today’s earnings announcement.

Below is one of many alerts issued to members in the last Facebook sell-off, we were in nice and early and banked considerably as a result:

$FB Facebook long side trade from 153.40 Mar 28 buy side trigger now testing buy sell trigger 167.51. See chart notes. #swingtrading

https://twitter.com/SwingAlerts_CT/status/984194323192266752

FB, long side, trade alert
$FB Facebook long side trade 153.40 Mar 28 buy side trigger testing buy sell trigger 167.51. See chart notes. #swingtrading

You can find the April 11, 2018 Facebook trade article from our blog here:

$FB Facebook Long Set-Up Testing Buy Sell Trigger #swingtrading (Public Edition)

During the last Facebook sell-off swing trade price plunged in to the 150’s and the article link takes the trade step by step from the low 160’s.

When this first set-up I alerted it a number of times in different ways on different platforms – I even texted people and sent private messages. I was screaming this from the rooftops..

As time goes on in your trading life you learn over and over again how this particular type of set-up has profit written all over it. The secret however, is knowing where your trading chart structure is in advance of trade getting to that area of restructuring after the wash-out. Knowing that is key.

STEP 1: Getting in to the Facebook trade in premarket or at market open tomorrow morning (Thursday July 26, 2018).

The chart below will help you with short time-frame entries to get your positioning right, get on the right side of the trade so that you can then leg in to a sizeable swing trade if you want from there forward (pending trading action in the morning).

My trading plan for Facebook will be to do exactly that, daytrade it in premarket tomorrow with the objective of getting some profit side room in the trade so that I can leg in to a more significant swing trading position.

I should note that considering the company’s guidance on the earnings call today that I do not expect the same ROI as the last trade we started in April of 2018.

Facebook (FB) “On the Fly” Facebook Daytrading Chart with buy sell triggers for premarket Thursday. $FB #facebook #chart

Member version of this report includes (in addition to a static chart) a link below to a live interactive Facebook daytrading chart on Trading View (with all technical levels).

Buy / sell triggers on the short time frame per chart (intended for short term daytrading):

164.55

169.36

174.12

178.90

Trading at close of after hours market 173.50.

https://www.tradingview.com/chart/FB/TaUcLmAc-Facebook-FB-On-the-fly-Facebook-Daytrading-Chart-with-buy-sell/

$FB, Facebook, daytrading, chart, technical, levels
Facebook (FB) On the fly Facebook Daytrading Chart with buy sell triggers for premarket Thursday. $FB #facebook #chart

The 167.50 notation on the chart above is in reference to a series of tweets I published on my personal Twitter feed when the earnings sell off was in motion as follows;

Watching $FB close now

Watching $FB close now

— Melonopoly (@curtmelonopoly) July 25, 2018

167.50 would be nice $FB

167.50 would be nice $FB

— Melonopoly (@curtmelonopoly) July 25, 2018

next magic

next magic

— Melonopoly (@curtmelonopoly) July 25, 2018

167.50 hit $FB

167.50 hit $FB

— Melonopoly (@curtmelonopoly) July 25, 2018

magic show restructure in progress $FB

magic show restructure in progress $FB pic.twitter.com/jOUbPr12IE

— Melonopoly (@curtmelonopoly) July 25, 2018

STEP 2: Long Daytrade and Swingtrading Time Frames.

FACEBOOK (FB) Trading Facebook wash-out on earnings. Trading levels for daytrading and swingtrading. $FB #daytrade #swingtrade #chart

Member version of this charting includes (in addition to a static chart) a link below to a live interactive Facebook daytrading / swingtrading chart on Trading View (with all technical levels including buy/sell triggers, MA’s, quad walls, Fibonacci support and resistance, price targets and more).

Trade toward price target trajectory between the Fibonacci resistance and support levels (paying attention to quad walls – Fib diagonal trendlines). Trim heavy at buy sell triggers and add above or below depending on your trending direction of trade.

https://www.tradingview.com/chart/FB/pw8JAyuz-FACEBOOK-FB-Trading-Facebook-wash-out-on-earnings-Trading-lev/

FB, daytrading, swingtrading, chart, technical, trading
FACEBOOK (FB) Trading Facebook wash-out on earnings. Trading levels for daytrading and swingtrading. $FB #daytrade #swingtrade #chart

Cheers!

Curt

Temporary Promo Discounts (for new members only).

Subscribe to Weekly Swing Trading Newsletter service here Reg 119.00. Promo Price 83.30 (30% off). Promo Code “30P”. 

Or Real-Time Swing Trading Alerts Reg 99.00. Promo Price 69.37 (30% off). Promo Code “Deal30”.

I personally guarantee our swing trading service is one of the best in the business and it’s very reasonably priced considering the technical expertise invested in the platform (Lead Trader).

Subscribe to Swing Trading Service:

Swing Trading Bundle (Swing Trading Newsletter and Live Swing Trading Alerts).

Swing Trading Newsletter (Weekly Newsletter Published for Traders).

Real-Time Swing Trading Alerts (Private Member only Twitter Feed).

One-on-One Trade Coaching (Via Skype or In-Person).

Free Mailing List(s):

Join Email List for Free Trade Charting Trade Set-ups, Deals, Podcasts and Public Webinars.

Free Swing Trading Periodical Contact Form (Complimentary Swing Trade Set-Ups to Email)

Public Chat:

Visit our Free Public Chat Room on Discord.

Follow Me:

Tweets by swingtrading_ct

Read More
PreMarket Trading Plan Wed July 25: Earnings, #EIA, OIL, $WTI, $RIOT, $TORC, $HMNY, $NVRO, $IRBT, GOLD, Crypto, $BTC , US Dollar, $DXY more.

PreMarket Trading Plan Wed July 25: Earnings, #EIA, OIL, $WTI, $RIOT, $TORC, $HMNY, $NVRO, $IRBT, GOLD, Crypto, $BTC , US Dollar, $DXY more.

July 25, 2018July 28, 2018 Curt MelonopolyTrading Plan#EIA, $BTC, $HMNY, $IRBT, $NVRO, $RIOT, $TORC, $WTI, Crypto, DXY, earnings, Oil, Plan, Premarket, Stocks, Trading, US Dollar, Watchlist

Compound Trading Premarket Trading Plan & Watch List Wednesday July 25, 2018. 

In this edition: Earnings, #EIA, OIL, $WTI, $RIOT, $TORC, $HMNY, $NVRO, $IRBT, GOLD, Crypto, $BTC , US Dollar, $DXY and more.

Welcome to the morning Wall Street trading day session at Compound Trading.

Notices:

Notes in red text in this report are more recently important.

July 24 Member Memo: Trading Coaching Boot Camp Prep, Machine Trading, Next Gen Models, Trade Alerts, Reporting, Swing Trading Earnings

Scheduled Events:

  • Wednesday July 25 – Live Trading Room with lead trader and/or other team members as follows and as available (constant change in the markets);
    • 9:25 Market Open – access limited to live trading room members
    • 10:30 EIA Report Oil Trading – access limited to live trading room / EPIC Oil Algorithm members
    • 12:00 Mid Day Trade Review – access limited to live trading room members
      • Any other live trading sessions will be notified by email.
      • The above listed times are expected live trading time blocks only. Live voice broadcast will only occur if there is a trade set-up to discuss by the lead trader. Screen sharing will be active through-out each time frame.
      • Link: https://compoundtrading1.clickmeeting.com/livetrading
      • Password: **** (email for access if you do not have it, password changes will be emailed when changed only)
      • For membership access, options here: https://compoundtrading.com/overview-features/
      • Any questions send me an email info@compoundtrading.com
  • July 25-26 – Weekly newsletter reporting and invoicing distributed to members (delayed this week due to next gen algorithms being integrated in to our trading platforms).
  • July 23-July 31 – Swing trading reports to include video chart analysis recaps for the 100 equities we cover (from mid day swing trading reviews) and sent to our subscribers daily in lieu of the weekly swing trading report (mailing list subscribers receive a complimentary version without algorithmic charting).
  • End of July – Next generation algorithm models roll out in to August 14, 2018 (machine trading Gen 1).
  • End of July – New pricing structure published representing next generation algorithm models (existing members no change).
  • End of July – Trading Profit and Loss Published for Q1 and Q2 2018 (a report detailing trading / alert performance of our team).
  • July 28 – 29, Santo Domingo – #IA Intelligent Assisted Platform (private, internship & staff training / development).
  • Aug 25 – 26, Santo Domingo – Oil Algorithm (EPIC) Multi-User License Trade Execution & Integration (private invitational, institutional).
  • Sept 14 – 16, Cabarete – Trade Coaching Event – Learn How to Trade or Take Your Trading to the Next Level (public, retail).

Machine Trading Coding Team Mandate: In current development and roll-out (1) Intelligent Assisted #IA Trading Platform (Code Algorithm Models), (2) Run 24 Hour Crypto Trading Desk, (3) Alert Trade Set-ups to Member Alert Feeds (for all models) and near future (4) Machine Learning. 

Premarket Report: On lead trader availability basis only (the premarket reports are not published every market day).

Private Member Discord Server Chat Rooms: BE SURE to get in to each private Discord server specific to your specific subscription type (bundles) – many of the updates as we go forward will be posted in there and detailed trading plans for alerted trades are often discussed by our lead trader in the rooms. This includes the SWING TRADING platform also. IF YOU NEED A LINK / INVITE email us.

https://twitter.com/CompoundTrading/status/880670140454637569

Real-time Trade Alerts:

Real-time Trade Alerts for Oil, Swing Trading, Day Trading, Bitcoin are available to subscribers by following specific alert Twitter feeds. Oil Trading Alerts, Swing Trading Alerts, Day Trading Alerts, Bitcoin Trading Alerts.

Disclaimer / Disclosure:

Subscribers must read disclaimer.

Recent Blog / Video / Social Posts: 

#BitcoinTrading 101: A Beginner’s Guide to Getting Started $BTCUSD $XBTUSD $BTC https://compoundtrading.com/bitcointrading-101-beginners-guide-getting-started-btcusd-xbtusd-btc/ …

https://twitter.com/CompoundTrading/status/927397024315662336

How to Use EPIC Oil Algorithm: $USOIL, $WTI, $CL_F, $USO, $UCO, $SCO, $UWT, $DWT, #OIL, #OOTT: http://youtu.be/hawVV31G9bg?a via @YouTube

https://twitter.com/CompoundTrading/status/889148655785177088

How to Use ROSIE Gold Algorithm: #GOLD, $GLD, $XAUUSD, $GDX, $GDXJ, $NUGT, $DUST, $JNUG, $JDST

https://twitter.com/CompoundTrading/status/889147527278333952

Recent Chart / Trade Set-Ups: 

See You Tube for other recent video posts. Listed from most recent.

Password: AR, Protected: Swing Trading Report (Members): Earnings Season Charting July 24 $RIOT, $CELG, $ARWR, $EXTR, $EDIT, $SOHU, $ESPR, $LPSN, $XOMA …

Password: WOW, Protected: Swing Trading Report (Members): Earnings Season Charting July 24 $SPY, OIL, $VIX, $DXY, $GOOGL, $HCLP, $ARRY, $ARWR, $CDNA, $XXII, $SSW

Unlisted Private Member Video – Swing Trading Special Report $CELG, $RIOT, $ARWR, $EXTR, $EDIT, $MBRX, $SOHU, $ESPR, $LPSN, $XOMA.

Unlisted Private Member Video – Swing Trading Special Report $SPY, OIL, $VIX, $DXY, $GOOGL, $HCLP, $ARRY, $ARWR, $CDNA, $XXII, $SSW

Unlisted Private Member Video – Swing Trading Set-ups Special Report; $VIX, $DXY, $SPY, $DIS, $RCL, $RKDA, $SQ, $HEAR, $TGTX, $SMIT

Password: DOL Protected: Swing Trading Report (Earnings Season Special Report) July 19: $VIX, $DXY, $SPY, $DIS, $RCL, $RKDA, $SQ, $HEAR, $TGTX, $SMIT and more.

“The Nut Hand” Today’s Huge Oil Trade Win. Exactly How It Was Done. How I Knew & How You Can Too.

How to Swing Trade Like the Pros and Win Most Trades. #swingtrading #freedomtraders

Password: IC Protected: How to Trade Allergan (AGN) Stock Move (Exclusive) $AGN #swingtrading #daytrading #chart

FITBIT INC CLASS A (NYSE: FIT). How to Trade FitBit for 40% Gain (Member Exclusive) $FIT #swingtrading #daytrading #chart

Password: TRADEAAPL Protected: Trading Apple’s Stock Move (Member Exclusive) $AAPL #swingtrading

Password: SWINGDXY, Protected: Trading US Dollar Index (Part 2 – Member Exclusive) $DXY $UUP #USD #SwingTrading #Daytrading

Password: swing Protected: Trade Set-Ups w/ Video #EIA, Oil, $TSLA, $NFLX, $ESPR, $PG, $AAPL, $SPY, $CARA, $EGY, $GERN, $BPT more. #swingtrading

CRITICAL Oil Trade. Weekly Timing. EPIC Oil Algorithm Channel $USOIL $WTI $CL_F $USO #OilTrading #EIA

Feature Post with Charting: How to Trade the US Dollar Index Move (Part 1) $DXY $UUP #USD #trading #chart #algorithm https://compoundtrading.com/feature-post-with-charting-how-to-trade-the-us-dollar-index-move-part-1-dxy-uup-usd-trading-chart-algorithm/

Charts, Video and Summary of Swing Trade Set-ups May 21, 2018 $PSTG, $ITCI, $AAPL, $SPY, $NFLX, $PG, $BOXL, $TRXC more.

Feature Post: 12 of Last 13 Oil Chart Time-Cycles Have Trend Reversal. $USOIL $WTI $CL_F $USO $UCO $UWT $DWT #OIL #OOTT

Password: SET Protected: Swing Trade Set-Ups (May 15/16 Member Edition) $WTI, #OIL, $BTC, Bitcoin, $AMBA, $AMD, $BLNK, $ITCI,, $SPY, $DIS, $LAC, $BOX, $AAOI more.

Password: AI Protected: How to Trade Pure Storage Earnings in Six Days (Member Edition) $PSTG

Password ITCI: Protected: Trade Set-Ups (May 14 /15 Member Edition) $BOX, $ITCI, $SPY, $EEM, $PFE, $BTC, Bitcoin, SILVER, $SLV, $ETH, Ethereum, $EOG, $EDIT, $EXP more.

Password: WOW Protected: How to Trade Box Earnings Move (Swing Trade Member Exclusive)

Recent Educational Articles / Videos:

I get a lot of Q’s on How to Trade our models, this vid has 5 min explanation at 1:00 min-6:00 min. https://www.youtube.com/watch?v=QrXbE7lojAg&t=3s … – Fib Trendlines, Trading structure/quads, Price targets, Main support resistance (buy sell triggers), Time cycles, Moving averages, Trading trims/adds.

I get a lot of Q's on How to Trade our models, this vid has 5 min explanation at 1:00 min-6:00 min. https://t.co/oqezvVcn0y … – Fib Trendlines, Trading structure/quads, Price targets, Main support resistance (buy sell triggers), Time cycles, Moving averages, Trading trims/adds.

— Melonopoly (@curtmelonopoly) May 13, 2018

Trading Plan (Buy, Hold, Sell) Watch Lists. Morning Momentum / Gap / News / PR / IPO / SEC Filings / Earnings Stocks on Watch: 

Stocks making the biggest moves premarket: KO, GM, BA, FCAU, UPS & more –

Stocks making the biggest moves premarket: KO, GM, BA, FCAU, UPS & more – https://t.co/NbxGklLWAH

— Melonopoly (@curtmelonopoly) July 25, 2018

Market Observation:

Markets as of 8:14 AM: US Dollar $DXY trading 94.49, Oil FX $USOIL ($WTI) trading 68.57, Gold $GLD trading 1232.14, Silver $SLV trading 15.59, $SPY 281.18, Bitcoin $BTC.X $BTCUSD $XBTUSD 8227.00 and $VIX trading 12.6.

Momentum Stocks to Watch:  $RIOT, $TORC, $HMNY, $NVRO, $IRBT 

$TORC ResTORbio’s stocks rockets on positive trial results, just as post-IPO lock up expires https://on.mktw.net/2JQ23Sh

$TORC Short % of Float (Jun 14, 2018) 419.52%

ResTORbio’s stocks rockets on positive trial results, just as post-IPO lock up expires

https://finance.yahoo.com/m/e699fe4a-1480-37f0-a696-37019717beba/restorbio%26apos%3Bs-stocks.html?.tsrc=rss

News: 

MoviePass parent Helios and Matheson implements 1-to-250 reverse stock split, boosting share price

$RUBY Rubius Therapeutics (RUBY) Agrees to Acquire Manufacturing Facility in Smithfield, Rhode Island

$TEUM: Pareteum Awarded $3 Million 5-Year Contract in North Africa

$CYTR CytRx Announces Centurion BioPharma Corporation’s Filing of a Provisional Patent Application.

$CHFS Department of Veterans Affairs Awards a $6.5 million Blanket Purchase Agreement to CHF Solutions to Supply Aquadex FlexFlow System for Outpatient Services in Tampa, Fla.

Recent SEC Filings:

Insider Buys Of The Week: BlackRock, Dish Network, Walgreens https://benzinga.com/z/12054592 $BLK $DISH $WBA

Recent IPO’s:

Biotech Allakos prices IPO at $18, above price range

$RUBY 10.3M shares at $23 and $CRNX 6m shares at $17

$CRNX Crinetics Pharmaceuticals prices IPO at $17 a share

The IPO Outlook For The Week: Tech & International Exposure https://benzinga.com/z/12052697 $AQST $BE $BRY $JG $CANG $FOCS $PDD $TENB $DAVA $OPRA

The IPO Outlook For The Week: Tech & International Exposure https://t.co/A0rfpmunIn $AQST $BE $BRY $JG $CANG $FOCS $PDD $TENB $DAVA $OPRA https://t.co/Hrc0OwWq24

— Melonopoly (@curtmelonopoly) July 22, 2018

Earnings: 

Freeport-McMoRan’s stock jumps after earnings and revenue rose above expectations

Hawaiian Holdings +5% after earnings, upgrade https://seekingalpha.com/news/3373389-hawaiian-holdings-plus-5-percent-earnings-upgrade?source=feed_f … #premarket $HA

Norfolk Southern rides higher after earnings https://seekingalpha.com/news/3373399-norfolk-southern-rides-higher-earnings?source=feed_f … #premarket $NSC

StockTwits Earnings to Watch

Tue – $T $VZ $LMT $JBLU $BIIB $IRBT $MMM $LLY $TXN

Wed – $FB $AMD $F $GILD $PYPL $V $BA $HM $KO $ABX

Thu – $AMZN $INTC $SBUX $CMG $FSRL $SPOT $MCD

Fri – $TWTR $XOM $ABBV $CVX

Via @StockTwits

#earnings for the week

$AMZN $AMD $FB $TWTR $GOOGL $BA $T $V $INTC $LRCX $HAL $LMT $PYPL $MA $VZ $MMM $CELG $MCD $HAS $F $ABBV $XOM $SBUX $BIIB $KO $AAL $PETS $ALGN $CMG $GRUB $RTN $UAA $GILD $NTGR $UTX $HOG $WDC $AMTD $NOK $DGX $UPS $JBLU $GM $CVX

http://eps.sh/cal

#earnings for the week$AMZN $AMD $FB $TWTR $GOOGL $BA $T $V $INTC $LRCX $HAL $LMT $PYPL $MA $VZ $MMM $CELG $MCD $HAS $F $ABBV $XOM $SBUX $BIIB $KO $AAL $PETS $ALGN $CMG $GRUB $RTN $UAA $GILD $NTGR $UTX $HOG $WDC $AMTD $NOK $DGX $UPS $JBLU $GM $CVX https://t.co/r57QUKKDXL https://t.co/rFjdIyBH0d

— Melonopoly (@curtmelonopoly) July 22, 2018

Trade Set-up Alerts, Charts & Reports. Recent / Current Holds, Open and Closed Trades:

Please refer to the date at top left of each chart (charts are often carried forward for sometime).

$TORC Premarket up 142% trading 21.79 on lock up exp, results, short interest. $TORC #daytrading

$TORC, premarket, trading, plan, daytrading
$TORC Premarket up 142% trading 21.79 on lock up exp, results, short interest. $TORC #daytrading

The $RIOT daytrade from yesterday went well: 7.30s – 8.40s nice mover and returns.

Working well #daytrading #towin $RIOT #blockchain pic.twitter.com/CyaVAM35UB

— Melonopoly (@curtmelonopoly) July 24, 2018

Arrow Pharmaceuticals (ARWR) Over mid quad resistance. Long side bullish bias. $ARWR #swingtrading #earnings

$ARWR, earnings, swing trading, chart
Arrow Pharmaceuticals (ARWR) Over mid quad resistance. Long side bullish bias. $ARWR #swingtrading #earnings

ALPHABET (GOOGLE) Trading over main resistance pivot 1211.60 intra 1262.34 on earnings 1318.52 price target. $GOOGL #swingtrading

$GOOGL, ALPHABET, stock, chart, swingtrading, earnings
ALPHABET (GOOGLE) Trading over main resistance pivot 1211.60 intra 1262.34 on earnings 1318.52 price target. $GOOGL #swingtrading

ARROWHEAD Pharna (ARWR) Took first long side entry today on swing trade over mid quad pivot $ARWR

$ARWR, swing trade, alert, chart
ARROWHEAD Pharna (ARWR) Took first long side entry today on swing trade over mid quad pivot $ARWR

EDITAS MEDICINE (EDIT) Keeps hitting mid channel targets on chart testing 200 MA $EDIT #pricetargets #chart

$EDIT, swing, chart, trade, symmetry
EDITAS MEDICINE (EDIT) Keeps hitting mid channel targets on chart testing 200 MA $EDIT #pricetargets #chart

Celgene (CELG) trading 86.81 with earnings in one day at quad wall resistance over mid quad support $CELG

CELG, chart
Celgene (CELG) trading 86.81 with earnings in one day at quad wall resistance over mid quad support $CELG

RIOT BLOCKCHAIN (RIOT) over 200 MA on 240 Min chart closed 8.40 with trade entries 7.30s today. #trading $RIOT

$RIOT, blockchain, chart trade
RIOT BLOCKCHAIN (RIOT) over 200 MA on 240 Min chart closed 8.40 with trade entries 7.30s today. #trading $RIOT

Goldman warns of liquidity-fueled sell-off after ‘volmageddon’ https://bloom.bg/2v1ggWS

Goldman warns of liquidity-fueled sell-off after ‘volmageddon’ https://t.co/qtnhhrvPmk pic.twitter.com/jWDcwkA9O6

— Bloomberg Markets (@markets) July 24, 2018

MACD still trending down on daily oil chart with price above 100 MA under 20 and 50. #OIL $USOIL $WTI

MACD, Daily, Oil, Chart
MACD still trending down on daily oil chart with price above 100 MA under 20 and 50. #OIL $USOIL $WTI

Bitcoin trading like a conventional equity now. Launched off 50 MA testing 100 MA resistance soon. $BTCUSD $BTC #Bitcoin #premarket https://twitter.com/CryptotheAlgo/status/1019561358600409088

Bitcoin, chart, BTC
Bitcoin trading like a conventional equity now. Launched off 50 MA testing 100 MA resistance soon. $BTCUSD $BTC #Bitcoin #premarket

US Dollar Index (DXY) Chart. Perfect move from structure to structure at resistance now to next possible. $DXY $UUP #USD #swingtrading #dollar

US Dollar, algorithm, chart
US Dollar Index (DXY) Chart. Perfect move from structure to structure at resistance now to next possible. $DXY $UUP #USD #swingtrading #dollar

Gold chart (Daily) MACD may cross up here at previous December low support test. #GOLD #CHART $GC_F $XAUUSD $GLD

Gold, Daily, MACD, Chart
Gold chart (Daily) MACD may cross up here at previous December low support test. #GOLD #CHART $GC_F $XAUUSD $GLD

Gold chart monthly – trade sitting on 50 MA test and under bottom trendline. #Gold #Chart $GLD $XUAUSD $GC_F

Gold, Chart, 50 MA, Support test
Gold chart monthly – trade sitting on 50 MA test and under bottom trendline. #Gold #Chart $GLD $XUAUSD $GC_F

SILVER likely to get a bounce at pivot area to test underside of diagonal trend line #onwatch

SILVER, Weekly, chart
SILVER likely to get a bounce at pivot area to test underside of diagonal trend line #onwatch

ALLERGAN (AGN). Excellent swing trade in progress trading 177s targets 180.21 184.21 189.03 etc. $AGN #chart

AGN, swing trade
ALLERGAN (AGN). Excellent swing trade in progress trading 177s targets 180.21 184.21 189.03 etc. $AGN #chart

NETFLIX (NFLX) Triggering long in premarket over 400.00 targets 412.00 then 422.00 a key range pivot resistance. $NFLX #swingtrading

NFLX, swing, trade, premarket
NETFLIX (NFLX) Triggering long in premarket over 400.00 targets 412.00 then 422.00 a key range pivot resistance. $NFLX #swingtrading

CITIGROUP INC (C) Keeps working that support line. No bias here. Watching. $C #stock #chart

$C, CITIGROUP, Chart
CITIGROUP INC (C) Keeps working that support line. No bias here. Watching. $C #stock #chart

EAGLE BUILDING MATERIALS (EXP) Trading 111.05 trending toward 117.75 Nov 2, 2018 price target. $EXP #swingtrading

Eagle, chart
May 20 – EAGLE BUILDING MATERIALS (EXP) Trading 111.05 trending toward 117.75 Nov 2, 2018 price target. $EXP #swingtrading

FACEBOOK (FB) swing trade on schedule and target trading 201.15 – over 201.80 bullish targets 202.41 206.58 main 209.97 June 21 or July 6 $FB #swingtrading

$FB, chart
FACEBOOK (FB) swing trade on schedule and target trading 201.15 – over 201.80 bullish targets 202.41 206.58 main 209.97 June 21 or July 6 $FB #swingtrading

Market Outlook, Market News and Social Bits From Around the Internet:

Your Wednesday morning Speed Read:

– Former Fiat Chrysler CEO Sergio Marchionne has died $FCAU
– Thermo Fisher’s Q2 earnings and revenues top estimates, as the consultant raises its FY18 overlook $TMO
– Bitcoin takes a breather after breaching $8K psychological level $BTC

https://twitter.com/Benzinga/status/1022065207198269440

Stunning correlation between the 10-year and S&P 500 could point to new highs for stocks https://cnb.cx/2NIFSQ8

Stunning correlation between the 10-year and S&P 500 could point to new highs for stocks https://t.co/e6eashKEIe pic.twitter.com/hg6KAg16Rz

— CNBC International (@CNBCi) July 25, 2018

If you are new to our trading service you should review recent blog posts, the Compound Trading YouTube Channel and at minimum our algorithm Twitter feeds because they do tell a story in terms of the market and how the inflections of the market determine our day to day trading. You will notice the algorithmic modelling has been undeniably accurate with many time-frames (intra-day, weeks and months out) so I myself have learned to respect the math (they have taken me from a 60% hit rate to 80%+ all publicly posted live trade alerts).

Momentum Stocks (Market Open and Intra-Day):

I do trade morning momo stocks, but I do avoid much of the day trading risk (preferring to daytrade only what is structurally set-up also on the swing trade side and to my advantage in the algorithmic model charting). I often avoid the first 30 minutes (gap and go) and trade momentum stocks or structured (per explanation in previous sentence) stocks later in day after a wash-out looking for a snap-back trade that can possibly also become a strong swing or longer term trade that I can leg in to. Just prior to open and shortly after open I post momentum stocks to the trade chat room (and Twitter and Stocktwits if I have time).

Some of my Favorite Intra-day Trading Set-Ups:

(1) Momentum Stock Wash-Outs for Snap Back, (2) Bad News Wash-outs on Stocks with High Institutional Ownership, (3) Getting on the Right Side of a Trend Change and scaling in my position and (4) Our Algorithm Charting Model Set-Ups.

The momentum stocks (from previous days and morning trade) I continue to watch through the day for indicators that allow a trade.

Morning Stock Watch-Lists for my Favorite Set-Ups:

(1) Pre-Market Gainers Watch-List: $TORC $CRMD $NVRO $CODX $IRBT $VICR $AUDC $RETA $TRVN $HA $TVIX $TKC $UVXY $CEI $GLW $DTE $VXX $USLV

(2) Pre-market Decliners Watch-List :

(3) Other Watch-List:

(4) Regular Algo Charting Watch-List: Gold $GC_F $GLD, Miners $GDX ($NUGT, $DUST, $JDST, $JNUG), Silver $SLV $SI_F ($USLV, $DSLV), Crude Oil FX: $USOIL $WTI ($UWT, $DWT, $USO, $UCO, $CL_F, $UWT, $DWT), Natural Gas $NG_F ($UGAZ, $DGAZ), S & P 500 $SPY $ES_F ($SPXL, $SPXS), US Dollar Index $DXY ($UUP), Volatility $VIX ($TVIX, $UVXY), $BTCUSD Bitcoin.

(5) Recent Upgrades:

$NBIX PT raised to $122 from $100 at Baird.

W.R. Berkley $WRB PT Raised to $78 at RBC Capital

TD Ameritrade $AMTD PT Lowered to $60 at Morgan Stanley

Texas Instruments $TXN PT Raised to $113 at Morgan Stanley

$BIIB PT raised to $348 at Baird.

$RETA PT raised to $185 from $95 at Citi, added to US Focus List.

IQVIA Holdings $IQV PT Raised to $143 at Baird

Needham & Company Remains Bullish on G-III Apparel Group $GIII As Ivanka Trump Closes Fashion …

Rockwell Automation +3.5% on guidance boost https://seekingalpha.com/news/3373390-rockwell-automation-plus-3_5-percent-guidance-boost?source=feed_f … #premarket $ROK

Centene $CNC PT Raised to $152 at Piper Jaffray

Kimbell Royalty Partners LP $KRP PT Raised to $26 at RBC Capital

(6) Recent Downgrades:

Stay tuned in Stock Chat Room for more pre-market stocks on watch.

Study:

For new readers, a review of our unlocked posts on our blog would help you get in to the story we are following with the securities listed in this newsletter.

Free scanners to find momentum stocks that you can easily review charts of for indicators that bring probability of your trade being successful up considerably. These are not useful for first 30 minute market open gap and go type plays (you need a good momentum scanner, level 2, and best to have hot-keys for the first 30 mins of gap and go trading)… but are very useful for intra day scalping and swing trading (start with trending stocks and then look at indicators intra for simple set-ups – study scan study scan study scan).

http://finviz.com/

https://finance.yahoo.com/screener/predefined/ec5bebb9-b7b2-4474-9e5c-3e258b61cbe6

http://www.highshortinterest.com/

http://www.gurufocus.com/short-stocks.php

http://www.3xetf.com/all/

http://www.etf.com/channels/gold-etfs

GL!

Curtis

Algorithm Twitter feeds can be found here: $BTC (@CryptotheAlgo) $WTI (@EPICtheAlgo), $VIX (@VexatiousVIX), $SPY (@FREEDOMtheAlgo), $GLD (@ROSIEtheAlgo), $SLV (@SuperNovaAlgo), $DXY (@DXYUSD_Index). Our Swing Trading Twitter feed is found here: https://twitter.com/swingtrading_ct. Our lead trader Twitter feed is here @curtmelonopoly

Article Topics: Premarket, Watchlist, Stocks, Trading, Plan, Earnings, #EIA, OIL, $WTI, $RIOT, $TORC, $HMNY, $NVRO, $IRBT, GOLD, Crypto, $BTC , US Dollar, $DXY

Read More
Swing Trading Report (Members): Earnings Season Charting July 24 $RIOT, $CELG, $ARWR, $EXTR, $EDIT, $SOHU, $ESPR, $LPSN, $XOMA …

Swing Trading Report (Members): Earnings Season Charting July 24 $RIOT, $CELG, $ARWR, $EXTR, $EDIT, $SOHU, $ESPR, $LPSN, $XOMA …

July 24, 2018December 30, 2018 Swing TraderSwing Trading$ARWR, $CELG, $EDIT, $ESPR, $EXTR, $GTHX, $IPI, $LPSN, $MBRX, $PDLI, $RIOT, $SOHU, $WTI, $XOMA, DXY, Oil, SPY

Special Earnings Season Swing Trading Report and Video for July 24, 2018 (Part B).

In this Edition:    and more.

What’s New!

  • Interested in free swing trading setups? Click here to sign up for the Complimentary Swing Trading Report Mailing List.
  • Now available for serious traders – Legacy All Access Membership.

The Mid Day Trade Set-Ups Video:

Trade set-ups on this video; OIL, $WTI, $SPY, $DXY, $CELG, $RIOT, $ARWR, $GTHX, $EXTR, $EDIT, $IPI, $MBRX, $SOHU, $PDLI, $ESPR, $LPSN, $XOMA and more. 

Mid Day Chart Swing Trading Set-ups July 24, 2018 Summary:

July 24 Swing Trading Special Earnings Season Report (member version) that will become the premise for our next major entries.

Stocks reviewed on this 2nd video in the series for earnings: OIL, $WTI, $SPY, $DXY, $CELG, $RIOT, $ARWR, $GTHX, $EXTR, $EDIT, $IPI, $MBRX, $SOHU, $PDLI, $ESPR, $LPSN, $XOMA.

We are reviewing all one hundred equities we have in coverage on our swing trading platform – all over the next ten days or so for earnings trading season.

This is from June 24 report cycle (last time these equities were reported to members) and now reviewed July 24, 2018. Members can refer to that report for charting to reference in the video (if not included below).

OIL $WTI – Looking for a sizeable entry at decision on the resistance on-deck trading 68..81. Waiting on the decision either side of resistance.

$SPY SP500 – Near target hit in time frame from yesterday’s video alert long trigger over 281 ish and came close to price target 282.46. Missing most bullish target but close. 283.80 next resistance, then 285.24. Intra day support 281.10 main support 278.64 for quad trading range Aug 2. 289.07 Aug 2 bullish scenario targets 294.25 then 299.53 in the model.

US Dollar $DXY – main pivot 94.54 in this structure and trading intra day just above. 96.50 – 97 is upside bullish target if price gets over light blue downtrending TL line. Trading channels are also discussed on video as is lower support.

$CELG – 87.84 resistance at quad wall (down trending TL Fibonacci) upside targets if it runs 86.12 88.70, 91.60 96.10 July 25. Earnings in two days.

$RIOT – entries 7.30s to 7.60s ish today and released on its way up in to the 8s. Fantastic day trade. Swing trading most bullish price target resistance 9.70s.

$ARWR – Earnings 14 days trading 16.61 intra day, took a first 30% sizing trade on a swing long a little higher on the day. 16.25 main support. Will add on pullbacks at supports discussed in video. Low 20s is the price target range. Trading plan scenarios for upside and downside trade are discussed on video and sizing for each scenario.

$GTHX – Trade is at mid quad primary range resistance so a decision is near. 49.01 is buy side trigger if it holds on any given day at close. Main support 44.40 in structure. Pull back buy triggers are discussed on video.

$EXTR – Indicators are up but Stoch RSI is really high, short side alert worked, Sept 5th 7.16 lower price target in sell-off, support test at 8.49 trading 8.78. Earnings 15 days. If it gets bullish 9.29 resistance with 9.95 bullish target Sept 5 and I would be very cautious.

$EDIT – Algorithm model trade is predictable hitting price targets through the channel. Intra sitting on mid quad support and 200 MA. Channel in chart. Symmetry is excellent. Downside support is 30.53 quad wall intra, 28.00 support in sell off and 25.55 support. 27.93 price target Sept 29 in a downside. Trading plan discussed in video and how it should trade through the channel.

$IPI Intrepid Potash – 200 MA upside resistance on weekly chart. Would be nice to see MACD down and turn for an entry. Alarming chart for a possible breach of 200 MA to upside.

$MBRX – Main pivot 2.46 has held and this is a fantastic short each time it gets in that area of resistance.

$SOHU – Long long term trend is down, MACD trending down, earnings on deck in 6 days. Iffy chart, I would be cautious with this one.

$PDLI – Short side worked, we never did see buy trigger hit in dump, resistance areas for upside 2.92 3.05 3.21. Earnings in 12 days. Over 200 MA I may be interested in a trade.

$ESPR – Wash-out was an okay trade set up, MACD is about to turn up on the weekly structure, Stoch RSI is turned up. It is above 200 MA. Looking better. 49.60 main resistance trading 43.35. 20 50 MA weekly will be next resistance after 49.60. Trade trigger over 44.63 is a serious look.

$LPSN LivePerson – Indicators are all up, earnings in 8 days, bulls have bought in to earnings, main resistance 25.10 ish and support around 20.40 and trading 24.35 intra. Watching for a break over 25.10 ish. Not interested in a pull back buy unless it got to 20 MA. Watch the main resistance 25.90. Mid pivot main 23.50 (trading right above intra day).

$XOMA – Trade below bottom target, trading at main pivot intra day, not sure which direction it will take. Likely see some upside but unsure, 26.70 is main buy zone consideration. Will review then.

Charts and Chart Links for Member Version Only

(Mailing list versions that may be made available from time to time do not include charting or chart links).

For charts that are not included below but are on the video, members can refer to most recent swing trading report that has the chart and/or chart link.

ARROWHEAD Pharna (ARWR) Took first long side entry today on swing trade over mid quad pivot $ARWR

$ARWR, swing trade, alert, chart
ARROWHEAD Pharna (ARWR) Took first long side entry today on swing trade over mid quad pivot $ARWR

EDITAS MEDICINE (EDIT) Keeps hitting mid channel targets on chart testing 200 MA $EDIT #pricetargets #chart

$EDIT, swing, chart, trade, symmetry
EDITAS MEDICINE (EDIT) Keeps hitting mid channel targets on chart testing 200 MA $EDIT #pricetargets #chart

Celgene (CELG) trading 86.81 with earnings in one day at quad wall resistance over mid quad support $CELG

CELG, chart
Celgene (CELG) trading 86.81 with earnings in one day at quad wall resistance over mid quad support $CELG

RIOT BLOCKCHAIN (RIOT) over 200 MA on 240 Min chart closed 8.40 with trade entries 7.30s today. #trading $RIOT

$RIOT, blockchain, chart trade
RIOT BLOCKCHAIN (RIOT) over 200 MA on 240 Min chart closed 8.40 with trade entries 7.30s today. #trading $RIOT

Register to free email list for trade set-ups, webinars, special events: https://compoundtrading.com/contact/

Website: https://compoundtrading.com

Free chat room: https://discord.gg/2HRTk6n

Subscribe: https://compoundtrading.com/overview-…

Twitter: https://twitter.com/CompoundTrading

Lead Trader: https://twitter.com/curtmelonopoly

Tradingview: https://www.tradingview.com/u/curtmel…

Facebook: https://www.facebook.com/compoundtrad…

StockTwits: https://stocktwits.com/compoundtrading

Email: https://info@compoundtrading.com

Compound Trading Platform: Algorithm model charting for $SPY, $VIX, #OIL, #GOLD, #SILVER, #Crypto ($BTC Bitcoin, $ETH, $LTC, $XRP,) $DXY US Dollar and Swing Trading Newsletter. Live trading rooms for daytrading and oil traders. Private coaching and live alerts.

Read More
Swing Trading Report (Mailing List): Earnings Season Charting July 24 $SPY, OIL, $VIX, $DXY, $GOOGL, $HCLP,  $ARRY, $ARWR, $CDNA, $XXII, $SSW

Swing Trading Report (Mailing List): Earnings Season Charting July 24 $SPY, OIL, $VIX, $DXY, $GOOGL, $HCLP, $ARRY, $ARWR, $CDNA, $XXII, $SSW

July 24, 2018July 24, 2018 Swing TraderGeneral Complimentary Newsletters, Swing Newsletters$ARRY, $ARWR, $CDNA, $GOOGL, $HCLP, $SSW, $XXII, Chart, DXY, earnings, Oil, Setups., SPY, Swing Trading, VIX

Special Earnings Season Swing Trading Report and Video for July 24, 2018 (Mailing list version).

In this Edition:  $SPY, OIL, $VIX, $DXY, $GOOGL, $HCLP, $ARRY, $ARWR, $CDNA, $XXII, $SSW   and more.

What’s New!

  • Interested in free swing trading setups? Click here to sign up for the Complimentary Swing Trading Report Mailing List.
  • Now available for serious traders – Legacy All Access Membership.

The Mid Day Trade Set-Ups Video:

Trade set-ups on this video; $SPY, OIL, $VIX, $DXY, $GOOGL, $HCLP, $ARRY, $ARWR, $CDNA, $XXII, $SSW and more. 

Mid Day Chart Swing Trading Set-ups July 23, 2018 Summary:

Swing Trading Special Earnings Season Reports that will become the premise for our next major entries.

SORRY ABOUT THE ALLERGIES / COUGHS – I sincerely apologize.

You will want follow along with this special series of videos because our alerts in the first part of the year were huge and you can verify by reviewing the feed and we plan to kill the second part of the year!

Stocks reviewed on this video: $SPY, OIL, $VIX, $DXY, $GOOGL, $HCLP, $ARRY, $ARWR, $CDNA, $XXII, $SSW

We are reviewing all one hundred equities we have in coverage on our swing trading platform – all over the next ten days or so for earnings trading season.

The video is slow because the models need to load and alarms along with swing trading plan has to be reviewed for each chart.

The audio is poor on this specific video – hopefully we have that solved for Tuesday video.

$SPY – 60 Min Chart, support 278.60, trading 279.99, upside 281.00 resistance, downside 276.17 downside support. 283.80 24th 9 am 178.60 same day is bearish scenario.

$VIX Volatility – Stoch RSI starting a pinch up, MACD is starting a bottom, time cycle completion this week. Possible inflection point to Dec 24 time cycle completion. If we don’t see one then the Dec 24 time completion is a very high probability. Oct 8 min 20s price target.

US Dollar $DXY – Hit resistance on current structure (at light blue downtrend line). Testing 20 MA support and resistance (light blue MA on chart). Over main structure resistance has PT 97.76 Sept 14 if it gets up over.

Oil $WTI $USOIL – Upside momentum starting on the day.

$GOOGL – Hit 1210.85 1256.83 – 1261.50 is first upside resistance then 1284.53 area. 1320.00 is largest structure resistance for long side swing trading. 1150.00 – 1164.62 next support with 1103.02 is primary structure support for downside risk.

$HCLP – High Crush watching close on monthly for potential big move. 17.05 resistance, 16.50 to 17.05. Previous highs 21 – 22 possible. Double extension also possible if it got bullish to 25s. It could easily double its extension. If a pull back happens when price is above 20 and 50 MA and 20 MA breaches the 50 (with price above) that is a serious bullish set up. Don’t ignore this set up.

$ARRY – Indecisive. Earnings in 18 days.Gen 1 algorithm chart reviewed.

Learn to trade to win – Structured trading is reviewed at this point in the video starting at 16:00 mins. Trading quadrants, Fibonacci support and resistance, trading by numbers, time frames, quadrant trend line support and resistance, buy sell triggers for swing trades, how to and where to follow trends, natural trading structure etc.

$ARWR – Reports in 13 days, if it gets bullish it can get serious. The structure is aggressive. Some trade coaching / complaining rants here too.16.45 Nov 23 sideways PT, 32.87 Nov PT healthy side target, should continue to trend. Paint by numbers trading in the structure. 19.73 Aug 15 is most likely scenario pending earnings of course. All decisions are on the chart.

$CDNA – No model charting, but the pivot we identified worked well after the alert.

$XXII – more trading structure knowledge if you need to get from red to green with your trading. Upside and downside buy sell triggers discussed on video.

Oil Trade – the price target for 3:30 on Monday did hit per the video and a leg in long would have worked well, we did not execute but the trading plan reviewed on the video would have been an excellent trade.

$SHOP – testing previous highs 173.21 trading intra, great trade last session in dump long and it was fantastic. Entry points on a break out squeeze and a pull back are discussed. Earnings in 8 days.

$SSW – has been a fantastic chart structure for our trading. 5.16 buy sell trigger, 8.51, 11.94 for example – they are explained on the weekly chart for SSW. Chart structure is explained.

$ITCI – we nailed this trade on this structure and it was one of our best the year to date. In a social search of that time we were the only ones alerting it and talking about it. Huge win. ITCI hit price targets perfect. Trade set up reviewed on video.

$SENS – 240 Min chart MACD crossing up, SQZMOM trending up, buys coming in, bounced off 100 MA hit quad wall perfect, don’t ignore this one, it has serious return when it gets going, it is getting set up. Over 4.28 and quad wall this has horsepower for a great return 5.47 PT then 5.82.

Charting and chart models are only included in the swing trading member reports. This is a free mailing list report and video only.

Cheers!

Curt

Temporary Promo Discounts (for new members only).

Subscribe to Weekly Swing Trading Newsletter service here Reg 119.00. Promo Price 83.30 (30% off). Promo Code “30P”. 

Or Real-Time Swing Trading Alerts Reg 99.00. Promo Price 69.37 (30% off). Promo Code “Deal30”.

I personally guarantee our swing trading service is one of the best in the business and it’s very reasonably priced considering the technical expertise invested in the platform (Lead Trader).

Subscribe to Swing Trading Service:

Swing Trading Bundle (Swing Trading Newsletter and Live Swing Trading Alerts).

Swing Trading Newsletter (Weekly Newsletter Published for Traders).

Real-Time Swing Trading Alerts (Private Member only Twitter Feed).

One-on-One Trade Coaching (Via Skype or In-Person).

Free Mailing List(s):

Join Email List for Free Trade Charting Trade Set-ups, Deals, Podcasts and Public Webinars.

Free Swing Trading Periodical Contact Form (Complimentary Swing Trade Set-Ups to Email)

Public Chat:

Visit our Free Public Chat Room on Discord.

Follow Me:

Tweets by swingtrading_ct


Read More

Posts navigation

Older posts
Newer posts
Proudly powered by WordPress | Theme: sharksdesign by reviewexchanger.
 

Loading Comments...