Good morning swing traders and welcome to the Compound Trading Swing Trading Keep It Simple K.I.S.S. Charting Review (Public Edition) for the week of March 19, 2017! This edition focuses on MACD, Stochastic RSI, Moving Averages and a few others.
Email us at [email protected] anytime with any questions about any of the swing trades listed below. Or, if we get bogged down private message Curtis in trade room or direct message him on Twitter. Market hours are tough but we endeavor to get back to everyone after market each day.
Notices:
Members please refer to the member publications for more detail.
Introduction:
My perspective of the markets can be summarized as go long when you can until it breaks (and I do believe there is a break on the horizon but it doesn’t do you any good to wait around for corrections).
Understanding what the simple indicators are for the entry and exit in your trading position in a swing trade is critical – proper entries and exits can not only increase your win rate but also significantly impact your personal investment portfolio return on investment, thus a critical discipline to at least become moderately familiar. The buy and hold concept has served investors moderately well for some time, but even so, they could have do so much better with very little time invested.
Click here also to review our most recent Swing Trading Quarterly Performance Report.
Thanking you in advance.
This Week’s Simple Charts include MACD, Moving Averages (MA), Stochastic RSI and a custom Squeeze Momentum Indicator for the US Dollar, Volatility, Gold, Miners, Silver, Crude Oil and the S&P 500. Daily charts with some 60 min perspectives.
Simple Charting $SPY MACD turned down (green buy, red sell), Stoch RSI Pinch, SQMOM turning down, under 20 MA. $SPXL $SPXS #SwingTrading
On the daily MACD says it’s on a sell but Stoch RSI on a buy. Wait for MACD to confirm.

Simple Charting $SPY 60 Min MACD turned down (green buy, red sell), Stoch RSI Pinch, SQMOM turned down, on 200 MA. $SPXL $SPXS #DayTrading
Hourly $SPY MACD is on sell, Stoch RSI looks confused and price is testing the 200 MA. #caution SQZMOM turned way down also.

Simple Charts $DXY MACD down (green buy, red sell), Stoch RSI down, SQMOM down, under 20 50 100 MA pinch. $UUP $USD #SwingTrading
Daily MACD on sell, Stoch RSI on sell, BUT the 50 MA is pinching 20 MA – wait for MACD to confirm long and price above MA’s.

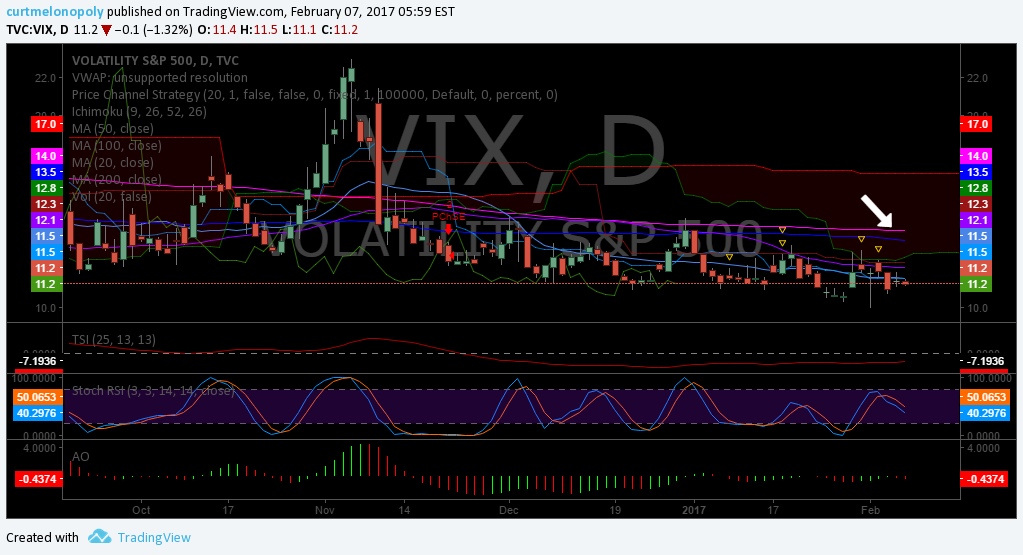
Simple Charts $VIX MACD flat (green buy, red sell), Stoch RSI down, SQMOM flat, under 20 50 100 200 MA. $UVXY $TVIX $XIV
Daily says volatility is dead. Wait. Even the stochastic RSI is turned down.

Simple Charts $USOIL $WTIC Daily MACD down (green buy, red sell), Stoch RSI up, SQMOM down, on 200 MA. $CL_F $USO $SCO $UWT $DWT
Crude oil is back at the 200 MA on the daily – careful because it goes south of the 200 and springs sometimes – it catches shorts shorties. Wait for MACD to confirm. #patience

Simple Charts $USOIL $WTIC 60 Min MACD flat (green buy, red sell), Stoch RSI down, SQMOM flat, on 100 MA. $CL_F $USO $SCO $UWT $DWT
Even the hourly says wait. Lots of indecision. OPEC and company wouldn’t have anything to do with this I am sure.

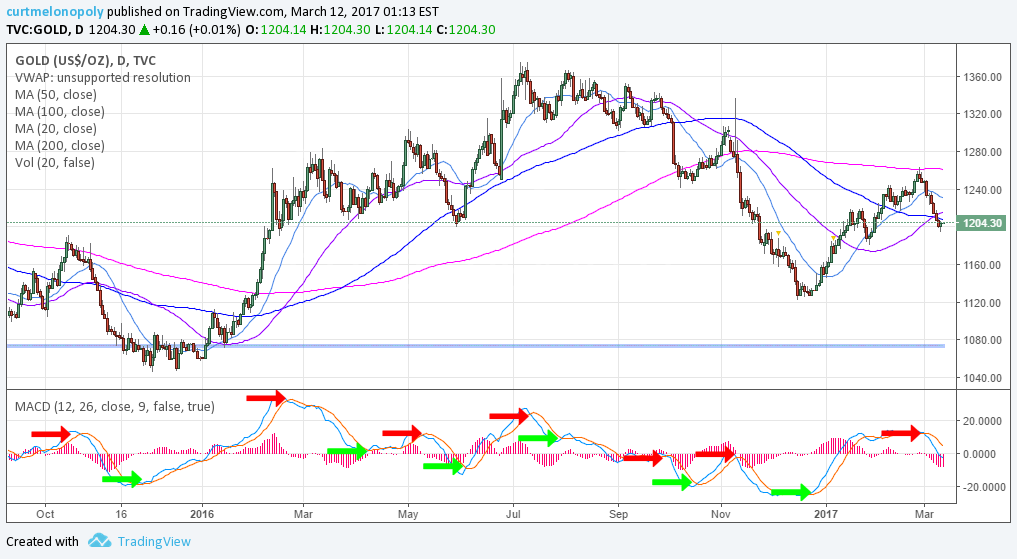
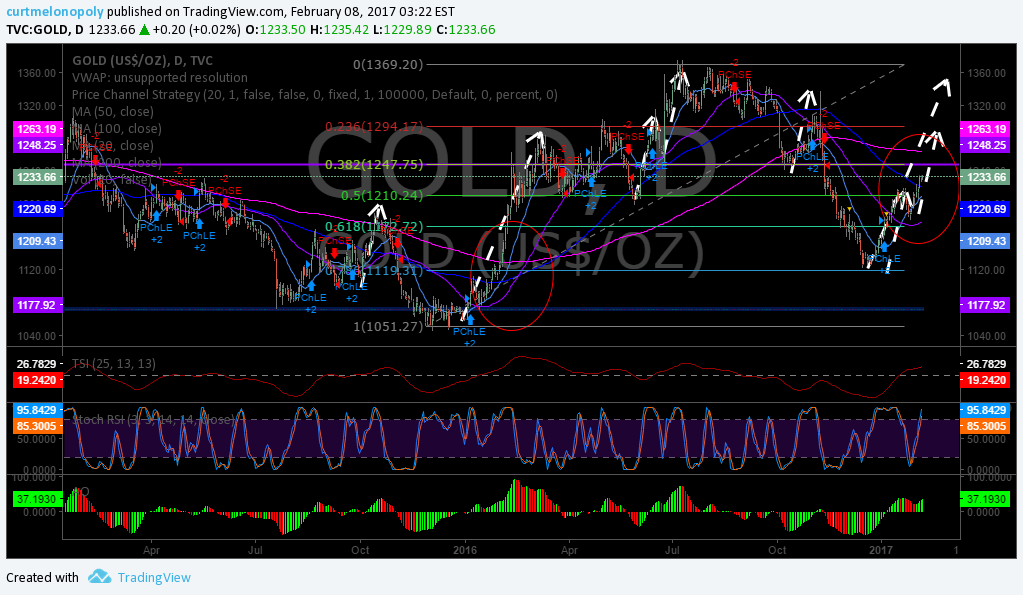
Simple Charts #GOLD Daily MACD pinch (green buy, red sell), Stoch RSI up, SQMOM down, 100 50 MA cross. #SwingTrading $GLD $XAUUSD $GC_F
Indecision on the Gold daily with MACD pinch – so watch that close, but the stoch RSI is up and don’t forget about that bullish 100 50 MA cross. Let the MACD confirm on a swing to go long.

Simple Charts #GOLD 60 Min MACD down (green buy, red sell), Stoch RSI down, SQMOM green, above MA’s. #DayTrading $GLD $XAUUSD $GC_F
Hourly shows a little different picture, bulls are in it (price action) BUT they are not all in – the MACD and the Stoch RSI need to confirm.

Simple Charts #SILVER 60 Min MACD flat – up (green buy, red sell), Stoch RSI down, SQMOM green, 200 100 MA pinch. #DayTrading $SLV $USLV $DSLV
The Silver hourly is all about the 200 MA crossing the 100 MA – watch that close. Wait for MACD to confirm for good measure.

Simple Charts #SILVER Daily MACD down – up (green buy, red sell), Stoch RSI up, SQMOM red, below 20 50 200 MA. #SwingTrading $SLV $USLV $DSLV
Silver daily chart says MACD isn’t confirming yet, however, MACD is curling and Stoch RSI is turned up off the bottom. 50 MA could be an temporary glass ceiling also.

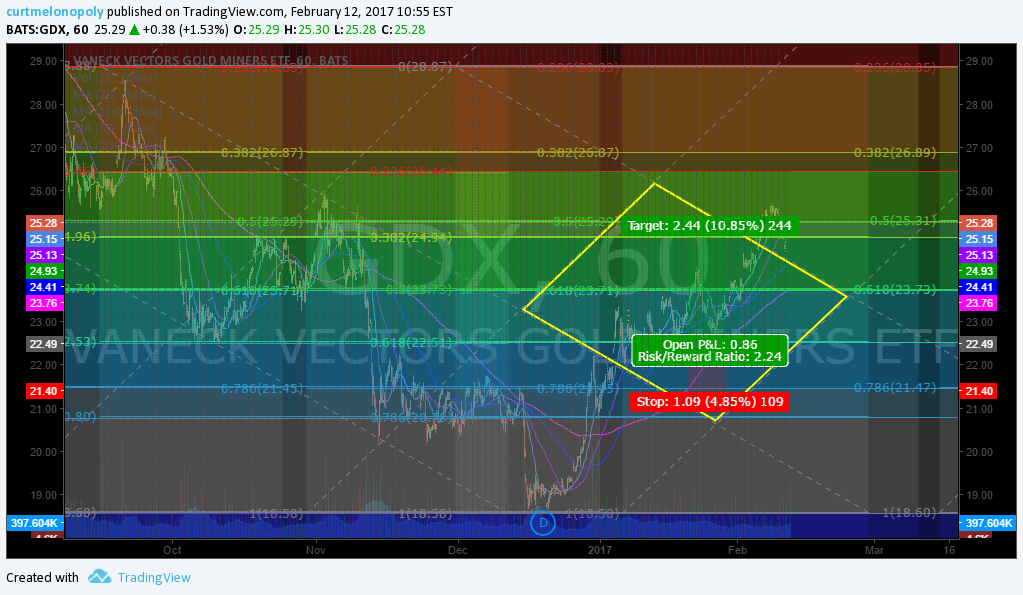
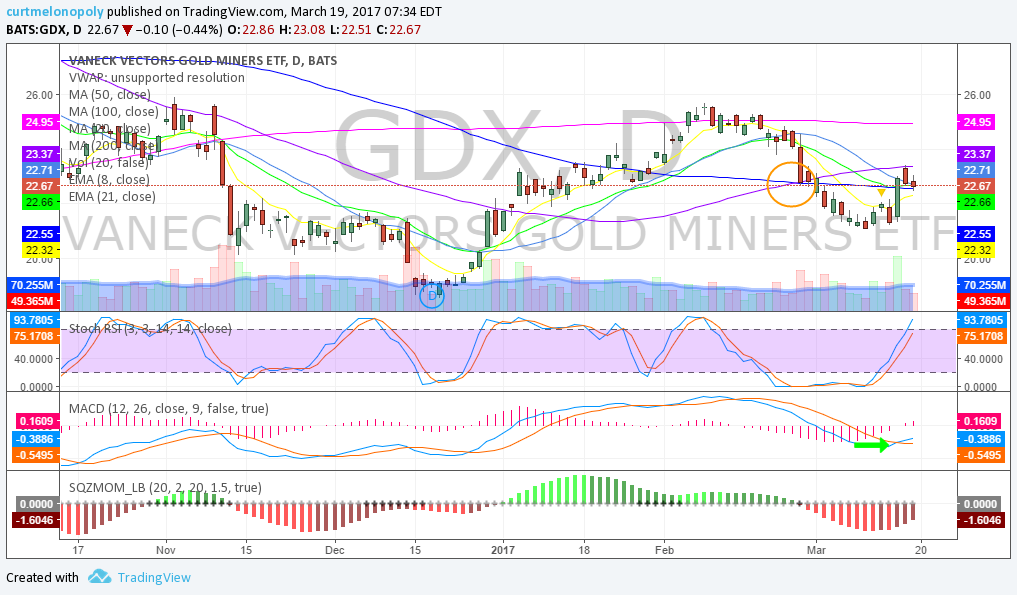
Simple Charts $GDX Miners Daily MACD up – up (green buy, red sell), Stoch RSI way up, SQMOM red – up, on 100 MA 20 MA test. #SwingTrading $GDXJ $NUGT $DUST $JNUG $JDST
Miner’s are always fun to review. They always front run – sometimes for the better and sometimes splat! Nonetheless the MACD on daily is turned up BUT the Stochastic RSI is revved – you may want to wait for that to cool before entering a swing.

Simple Charts $GDX Miners 60 Min MACD down (green buy, red sell), Stoch RSI up, SQMOM red, under 20 200 MA. #DayTrading $GDXJ $NUGT $DUST $JNUG $JDST
Miner’s on the 60 min actually show a MACD turned down – late week panic with the bulls? Weekend beer money maybe. I would go wider time-frame and allow the daily on $GDX to guide your way – wait for the simple indicators to all line up.

That’s my simple perspective for the week. Best to y’all this week.
Email or DM me on Twitter anytime with thoughts or questions!
Cheers!
Curtis
P.S.
The charts below may assist you in the endeavor of trade entry / exit and if you wish to become more serious (more profitable) with your entries refer to our swing trading for more insight (includes many equities also in the weekly reports).
The charting algorithm model Twitter feeds can be found here:$WTI (@EPICtheAlgo), $VIX (@VexatiousVIX), $SPY (@FREEDOMtheAlgo), $GLD (@ROSIEtheAlgo), $SLV (@SuperNovaAlgo), $DXY (@DXYUSD_Index).
Article Topics; Compound Trading, Swing, Trading, Stocks, Picks, $SPY, $VIX, $USOIL $WTI, $GLD, $GDX, $SLV, $DXY, MACD, Charting, ROI, USD, Dollar, Volatility, Gold, Miner’s, Silver, Crude, Oil, S&P 500, Stochastic, RSI, Moving Averages, MA, Commodities, Currencies