Charts, Video and Summary of Swing Trade Set-ups May 21, 2018 $PSTG, $ITCI, $AAPL, $SPY, $NFLX, $PG, $BOXL, $TRXC more.
In this video $PSTG, $ITCI, $AAPL, $SPY, $NFLX, $PG, $FUV, $BOXL, $TRXC, OIL, momentum stocks on the day and more.
Trade Set-ups May 21 Mid Day Trade Review;
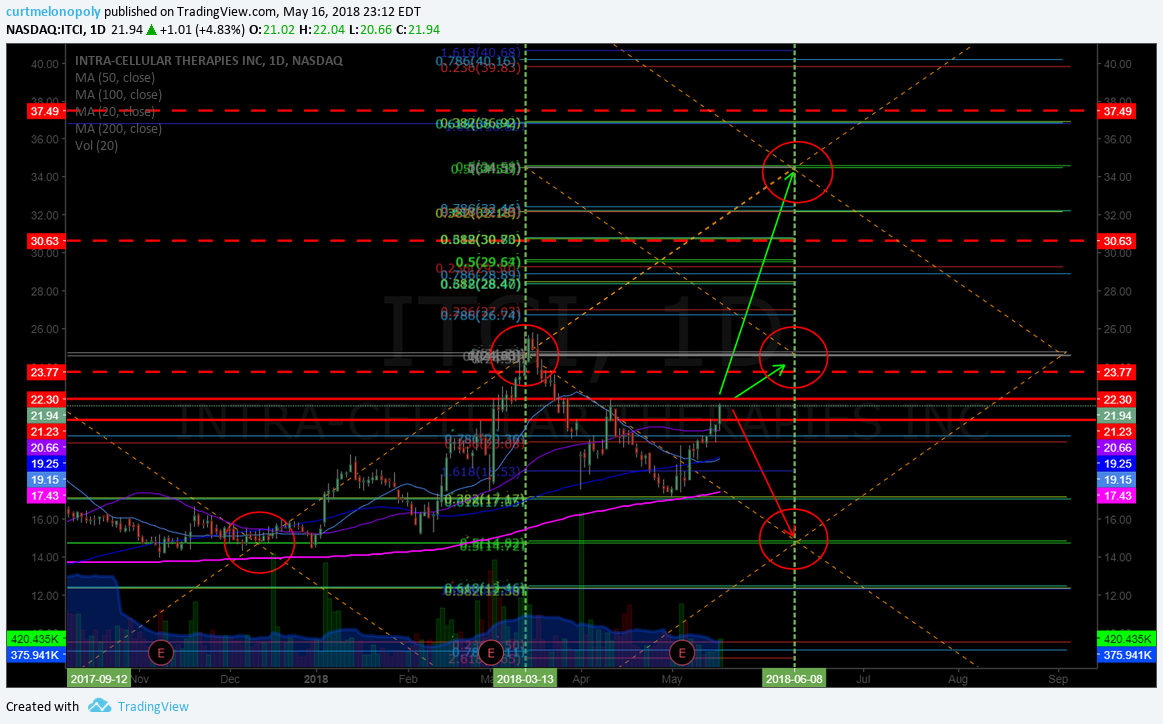
$ITCI Over 22.63 targets 23.77 and 24.62-66 main resistance on chart. Price dumped in to 200 MA main support and I alerted on the way down for a bounce and we alerted the buy side and have trimmed in to each resistance and added above. Price is against a main resistance diagonal trendline resistance. 24.70 area June 8 is main target, however, if it gets bullish it will target the one above. 19.78 is the bearish scenario. Video shows importance of quad walls on trading model.
$PG Wash-out snap-back trade set-up 50 MA on daily resistance. On watch for continued trade. Weekly chart, really like this chart. Squeeze momentum is starting to turn, Stochastic RSI has already turned, MACD likely near bottom. My trigger is 74.44 for a buy side look at it there. On the daily chart MACD is up.
$NFLX Momentum today trading 331.17 intra resistance / support 328.50 triggers in to 337.80 – .83 347.69.359.90, 371.59, 379.91 is main resistance. Support in wash 288.35 intra quad wall 296.50.
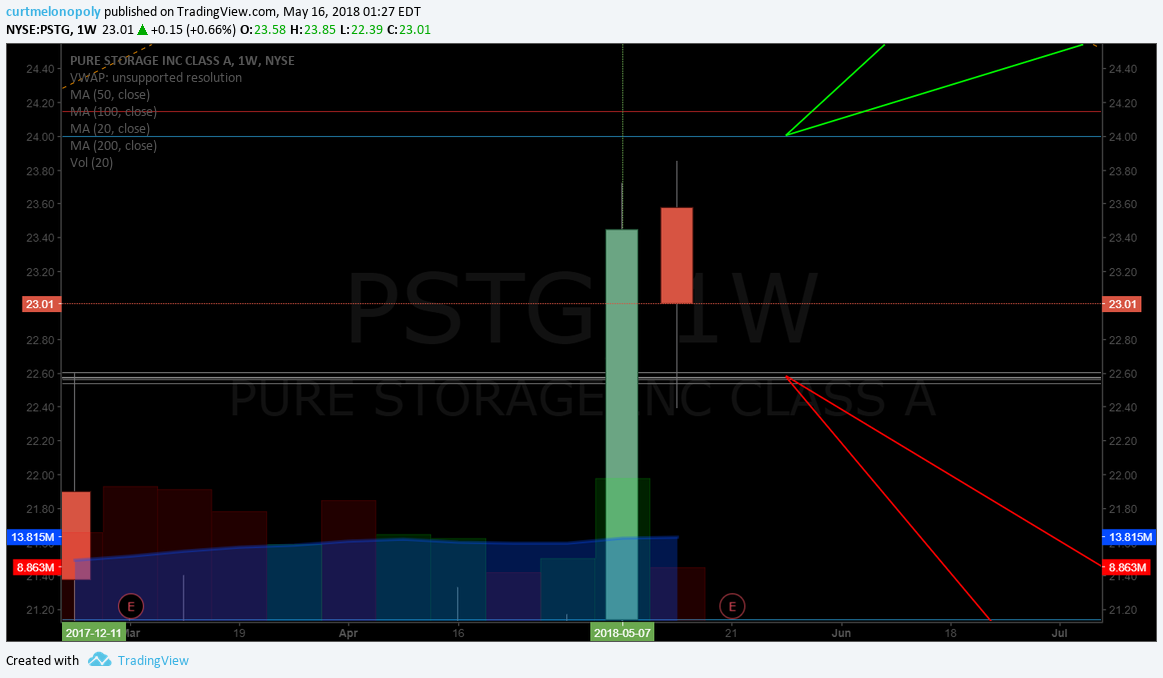
$PSTG earnings play 24.20 targets 25.12, 25.70-.90, 26.69, 27.83, 29.20 main resistance price target. Excellent structure in chart model. 22.63 18.29 support areas on chart in the event of a dump.
There is a Feature Report on $PSTG to swing trading members on blog.
An explanation of How to Swing Trade our models is discussed on this video at the $PSTG chart.
$SPY – 273.30 resistance, 273.60, 274.51, 276.04, 276.30, 278.43 – .50 May 30 main resistance price target. Real bullish move puts the targets at 289.04 and 283.77. 267.92 273.30 support areas.
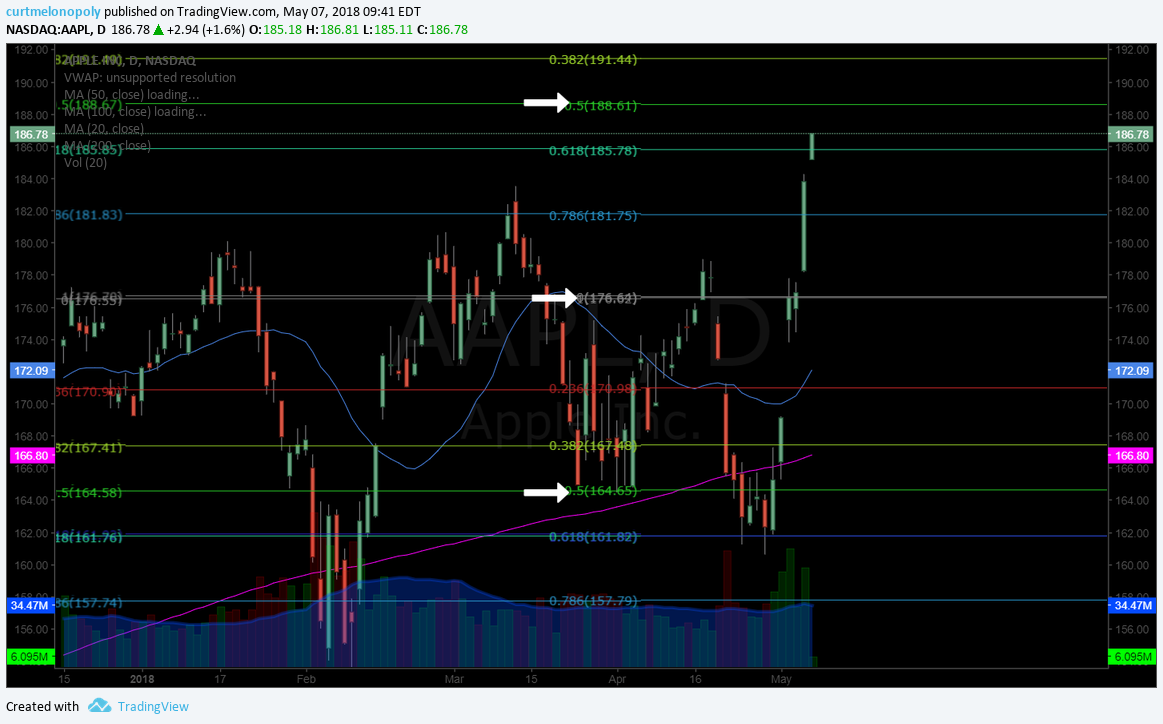
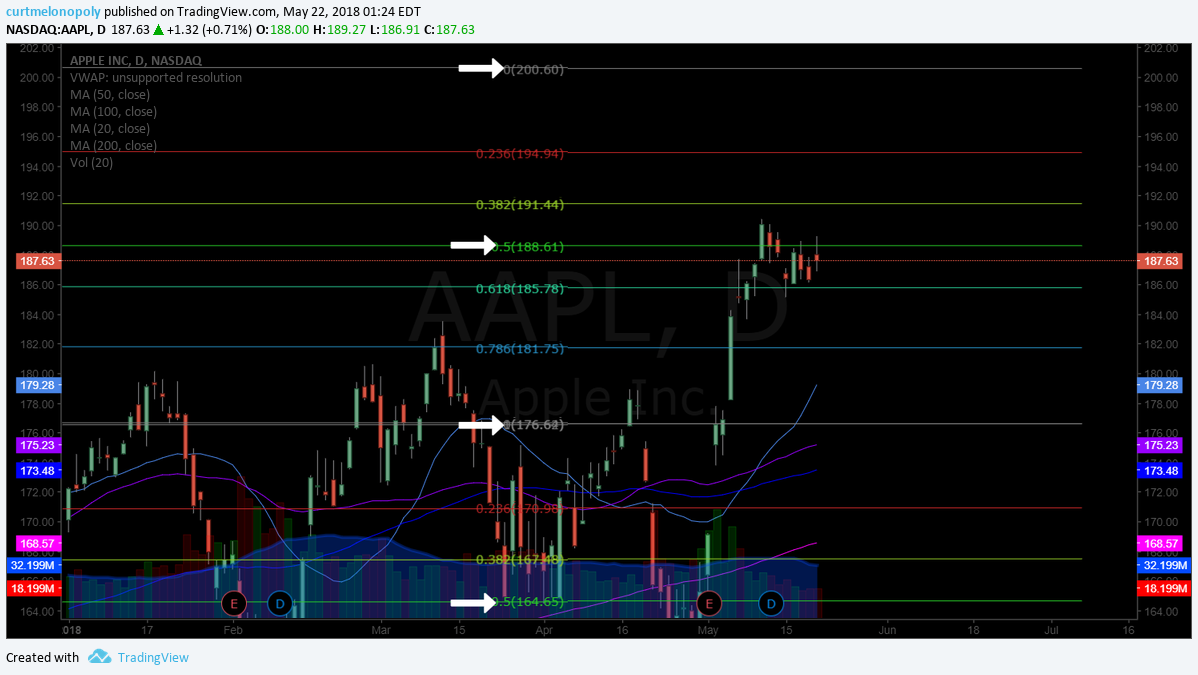
$AAPL – 188.62 main pivot buy sell trigger, trading 188.86 intra, 191.41 194.82 200.60 main resistance pivot above in bullish trade. Stochastic RSI is trending down, MACD looks like its about to turn, SQZMOM starting to trend down.
Oil $USOIL $WTI – I missed the buy trigger on it today but our machine traders got it.
Then we looked at the momentum stocks on the day – see video for that.
Charts to Accompany the Swing Trading Report:
$AAPL – 188.62 main pivot buy sell trigger, trading 188.86 intra, 191.41 194.82 200.60 main resistance

$SPY – 273.30 resistance, 273.60, 274.51, 276.04, 276.30, 278.43 – .50 May 30 main resistance price target.

PSTG earnings play 24.20 targets 25.12 and support areas noted in bearish scenario

$NFLX Momentum today trading 331.17 intra resistance support 328.50 triggers in to 337.80 – .83

$PG Wash-out snap-back trade set-up 50 MA on daily resistance. On watch for continued trade.

$ITCI Over 22.63 targets 23.77 and 24.62-66 main resistance on chart. #swingtrading

Connect:
Register to free email list for trade set-ups, webinars, special events: https://compoundtrading.com/contact/
Subscribe to our Weekly Oil Newsletter Here: https://compoundtrading.com/product/standalone-epic-newsletter/
Website: https://compoundtrading.com
Blog: https://compoundtrading.com/blog/
Free chat room: https://discord.gg/2HRTk6n
Subscribe: https://compoundtrading.com/overview-…
Twitter: https://twitter.com/CompoundTrading
Lead Trader: https://twitter.com/curtmelonopoly
Tradingview: https://www.tradingview.com/u/curtmel…
Facebook: https://www.facebook.com/compoundtrad…
StockTwits: https://stocktwits.com/compoundtrading
Email: https://info@compoundtrading.com
Curtis Melonopoly (@curtmelonopoly) is rated Top 250 Stock exchanges authority, covering also Mathematical finance and Economy of the United States.
Compound Trading Platform: Algorithm model charting for $SPY, $VIX, #OIL, #GOLD, #SILVER, #Crypto ($BTC Bitcoin, $ETH, $LTC, $XRP,) $DXY US Dollar and Swing Trading Newsletter. Live trading rooms for daytrading and oil traders. Private coaching and live alerts.