Tag: TVIX
Volatility Time Cycle Code Break 2020/21 Update (Part 1) $VIX $VXX $OVX $UVXY $TVIX #swingtrading #timecycles
Volatility (VIX) Market Time Cycle Update for 2020/21. Part 1 – A Review of Recent Volatility History.
Volatility time cycles affect the financial markets globally. Our time cycle work focuses on Volatility as a foundation and our trading in other key instruments reflects this. Other key instruments are SP500 $SPY $SPX, Crude Oil $CL_F $USO $USOIL, Gold $GC_F $GLD, Silver $SLV, US Dollar $DXY $UUP, Bitcoin $BTC.
We also weigh our stock swing trading (position trading) heavily on our time cycle work in Volatility.
In recent months and years our time cycle work has predicted the primary volatility spikes in markets with uncanny accuracy, this has significantly bolstered our Profit & Loss in Volatility trading, commodities, stocks and crypto.
This series of chart model updates and guidance provides the most recent code break updates for Volatility and the other instruments of trade listed above. First lets look look at Volatility (VIX).
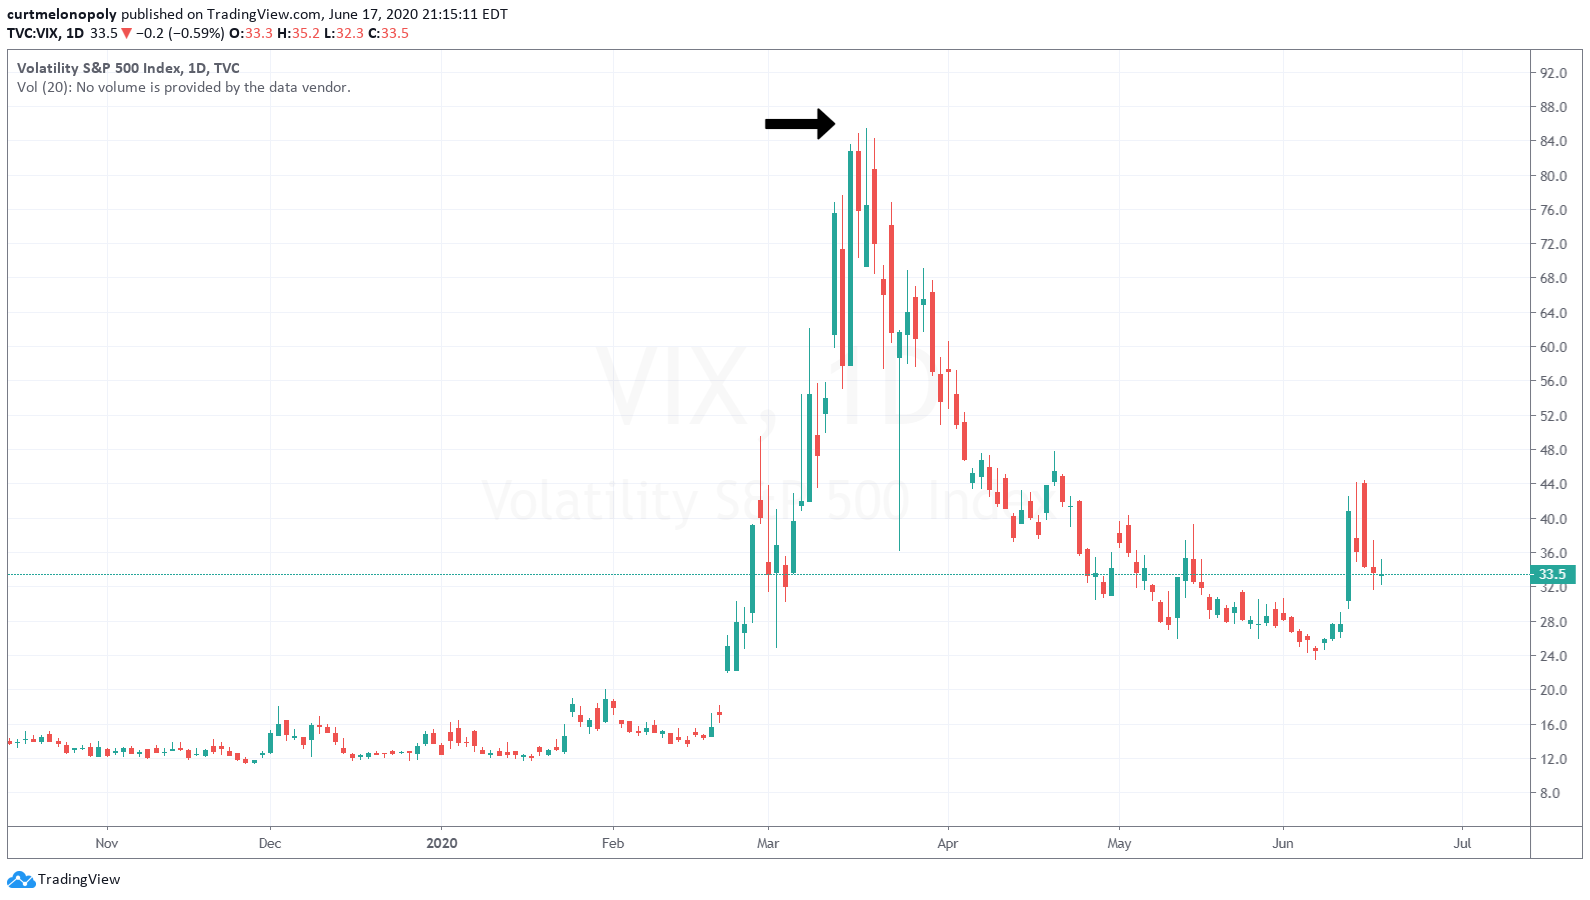
Volatility (VIX) Index last peaked in a primary time cycle trading in the low 80’s between March 7-17 2020. It was trading below 20.00s for sometime prior and then volatility spiked.

This presented our trading team and subscribers the opportunity to add to our long positioning in $VXX (short term volatility) and $OVX (oil volatility) in advance of the spike. It also allowed for us to prepare for a significant market sell-off. We closed all long positions in equities four days prior to the SP500 starting it’s COVID sell – off. We had opportunity to the short in size equities such as MasterCard (MA), Nike (NKE), WYNN RESORTS (WYNN) and many more for significant gains.
Last #timecycle we sold off longs 4 days b4 turn down, hammered short Mastercard $MA, WYNN $WYNN, NIKE $NKE etc & long $VIX $OVX at lows when hardly anyone was positioning same, then covered shorts in to turn, long $BA etc recent rally (check dates) #timecycles #swingtrading
Last #timecycle we sold off longs 4 days b4 turn down, hammered short Mastercard $MA, WYNN $WYNN, NIKE $NKE etc & long $VIX $OVX at lows when hardly anyone was positioning same, then covered shorts in to turn, long $BA etc recent rally (check dates) #timecycles #swingtrading pic.twitter.com/BpVaQW8cxQ
— Melonopoly (@curtmelonopoly) March 25, 2020
$OVX spiked from the 20.00s to 330.00s and even flashed in to the 500.00s. We were adding long positioning in $OVX in the 20.00s and selling as the price spiked in to 330.00s. We didn’t hold to the 500.00s. We also had opportunity to profit from $VXX in the volatility run-up.
There were many other trades around this time cycle that benefited our performance greatly. Look for our Profit and Loss Statements soon to be release (posted to the main page of www.compoundtrading.com).
More recently there was a volatility mid cycle inflection that seen VIX start to rise June 8 from low 20s to mid 40s over a week.

The inflection points between significant cycle peaks are areas of possible spikes. We recently adjusted for this possible inflection and it paid dividends, nothing like the primary March 2020 time cycle spike, but paid us and helped adjust various other swing trade holdings.
I have been reporting to our members for some time that this season of time cycles (2020 – 2025) would see significantly more volatility within volatility, a compression of time cycle duration(s) and viciousness of the cycle peaks. The most recent “inflection” is evidence of the compressed timing of cycles (volatility within volatility cycles and the time between spikes).
Even the most recent Volatility $VIX inflection was a decent trade with $VXX spiking in to 45.00s from high 28.00s and the primary cycle seen 13.00s to 78.00s, not bad.

Most recent $OVX Crude Oil Volatility started to spike in March from 20.00s to 330.00 and then really hit end of April in to 500s. #swingtrading $OVX
During the last time cycle we we buying oil volatility on every dip at near bottoms knowing where the time cycle peak was, $OVX was in the 20’s and rocketed in to the 300s fast, we didn’t hit that by coincidence. Our $VIX model is clear, the cycles are very clear. #timecycles
During the last time cycle we we buying oil volatility on every dip at near bottoms knowing where the time cycle peak was, $OVX was in the 20's and rocketed in to the 300s fast, we didn't hit that by coincidence. Our $VIX model is clear, the cycles are very clear. #timecycles pic.twitter.com/SZ8vzMQwRg
— Melonopoly (@curtmelonopoly) April 1, 2020
So this is an example of how the primary volatility indicator $VIX time cycles can be used for other related market instruments and also why it is important to have the time cycle models for the other instruments you trade as well, in this instance crude oil. What a trade that was.

We also use $TVIX and / or $UVXY on short time frames right in to the time cycles. Instruments you do not want to hold.
$TVIX up 41% today, pays HUGE to know your Time Cycles, also protects your ass ets knowing the time cycles $VIX #volatilitytrading #timecycles
$TVIX up 41% today, pays HUGE to know your Time Cycles, also protects your ass ets knowing the time cycles $VIX #volatilitytrading #timecycles pic.twitter.com/oTfy2E2lem
— Melonopoly (@curtmelonopoly) June 11, 2020
So that is a review of what has happened in volatility so far in 2020 and next we need to look at what’s next in volatility trading and develop our trading strategies for volatility and related instruments.
Part 2 (premium) article for Volatility $VIX time cycles will provide the charting models, time cycle dates for primary volatility time cycles, inflection dates on watch, compressed volatility within volatility dates, support (buy zones) with timing and resistance selling zones with price targets for the dates within the cycles going in Q3 and Q4 2020 and then in to 2021.
The most recent Swing Trading Sunday $STUDY Webinar session on June 14, 2020 had a dedicated segment on volatility time cycles so in part 2 we will start with that video and then start to break open all of the trading strategies for volatility going forward.
There will be historic opportunities in these large time cycle between 2020 – 2025 as I have been saying for a number of years, do not waste it! This is a life changing season of trade for traders.
Part 2 of this article is available here for members:
As always, if you have any questions reach out anytime compoundtradingofficial@gmail.com.
Peace and best.
Curt
Current List of Available P&Ls (remaining dates are in progress now to be released soon):
- Swing Trading Performance Summary (Q4 2019, Q1 2020 Interim): Return %, Gain/Loss, Win/Loss Rate, Number of Trades.
- Swing Trading Alert Profit Loss – Annualized ROI 1543.93% Feb 1-Feb 21, 2020. $200,000.00 – $230,051.00 #swingtrading #tradealerts
- Swing Trading Profit Loss – Annualized ROI 64.45% Jan 1 – Jan 31, 2020. $200,000.00 – $208119.00. #swingtrading #tradealerts
- Swing Trading Profit Loss – Annualized ROI 246.31% Dec 1 – Dec 31, 2019. $200,000.00 – $220,898.50. #swingtrading #tradealerts
- Swing Trading Profit Loss – Annualized ROI 315.32% Nov 1 – Nov 30, 2019. $200,000.00 – $224,130.16. #swingtrading #tradealerts
- Swing Trading Profit Loss – Annualized ROI 62.69% October 2019. $100,000.00 – $103,970.20. #swingtrading #tradealerts
- Swing Trading Profit Loss Annualized 355.22%. March 26 – June 28, 2017. $204,616.60 – $303,443.60. #swingtrading #tradealerts
- Swing Trading (Short Term Trades) Profit Loss Annualized 2,437.96%. April 3 – June 28, 2017. $17,354.69 – $37,713.16 . #swingtrading #tradealerts
- Swing and Day Trading Profit Loss – Annualized 957.90% Dec 26, 2016 – March 26, 2017. $100,000.00 – $180,347.88 . #swingtrading #tradealerts
Subscribe to Swing Trading Service:
Swing Trading Bundle (Swing Trading Newsletter, Live Swing Trading Alerts, Study Guides).
Swing Trading Newsletter (Weekly Newsletter Published for Traders).
Real-Time Swing Trading Alerts (Private Member on Twitter Feed and more recently by way of Email).
Swing Trading Study Guide Newsletters (After Trade In-Depth Reviews Including Set-Up Identification, Trading Plan, Sizing, Risk Management, ROI and more).
One-on-One Trade Coaching (Via Skype or In-Person).
Free Mailing List(s):
Join Email List for Free Trade Charting Trade Set-ups, Deals, Podcasts and Public Webinars.
Free Swing Trading Periodical Contact Form (Complimentary Swing Trade Set-Ups to Email)
Public Chat:
Visit our Free Public Chat Room on Discord.
Free Mailing List(s):
Join Email List for Free Trade Charting Trade Set-ups, Deals, Podcasts and Public Webinars.
Free Swing Trading Periodical Contact Form (Complimentary Swing Trade Set-Ups to Email)
Public Chat:
Visit our Free Public Chat Room on Discord.
Follow:
Article Topics; swing trading, time cycles, volatility, $VIX, $VXX, $OVX, $UVXY,, $TVIX
Trading Strategies: Crude Oil WTI USOIL, Bitcoin BTC, SP500 SPY, Volatility VIX, Arrowhead ARWR …
Trading Strategy Webinar Hosted Nov 28, 2018 with Trade Alerts and Charting
Audio starts at 3:58 on video.
Quick trade strategy review for crude oil, Bitcoin, SP500, Volatility and ARWR trades.
Short $DWT starter position 13.59 trading intra day 13.05 with price target 8.62. We will see how it goes. Trading 13.03 intra-day. Looking for a snap back trade to upside in crude to 50% of recent sell-off.
Daily chart resistance 52.15 area.
In overnight trade now oil is off trading 49.77 on USOIL WTI at 4:50 AM Eastern. The small bounce so far in overnight after the sell off was at trend-line support on the spigot chart our coders are using for legging in to trade sizing.
As for this starter position short $DWT, holding for now, it is a small position so far. Putin is supportive of Saudi Arabia and if there is a cut in production oil will turn up fast. I’m not marrying the trade either way.
Intra day you could short at top of quad area with 52.40 – .50 resistance.
8:25 Bitcoin BTC – we are looking for a turn in to Christmas being aware of the road bump in market time cycles that has a volatility time cycle (monthly) coming due Dec 5. On Bitcoin we are watching the trend-line chart resistance.
9:23 SP500 $SPY – looking for a possible long SPY in to Dec 20 time cycle peak, however, there is a smaller time cycle peak in VIX on Dec 5 we have to avoid, if that wasn’t there we’d already be long SPY. At this point we are watching.
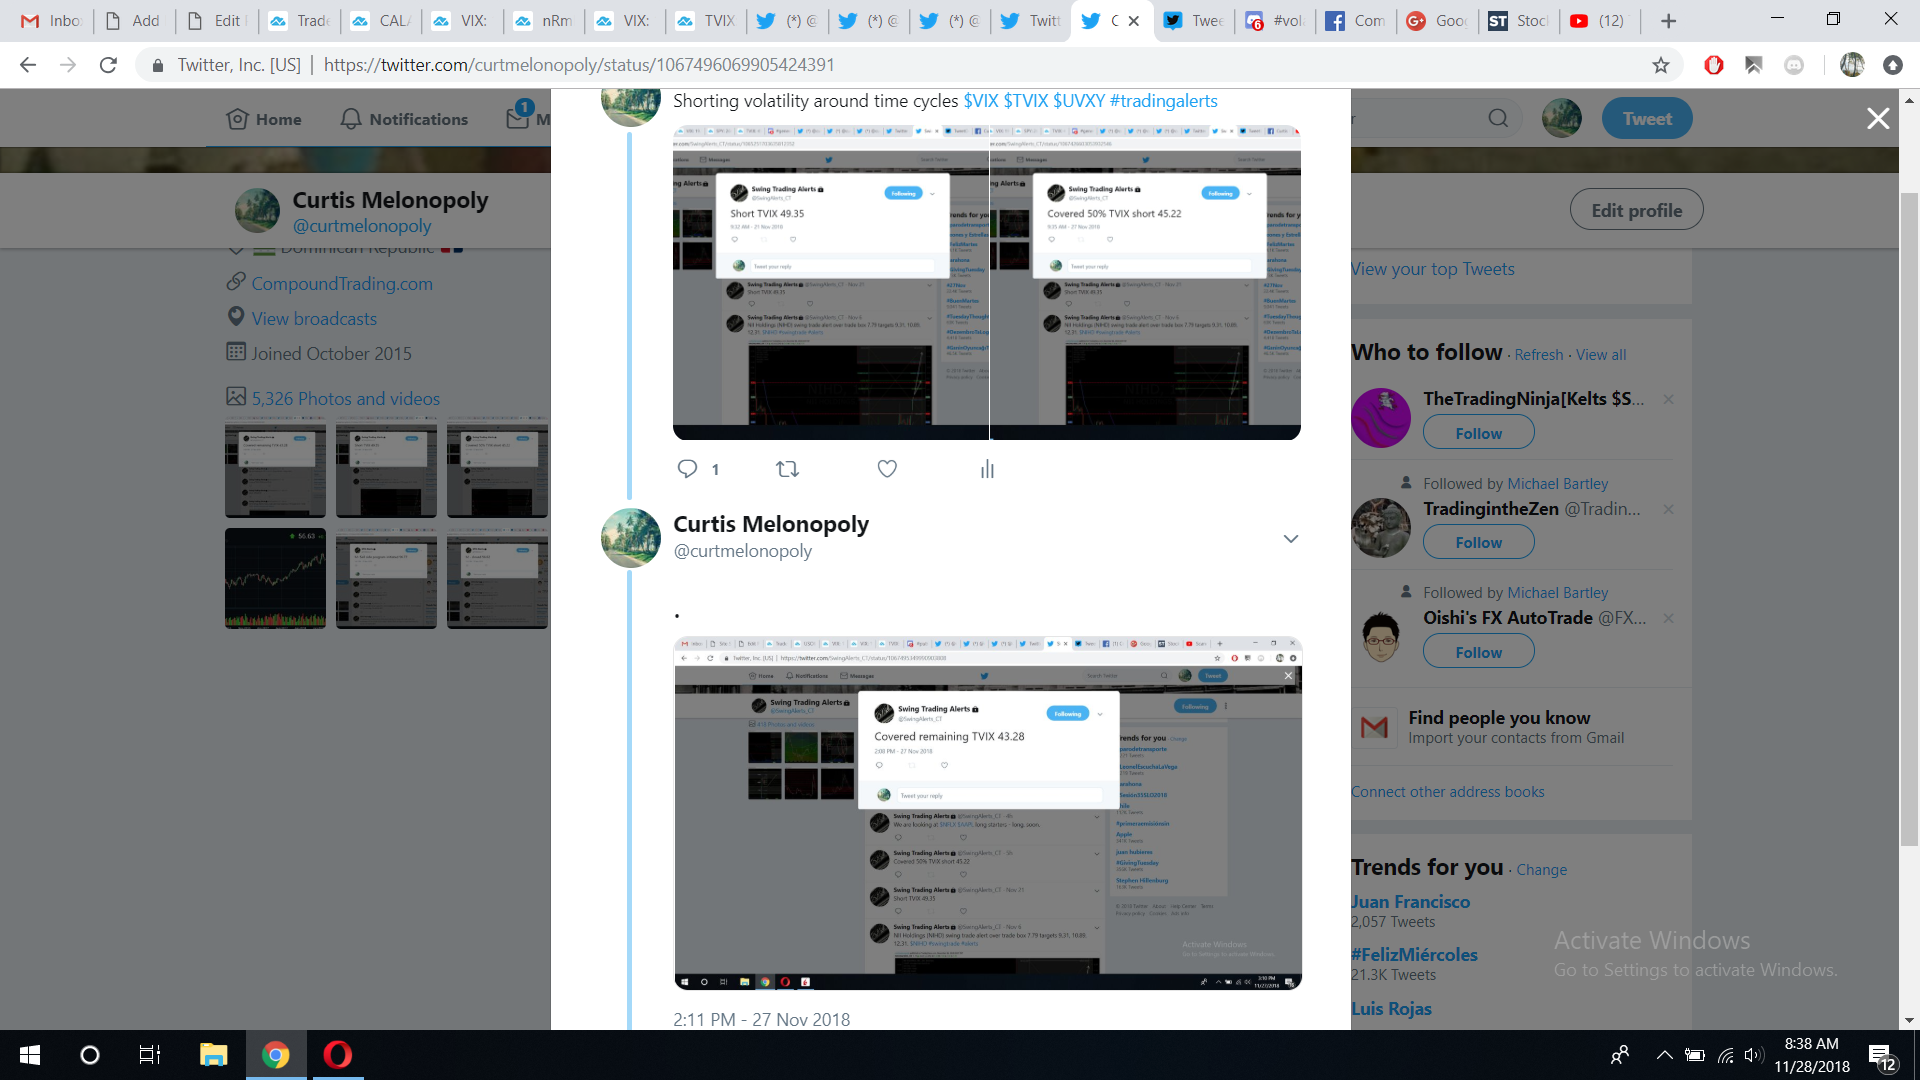
10:43 Volatility $VIX $UVXY $TVIX We covered our volatility short. Went short TVIX 49.35 covered 50% 45.22 and the remaining at 43.28. Watching support near on VIX at 50 MA (20, 100, 200 also under price) and lower Bollinger bands. Will likely be long in to Dec 5 time VIX specific cycle and short thereafter in to Dec 20 SPY time cycle peak.
11:10 ARROWHEAD $ARWR Last number of days has seen a bounce off the 200 MA, we are monitoring our initial position long.
There is a swing trading report due out today.
Thursday Mid day I will review many swing trades (pending market conditions). We expect to enter most swing trades between now and Tuesday next week. End of day Friday and pre-market is typical for me.
Thanks.

