Skip to content

Compound Trading Group

  • About
  • White Paper
  • Returns
  • News
    • NOTICE of Online Information Meetings
  • Order
    • Terms
  • About
  • White Paper
  • Returns
  • News
    • NOTICE of Online Information Meetings
  • Order
    • Terms

Tag Archives: $USO

  1.   »  
  2. Tag Archives: $USO

Tag: $USO

Daytrading Crude Oil: Buy Sell Signals Strategy for Intra-day Sell Off Reversal.

Daytrading Crude Oil: Buy Sell Signals Strategy for Intra-day Sell Off Reversal.

October 17, 2018October 27, 2018 Curt MelonopolyCrude Oil Trading Strategy, Day Trading$CL_F, $USO, $USOIL, $WTI, Alerts, Crude Oil, Daytrading, Signals, Strategy, Trading Room

Crude Oil Day Trading Strategies From Our Oil Trading Room Video Footage.

If there is one thing we have seen time and time again in our crude oil futures daytrading room (see previous articles) is that our EPIC Oil Algorithm model and day traders can pin-point the buy sell signals for the reversal for intra-day trend to capture a reversal in trade.

The focus of this post is to teach you how to find the intra-day bottom when daytrading crude oil. Step by step the lead trader explains what signals to watch for to simplify the process and ensure your winning strategy.

It is important to learn how to catch the bottom of sell-offs to increase your ROI on trades and capture the next move. You may have to enter a number of trades with tight stops to get a position that is set for the move, but it is worth the time if you learn how.

#DaytradingOil #OilTradingStrategy #TradeReversal # FX: $USOIL $WTI $CL_F $USO 

Main Points of Trade Strategy Covered in this Article:

  • Day trading oil signals covered in the video and post below:
    • EPIC Crude Oil Algorithm Charting.
    • Conventional Oil Charting.
    • Charting Indicators; Moving averages, squeeze momentum, MACD.
    • Time Cycles.
    • Price Targets (intra-day and weekly).
    • Trading Boxes.
    • Charting Time Frames.
    • Order Volume.
  • Short cover rally intra-day.
  • Entries around the edge of range.

Video Date and Description: October 17, 2018 10:25 AM – EIA Petroleum Report Live Trading Session.

Voice broadcast starts at 2:10 minutes on video.

Video Transcript Summary Highlights:

At 2:20 on video FX USOIL WTI trading 70.73 at the beginning of the session, trading on top of support at top of trading box at down side channel support.

The down channel in trade is confirming per the most recent guidance in recent reports and I am expecting that in to end of October and then up in to Christmas.

Resistance points on algorithmic model short side is most probable for winning in down trend (retracement) – areas to short pointed out on charting at 3:05 on video.

Bias was a long intra-day when report was released, but there was a surprise build today.

I usually don’t trade the first 5 mins after the EIA crude inventory numbers are released.

Example of EIA report data as posted on EPIC’s Twitter Feed:

#WeeklyPetroleumStatusReport for week ending 10/12/18 posted https://go.usa.gov/xPRx3 #oil #gasoline #diesel #heatingoil #propane #OOTT

https://twitter.com/EPICtheAlgo/status/1052567708473032704

3:40: On the oil algorithm there is a buy trigger signal intra-day at 69.97 at the mid channel support test for a daytrade.

3:50: Symmetry chart has a buy signal at 70.19 at top of oil trading box.

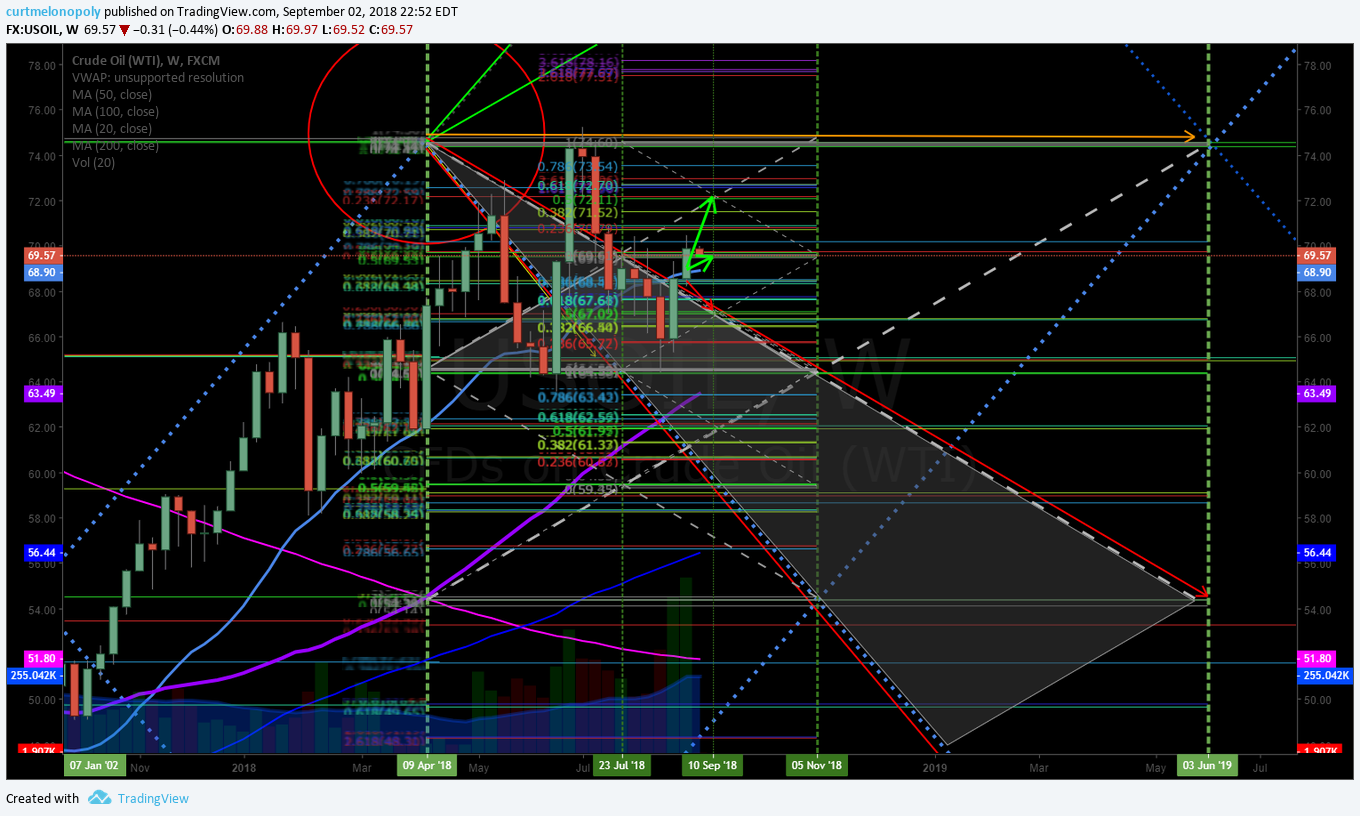
4:08 Trade on monthly chart is still between the 100 MA and 200 MA and I expect a break to upside or downside early November and my bias is to upside.

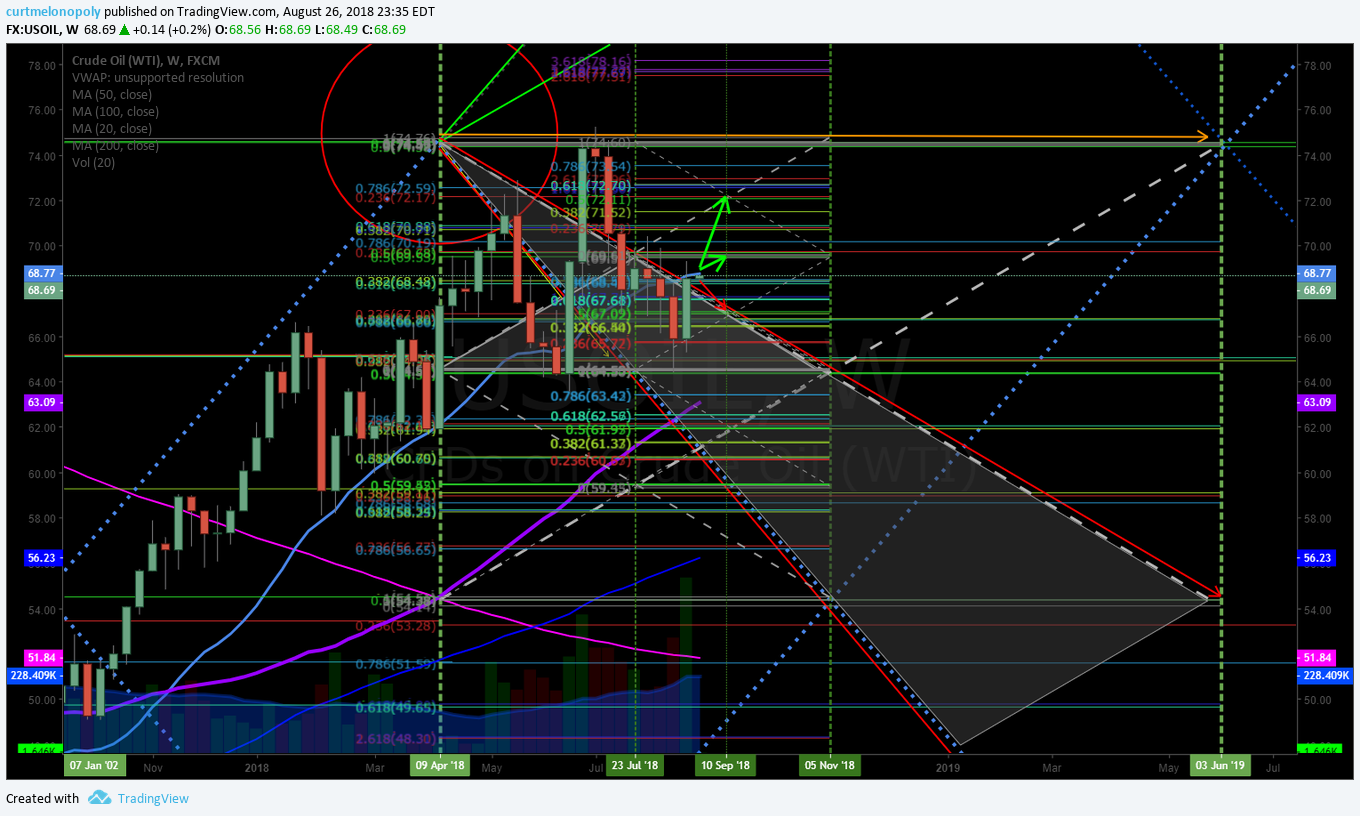
4:14 On the weekly wedge chart 70.00 watch very close at top of trading box, end of October time-cycle peak to bottom of wedge on chart 68.42 – that is possible.

4:45 On the daily oil chart trade intra-day is right at the pivot. 50 MA is just under price and to the upside the price intra-day was rejected at the pivot.

Don’t miss the last report on oil trade guidance I provided that guides on signals from now in to early 2019 on all charting.

5:10 Charting trend lines reviewed with time cycle peak early December in 76.00 region.

7:20 on video #EIA report comes out.

7:27 the sell-off on oil is apparent in trade with stops in oil getting taken out.

I start reviewing oil charting at this point on video for various supports to possibly take a position long.

8:50 6.5 million barrel build in crude oil inventories is discussed. 69.50 possible low in oil trade is discussed here.

9:40 Trading 73.00. Any long positions be sure to keep your position with tight stops until down to the 69.50 support range.

Top of trading box on the weekly wedge support at 69.99 is considered.

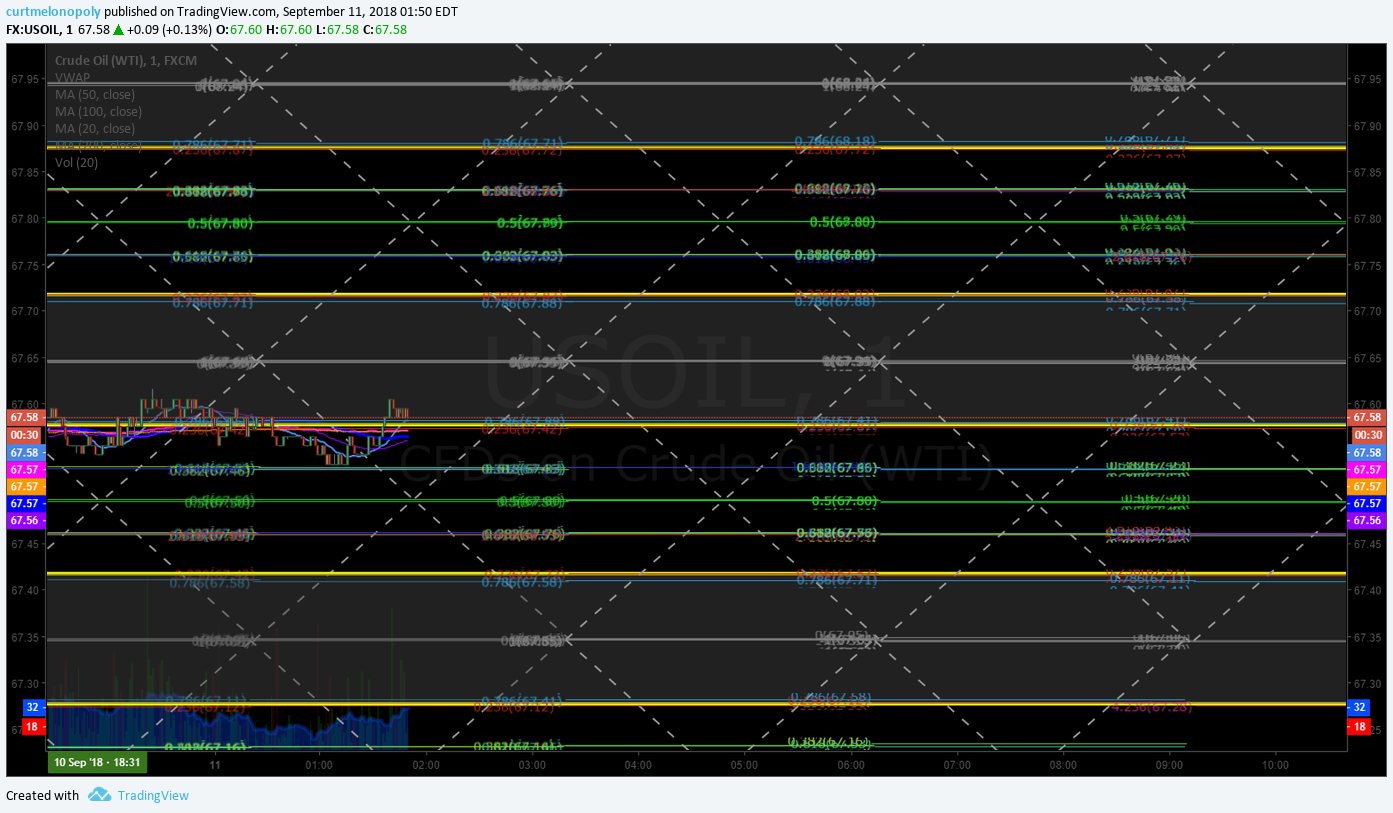
11:15 Watching chart indicators; MACD, Squeeze Momentum and Stochastic RSI on 1 minute time frame here as price is getting in to the first signal for a possible buy zone daytrade at support.

11:40 I explain that I am looking for a short cover rally for the oil daytrade and then shorting the resistance. As shorts cover price goes up, this occurs when the sell-off on the day comes to an end as oil shorts cover positions.

11:50 I explain that trade is down 3% on the day and that this is typically the area of the short covering and reversal intra-day.

12:40 As price bounces I start to look toward the upside 20 MA resistance on the 1 minute chart.

13:35 I provide guidance that we are possibly looking at 69.00 area and even 68.46 on the wedge chart.

14:50 My daytrade plan for support area and resistance areas and the intra day time cycle confirmation of up or down channel for trade is reviewed on the oil algorithm charting.

17:10 Watching the possible buy zone and 1 min chart for squeeze momentum to turn.

20:20 We are watching the pressure in oil trade in to the bottom of the trading box on the 1 minute chart and considering more stops to get ta’ken out if trade goes below the support on the trade box.

22:20 15 minute candle expires (important point of time to watch trade closely). The bottom of the trading box then is lost.

23:50 I discuss the problem created with governments manipulate price in markets (such as Trump with oil) and what will likely happen with the price of oil when the anomaly will cause a sever snap back trade in oil (also referenced earlier in video). Essentially the structure of the natural trading range of a financial instrument is manipulated.

26:00 oil starts to trade up and I’m watching for the 20 MA upside resistance test.

27:00 I explain that many traders would have taken the buy signal at the mid channel line on the chart and that I likely should have.

28:10 After 20 MA resistance has occurred and price is on the way back down to the next support and I explain where that is and that it is my possible buy area on chart.

29:25 The buy side for oil comes in and I explain that I’ve now missed two buy triggers.

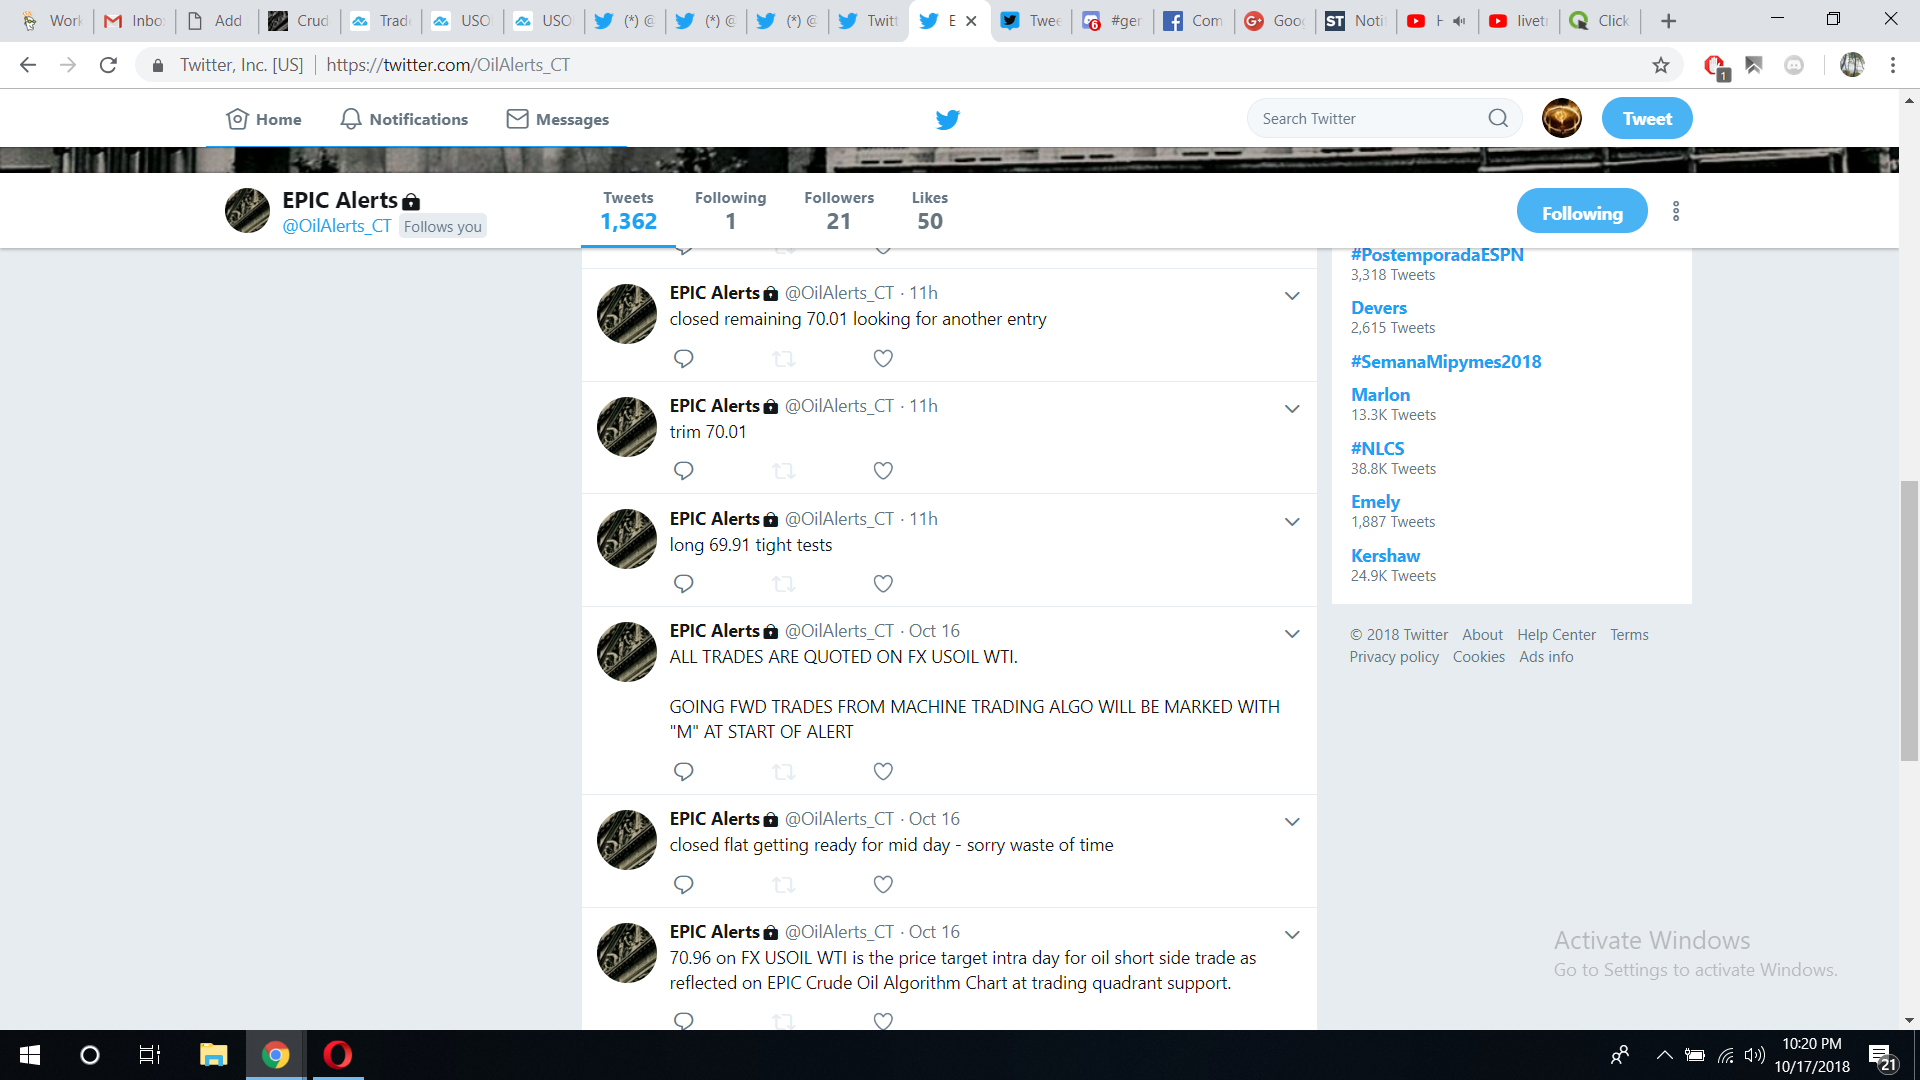
42:00 I am long crude oil futures at 69.91.

44:19 I explain the 5 min candles and a place to trim the position at top of the trading box and alerting that I have trimmed my long position at 70.01 and advise that the 50 MA on the 1 min is coming. Ten minute candle expiry on watch.

45.40 I alert that there is resistance heavy intra day 70.28 range.

46.55 I close the remainder of the daytrade and look for another entry.

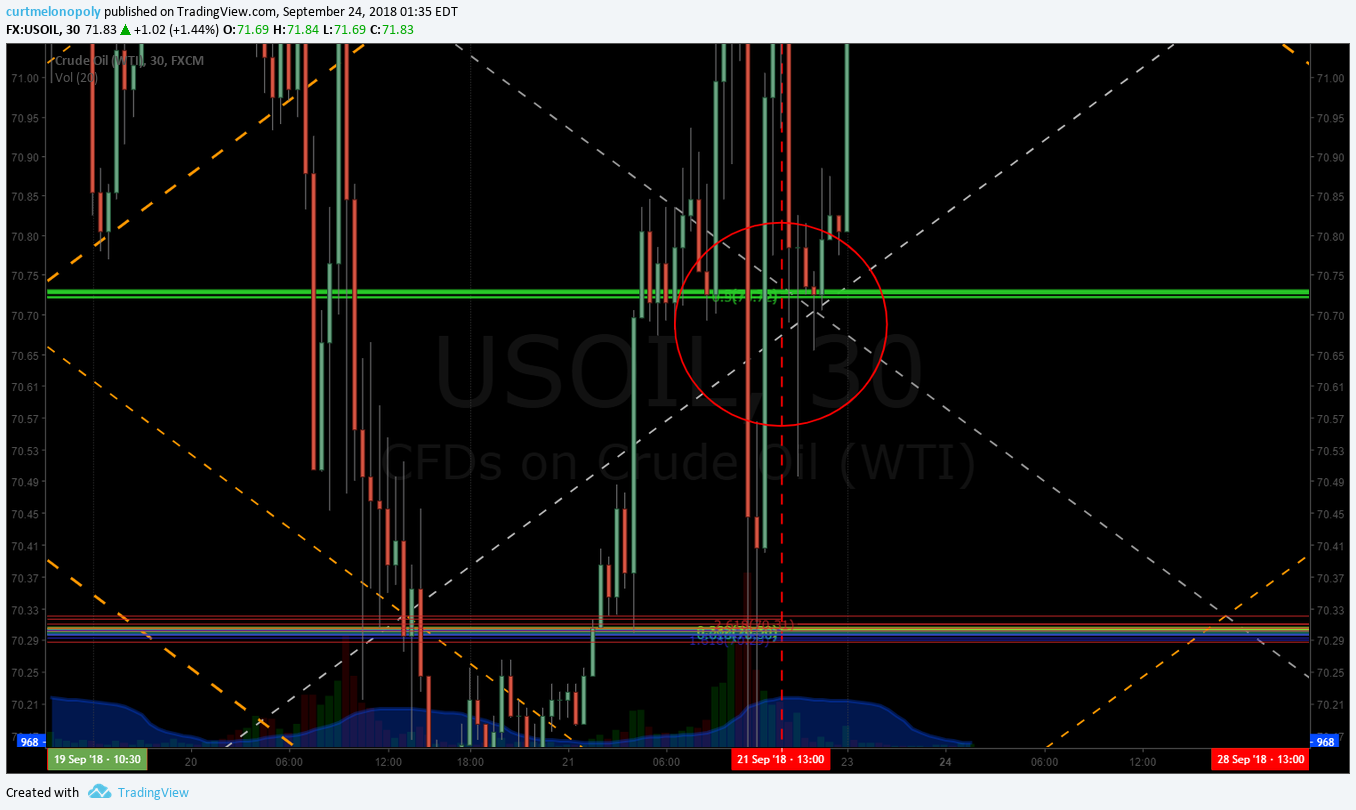
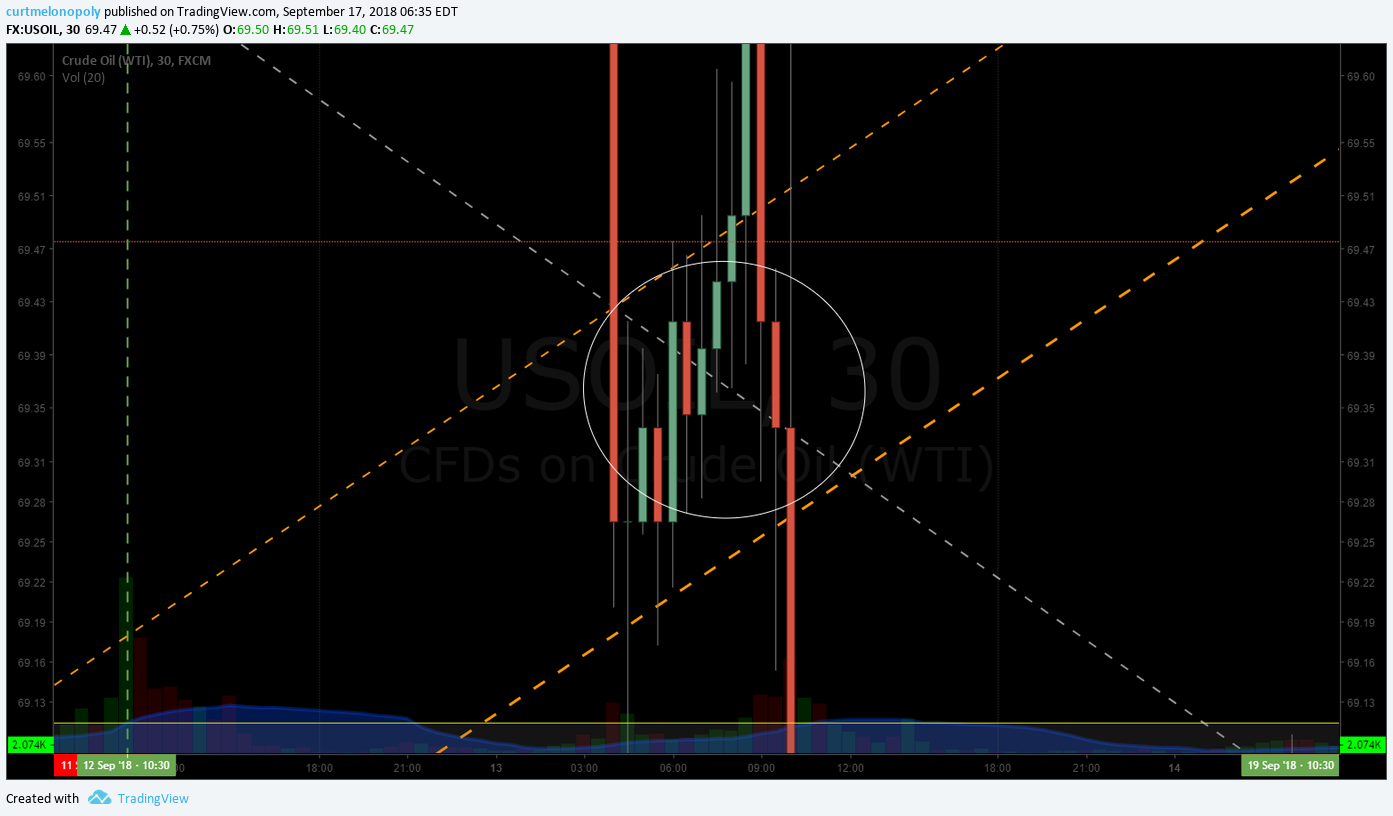
Below is the screen shot of my trade alert for the day trade in crude oil on the long side and my closing the position. This reflects what it looks like when you try and catch the reversal on intra-day trading.

daytrading, crude, oil ,signals
Daytrading Crude Oil – Screen Shot of Oil Trade Alerts Feed with signals for long oil trade and closing trade.

There is more to the video, with various discussion on daytrading crude oil with what signals to watch for and there is another trade on the video also.

See video for more on related discussions.

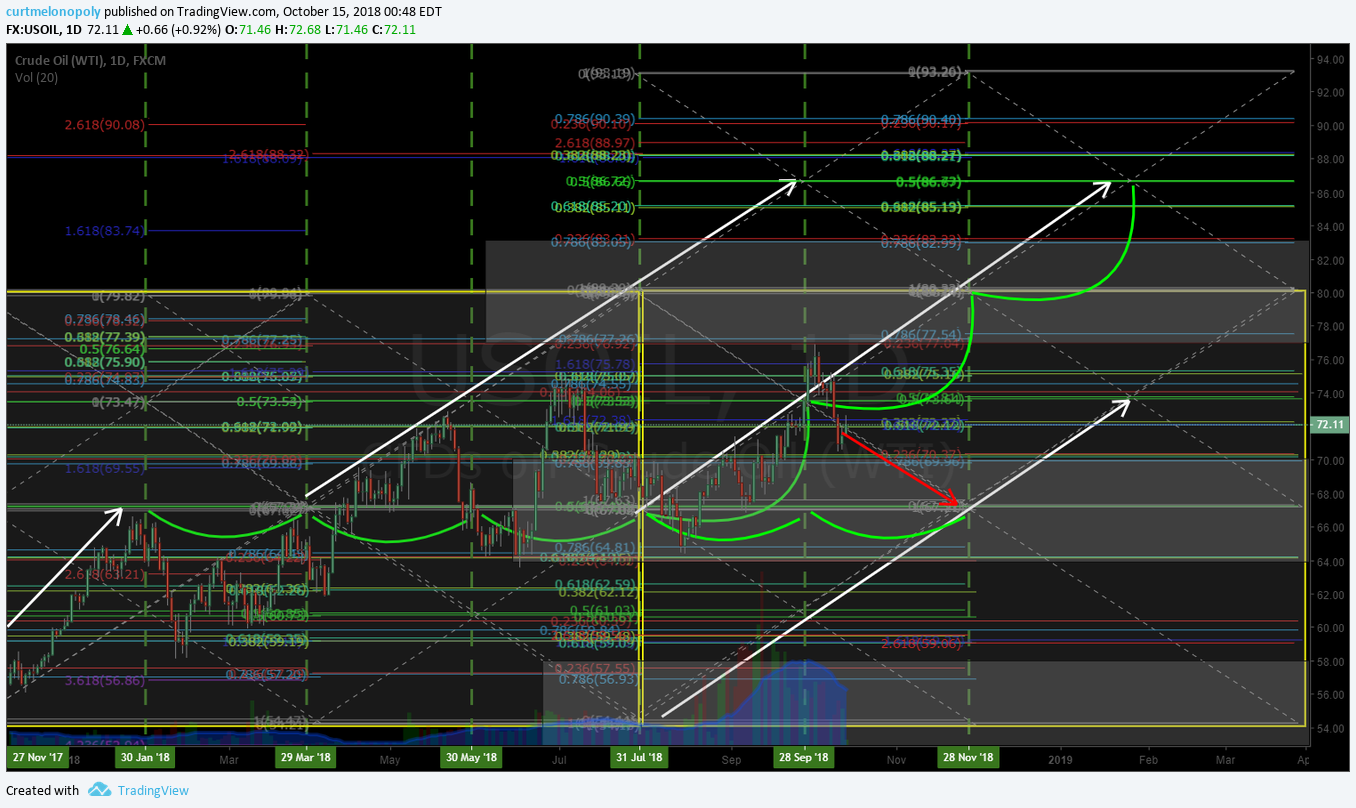
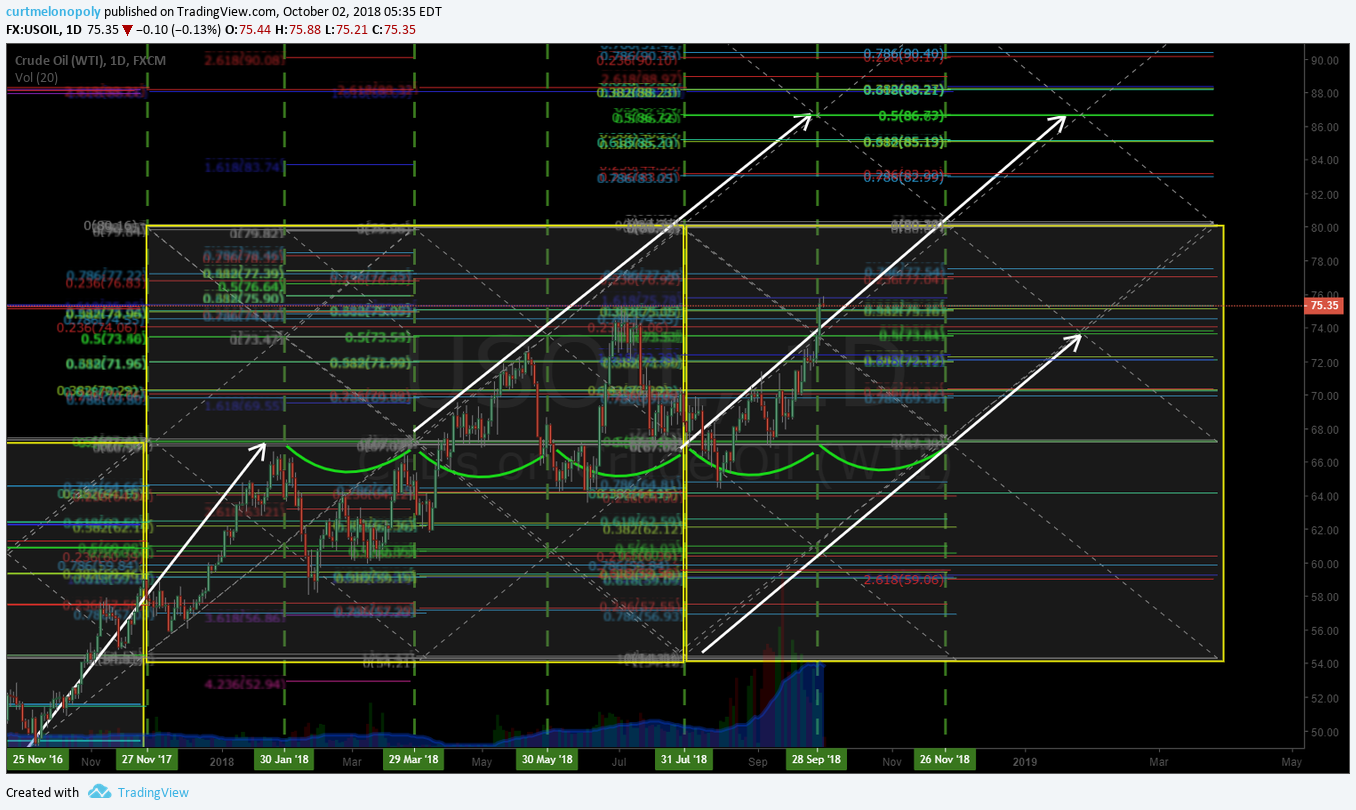
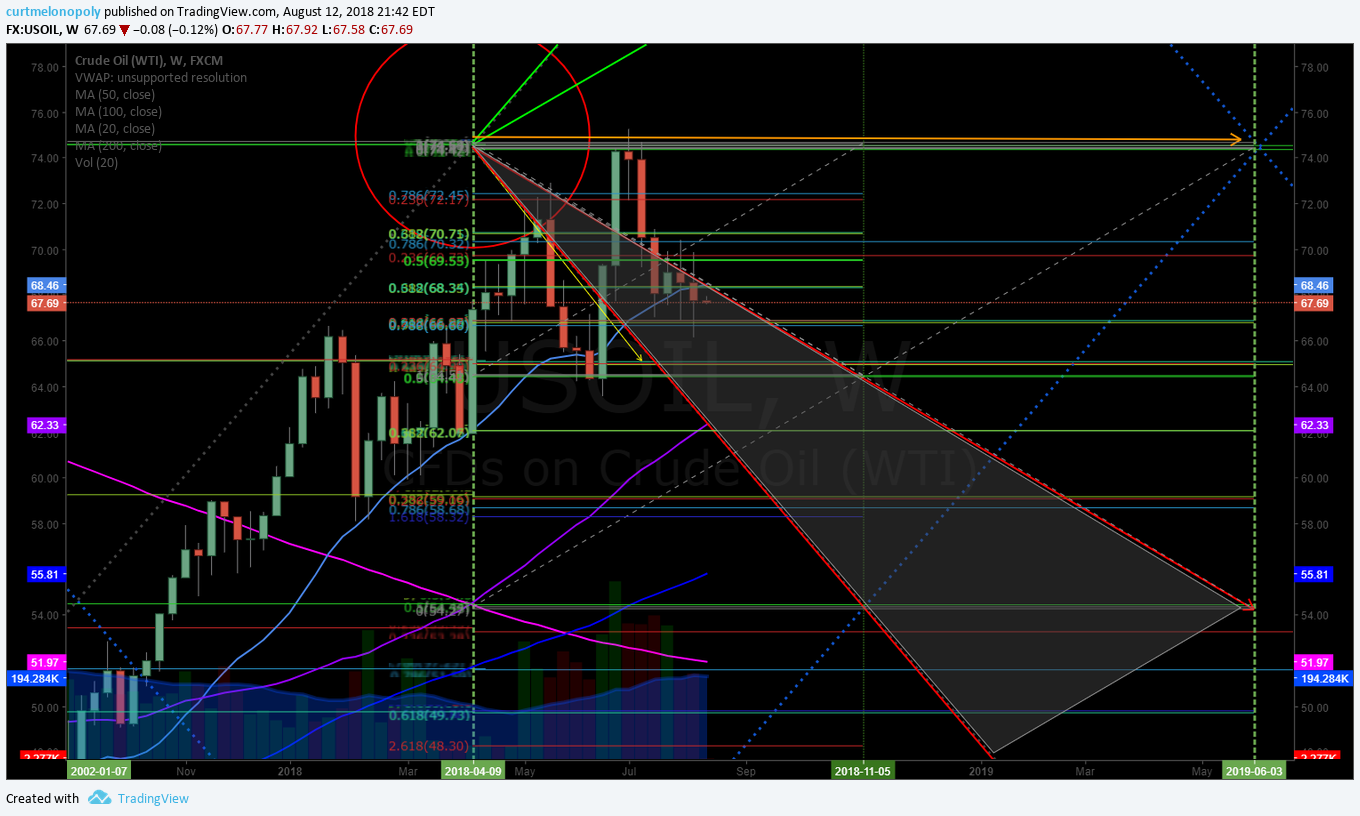
Below is the guidance in given to the oil trading room with charts at the start of futures trading later that day.

Price targets for 900 AM Oct 18 price cycle completion intraday crude oil trade.

price, targets, signals, day trade, oil
Daytrading Crude Oil – Price targets for 900 AM Oct 18 price cycle completion intraday crude oil trade. #daytrading #crude #oil

Buy sell trade signals at each highlighted trendline (yellow) on chart.

buy, sell, trade, signals, crude, oil
Daytrading Crude Oil – Buy sell trade signals at each highlighted trendline (yellow) on chart #crude #oil #daytrading

Signals for end of week price targets. Upper target bias – lead trader.

daytrading, crude, oil, signals, weekly
Daytrading Crude Oil – Signals for end of week price targets. Upper target bias – lead trader. #Crude #Oil #Daytrading

Thanks

Curt

Any questions let me know!

Further Reading:

5 Steps to Making a Profit in Crude Oil Trading.

https://www.investopedia.com/articles/investing/100515/learn-how-trade-crude-oil-5-steps.asp

What is a ‘Trade Signal’:
A trade signal is a trigger for action, either to buy or sell a security or other asset, generated by analysis. That analysis can be human generated using technical indicators, or it can be generated using mathematical algorithms based on market action, possibly in combination with other market factors such as economic indicators. https://www.investopedia.com/terms/t/trade-signal.asp

Other Crude Oil Trading Reports & Videos:

Learning to Trade Oil Links on our Site and/or YouTube.

Crude Oil Trading Strategies: This Is It. How To Trade Crude Oil’s Next Move.

Crude Oil Trading Strategy – How I Will be Trading Oil in to Time Cycles.

Oil Trading Room – Oil Trading Signals with Lead Trader (plus video).

Crude Oil Trading Room – Member Oil Trade Signals / Alerts for Trading the EIA Report (w/ video).

Oil Trade Alerts: How We Knew Where Oil Sell-Off Bottom Was in Advance. Crude Oil Trading Strategy.

Crude Oil Trading Face-Off Results “Pro Trader” (Man) vs. EPIC Oil Algorithm (Machine Trading Tech)

Oil Trading Alerts Live Video w EPIC Oil Algorithm #EIA Report #Oil #Trading #Algorithm #Alerts $USOIL $WTI $CL_F

“The Nut Hand” Today’s Huge Oil Trade Win. Exactly How It Was Done. How I Knew & How You Can Too.

CRITICAL Oil Trade. Weekly Timing. EPIC Oil Algorithm Channel $USOIL $WTI $CL_F $USO #OilTrading #EIA

Overnight Oil Trade | Trading Plan in Detail | EPIC Oil Algorithm $USOIL $WTI $CL_F #OIL $USO #Alerts

No Crystal Ball? Watch this… EPIC Oil Algorithm #EIA $USOIL $WTI #OIL $USO $CL_F #OOTT #Algo

Oil Trading Room – How to Use EPIC the Oil Algorithm June 21, 2017 (video).

Oil Trading Room – How to Use Oil Algorithm Chart & Recent Trades June 29, 2017 (video).

Here we unlock historical member reports at intervals after time cycles have expired for traders that are learning to trade oil. When you clock on link scroll down at landing page on blog section you will be transferred to so that you can get to reports that are unlocked over time: https://compoundtrading.com/category/epic-the-oil-algo-chart-report/

Subscribe:

Standalone Oil Algorithm Newsletter (member charting sent out weekly).

Real-Time Oil Trading Alerts (Private Twitter feed).

Oil Trading Room / Algorithm Newsletter / Alert Bundle (includes weekly newsletter, trading room, charting and real-time trading alerts on Twitter).

Commercial / Institutional Multi User License (for professional trading groups).

One-on-One Trade Coaching (Via Skype or in person).

Click here to find all information and pricing on Oil Newsletter, Trading Chat Room, Oil Alerts and more.

Connect:

Register to free email list for trade set-ups, webinars, special events: https://compoundtrading.com/contact/

Website: https://compoundtrading.com

Blog: https://compoundtrading.com/blog/

Free chat room: https://discord.gg/2HRTk6n

Subscribe: https://compoundtrading.com/overview-…

Twitter: https://twitter.com/CompoundTrading

Lead Trader: https://twitter.com/curtmelonopoly

Tradingview: https://www.tradingview.com/u/curtmel…

Facebook: https://www.facebook.com/compoundtrad…

StockTwits: https://stocktwits.com/compoundtrading

Email: https://[email protected]

Curtis Melonopoly (@curtmelonopoly) is rated Top 250 Stock exchanges authority, covering also Mathematical finance and Economy of the United States

Follow:

Tweets by EPICtheAlgo

Article Topics: Daytrading, Crude Oil, Strategy,Trading Room, Alerts, Signals, USOIL, WTI, CL_F, USO 

Read More
Crude Oil Algorithm Trading Report (EPIC) w/ Gen 2 Machine Trade Mon Oct 15 FX: $USOIL $WTI $CL_F $USO #Oil #Trading #Algorithm

Crude Oil Algorithm Trading Report (EPIC) w/ Gen 2 Machine Trade Mon Oct 15 FX: $USOIL $WTI $CL_F $USO #Oil #Trading #Algorithm

October 15, 2018February 10, 2019 Epic the AlgoCrude Oil Trading Algorithm (EPIC)$CL_F, $USO, $USOIL, $WTI, Alerts, Algorithm, Charts, chat, Crude, EPIC, Oil, Signals, Trade, Trading Room

Crude Oil Trading Algorithm Chart Report (EPIC) Monday October 15, 2018.

FX: $USOIL $WTI $USO $CL_F $UWT $DWT $UCO $SCO $ERX $ERY $GUSH $DRIP

Welcome to the oil trading algorithm report. My name is EPIC the Oil Algorithm and I am one of the seven primary Algorithmic Chart Models in development at Compound Trading Group (there are over one hundred in total in development at various stages in various markets).

NOTICES:

New members to our oil algorithm charting models, oil trade alerts and oil trading room are encouraged to on-board in a way that equips you as an oil trader for consistent profit.

Visit my public Twitter feed EPIC Oil Algorithm Twitter (@EPICtheAlgo) and review tweets over the last few months, visit our blog and review the recent crude oil trading algorithm blog posts, our You Tube channel “how my oil algorithm works”, “how to use my charting”, weekly EIA oil report videos and our website explains how the oil algorithm was developed.

Invaluable are the crude oil trade alerts (available with or without the trading room / weekly report bundle) and the private member crude oil trading chat room on Discord (included in the bundle). The live alerts are important if you are not at your trading screens 24 hours a day and the chat room allows for interactive lead trader oil trade set-ups as each oil trade approaches.

Reviewing important points of reference and engaging the subscription resources will increase your probability of success considerably. This report also includes links to some recent example “how-to” videos.

Oil Trade Coaching – We strongly suggest users of this algorithmic crude oil trading strategy opt for some level of private one-on-one coaching with our lead trader. Our lead trader is currently maintaining a crude oil trading alert win-rate of over 90% (as of Sept 2, 2018 – time-stamped, live alert, recorded).

On our website one-on-one online coaching packages are made available (coaching via Skype) or you can request a custom package reflecting the time you wish to invest in learning. To request a custom package suited to your needs email [email protected] or click here for standard private trade coaching packages. Other options for coaching include online webinars, trade coaching bootcamps and private on location (in person) coaching sessions. 

Oil Trading Room – How to Use the Oil Algorithm

Oil Trading Room – How to Trade Intra-day with my Algorithmic Oil Charting

Oil Trading Alerts. Live Lead Trader Video Trading w EPIC Oil Algorithm

Recent articles from our blog about how to trade crude oil with our oil trading algorithm:

Protected: Crude Oil Trading Strategy – How I Will be Trading Oil in to Time Cycles.

Protected: Oil Trading Room – Oil Trading Signals with Lead Trader (plus video).

Crude Oil Trading Room – Member Oil Trade Signals / Alerts for Trading the EIA Report (w/ video)

Oil Trade Alerts: How We Knew Where Oil Sell-Off Bottom Was in Advance. Crude Oil Trading Strategy.

Crude Oil Trading Face-Off Results “Pro Trader” (Man) vs. EPIC Oil Algorithm (Machine Trading Tech).

Oil Trading Alerts Live Video w EPIC Oil Algorithm #EIA Report.

“The Nut Hand” Today’s Huge Oil Trade Win. Exactly How It Was Done. How I Knew & How You Can Too.

CRITICAL Oil Trade. Weekly Timing. EPIC Oil Algorithm Channel $USOIL $WTI $CL_F $USO. 

MULTI-USERS: Institutional / commercial platform now available.

SOFTWARE: My algorithmic charting is now also in the coding phase for our trader’s dashboard program. Please review my algorithm development process, about my oil algorithm story on our website www.compoundtrading.com and my oil algo charting posts on my Twitter feed and/or this blog.

HOW MY ALGORITHM WORKS: I am an oil algorithm model in development. My math is based on traditional indicators (up to fifty at any given time each weighted on win ratio merit – all not shown on chart at any given time) – such as simple math calculations relating to price and volume, Fibonacci, simple pivots, moving averages, Gann, Schiff and various other charting, geometric and mathematical factors. I do not yet have AI integration – only math as it relates to traditional indicators with the primary goal being probabilities. I am not a high frequency robot type algorithm – I am presented on (and used on) a traditional trading chart as one would normally use as a probability indicator.

The goal is to provide oil traders with a signals edge when triggering entries and exits on trades with instruments that rely on the price of crude oil – first with the reporting format as below, then with machine trading functions and an integrated intelligent assisted traders platform that will provide the user with various settings of automation and personal trade execution.

In the weekly report below you will find simplified levels represented on conventional and algorithmic charting for intra-day (day-trading crude oil), swing trading and investing.

This work (and associated trading) should be considered one decision at a time, “if this happens then this or this are my targets”… price – trigger – trade and so on.oil related financial instruments.

Forward questions to [email protected], private message our lead trader on Twitter or in the private Discord oil trading room.

For further information this link explains how our algorithmic charting is done, this YouTube video explains in summary how my algorithm works https://www.youtube.com/watch?v=LUNyxFoXJp8 this link for more information about our algorithmic stock charting models and what makes them different than most.

EVERY CALL WE MAKE, EVERY PUBLIC INTERACTION, REPRESENTATION OF TRADE SIGNAL (ON EVERY VENUE) IS VIDEO RECORDED, ON SOCIAL MEDIA OR ON BLOG / WEBSITE TIME-STAMPED FOR PERMANENT RECORD AND TRANSPARENCY. PLEASE ALSO REFER TO OUR PUBLIC DISCLOSURE https://compoundtrading.com/disclosure-disclaimer/.

Oil Algorithm Observations:

Below is a link for the live algorithmic chart of EPIC the Crude Oil Trading Algorithm (Generation 1, Version 5 including black box modeling). The charting is a real-time trading chart represented on FX $USOIL $WTI published October 15, 2018.

Click on share button (bottom right beside flag) and when that screen opens click on “make it mine” to view real-time, make edits etc:

https://www.tradingview.com/chart/USOIL/FzwUoxSB-Crude-Oil-Trading-Algorithm-Gen1-V5-EPIC-Intra-day-crude-oil/

Crude, oil, algorithm, trading
Crude Oil Trading Algorithm. Gen1.V5 (EPIC). Intra-day crude oil trade. Oct 14 1157 PM FX $USOIL $WTI $USO $CL_F #Crude #Oil #Trading #Algorithm

October 15, 2018

Generation 1 Model Oil Trading Signals

The first most predictable trade are the resistance and support cluster areas formed by long term chart trend lines (see charts that have trend-lines represented in red as made available below near bottom of this report – conventional charting trend-lines).

The second most predictable trade (wide trading range primary resistance and support that become predictable buy and sell triggers). Current algorithmic model wide trading range resistance (grey arrow – grey horizontal line) at approximately 72.52 in the current trading range. Current algorithmic model wide trading range support (grey arrow – grey horizontal line) at approximately 68.93 in the current trading range – these areas are general range support and resistance areas (our algorithm uses a .15 – .20 cent buffer on either side for these trades – if that is exceeded then trading price is likely to use the line as a pivot until a directional trending trade is established).

Trading between the resistance / support horizontal grey lines is extremely profitable risk – reward if one is disciplined to the patience required and follows the trend of trade.

More recently (as of September 2018) our back-testing has shown that the support and resistance areas noted are used in trade as a decision pivot – in other words, the price tends to pivot around these decision points on the chart and coil over a period of time and then spring out of the coil in an upward or downward trend.

The lower trading range is 65.32 – 68.92 and upper trading range 68.93 – 72.54.

Third most predictable trade (support and resistance of uptrend or down trend channels). On the chart an upward trending trade channel is presented and a downward option (channel support and resistance / trading range is represented as diagonal dotted orange lines and purple arrows – as made available, assist in displaying directional trade decision areas).

Fourth most predictable trade (support and resistance of 30 min quadrants). The diagonal lines make up quadrants (in this instance on a 30 min chart) and are represented as orange diagonal lines that make up geometric diamond shapes. These lines also assist in intra-day trade.

Fifth most predictable trade (support and resistance of most applicable Fibonacci) the Fib support and resistance lines are the horizontal lines in various colors with the exception of purple and yellow (see below). These horizontal lines become support and resistance for intra-day trade.

Sixth most predictable trade (support and resistance of historical support and resistance) Natural / historical support and resistance lines shown in purple or yellow – they represent historical support and resistance. The strongest of the historical support and resistance lines are shown in yellow horizontal and are typically accompanied by a yellow arrow marker.

Seventh most predictable trade signal we use are the time and price targets (red circles). When trade is in a significant uptrend or downtrend the targets become very precise and move up the indicator priority list quick.

Tues, Wed and Fri targets are most predictable in extended multi week uptrends or downtrends. In recent time, trade could be described as being in a retrace / moderately range bound.

The Eighth most predictable trade is intra-day. You will notice on some of the charting geometric shapes in green on some of my charting (at times). They are charted live in the trading room and at times the lead trader will highlight these areas intra with white outlines (typically geometric shapes such as diamonds or triangles).

Intra-day Trading Bias

Intra day bias is down side trade as the MACD is turned down on the daily chart and this indicator is usually a leading indicator for oil trade on this time-frame.

Wide Trading Range – Buy and Sell Triggers for Swing Trading Crude Oil:

Swing trading bias / forward guidance as of Oct 15, 2018 12:16 AM EST for the near term (two week swing trade) is bearish. 

Trade the ranges noted above between the thick grey lines (grey arrows) for the most predictable swing trades between 58.13 to 61.72, 61.72 to 65.32, 65.32 to 68.92, 68.93 to 72.54, 72.55 to 76.14 and 76.15 to 79.74. This is a highly profitable risk-reward way to trade oil if you can be patient to trigger at only the break of the wide range charting areas and are disciplined to cut a losing trade that does not prove in your anticipated trend.

Or trade the range between the channel diagonal lines at support and resistance in up or down channel (orange dotted diagonals).

Significantly more advanced trading rules will be introduced over the coming weeks with the newer Generation 2 models per below in this report.

Crude Oil Trading Algorithm. Gen1.V5 (EPIC). Uptrend channel oil scenario. Oct 15 1219 AM FX $USOIL $WTI $USO $CL_F #Crude #Oil #Algorithm #OOTT

Oil, trading, algorithm, uptrend, channel
Crude Oil Trading Algorithm. Gen1.V5 (EPIC). Uptrend channel oil scenario. Oct 15 1219 AM FX $USOIL $WTI $USO $CL_F #Crude #Oil #Algorithm #OOTT

Crude Oil Trading Algorithm. Gen1.V5 (EPIC). Downtrend channel oil scenario. Oct 15 1218 AM FX $USOIL $WTI $USO $CL_F #Crude #Oil #Algorithm #OOTT

crude, oil, algorithm, down channel
Crude Oil Trading Algorithm. Gen1.V5 (EPIC). Downtrend channel oil scenario. Oct 15 1218 AM FX $USOIL $WTI $USO $CL_F #Crude #Oil #Algorithm #OOTT

Generation 2 Model Oil Trading Signals.

October 15 – Generation 2 model is currently in back-testing and will be released to members when available. Below are a few versions of late.

Per recent;

Crude Oil Trading Algorithm. Gen2.V2 (EPIC). Machine trading intra-day. Sept 17 552 AM FX $USOIL $WTI $USO $UWT $DWT $CL_F #Crude #Oil #Algorithm #OOTT

This is an alternate machine trading model currently in development.

https://www.tradingview.com/chart/USOIL/KZPGrSny-Crude-Oil-Trading-Algorithm-Gen2-V2-EPIC-Machine-trading-int/

Crude, oil, machine, trading, algorithm
Crude Oil Trading Algorithm. Gen2.V2 (EPIC). Machine trading intra-day. Sept 17 552 AM FX $USOIL $WTI $USO $UWT $DWT $CL_F #Crude #Oil #Algorithm #OOTT

Per previous;

Crude Oil Trading Algorithm. Gen2.V1 (EPIC). Machine trading intra-day. Sept 11 1246 AM FX $USOIL $WTI $USO $UWT $DWT $CL_F #Crude #Oil #Algorithm #OOTT

https://www.tradingview.com/chart/USOIL/zBBnd8C8-Crude-Oil-Trading-Algorithm-Gen2-V1-EPIC-Machine-trading-int/

Crude, oil, algorithm, machine, trading
Crude Oil Trading Algorithm. Gen2.V1 (EPIC). Machine trading intra-day. Sept 11 1246 AM FX $USOIL $WTI $USO $UWT $DWT $CL_F #Crude #Oil #Algorithm #OOTT

Generation 1 Day-trading Crude Oil 1 Minute Chart Signals

Oct 2 – Currently in update, will be released when available.

During a squeeze trade spikes upward through the highlighted area and then rests and works its way through the next area and spikes through the next highlighted area. This does not occur in regular trade. More on this chart in our special reporting for oil trading over the coming days.

Per recent;

7:58 AM update Sept 17:

Crude Oil Day-Trading Chart Signals. 1 minute time frame. Sept 17 723 AM FX $USOIL $WTI $USO $UWT $DWT $CL_F #OIL #Chart

https://www.tradingview.com/chart/USOIL/dn38QRqh-Crude-Oil-Day-Trading-Chart-Signals-1-minute-time-frame-Sept-1/

Crude, oil, chart, 1 min
Crude Oil Day-Trading Chart Signals. 1 minute time frame. Sept 17 723 AM FX $USOIL $WTI $USO $UWT $DWT $CL_F #OIL #Chart

Crude Oil Swing Trade Charting.

Monthly Oil Chart:

Crude Oil Monthly Chart. Trade between 100 and 200 MA with MACD up. Oct 15 1234 AM FX $USOIL $WTI $USO $CL_F #OIL #chart

crude, oil, monthly, chart
Crude Oil Monthly Chart. Trade between 100 and 200 MA with MACD up. Oct 15 1234 AM FX $USOIL $WTI $USO $CL_F #OIL #chart

Weekly Crude Oil Chart:

Crude Oil Weekly Chart Wedge. Trade in lower half of trading range of wedge. Oct 15 1239 AM FX $USOIL $WTI $USO $CL_F 

https://www.tradingview.com/chart/USOIL/TvX2z0qi-Crude-Oil-Weekly-Chart-Wedge-Trade-in-lower-half-of-trading-ran/

weekly, crude, oil, chart, wedge
https://www.tradingview.com/chart/USOIL/TvX2z0qi-Crude-Oil-Weekly-Chart-Wedge-Trade-in-lower-half-of-trading-ran/

Recent reporting for this chart set-up:

Crude Oil Weekly Chart Wedge. Testing resistance points on chart intra-day. Oct 2 521 AM FX $USOIL $WTI $USO $CL_F

https://www.tradingview.com/chart/USOIL/ZleXvNiq-Crude-Oil-Weekly-Chart-Wedge-Testing-resistance-points-on-chart/

Crude, oil, weekly, chart
Crude Oil Weekly Chart Wedge. Testing resistance points on chart intra-day. Oct 2 521 AM FX $USOIL $WTI $USO $CL_F #oiltradealerts

Per previous for reference;

1 of … Crude Oil Weekly Chart Wedge. Very bullish oil trading signal here, lower trend line held w break to upside. Sept 24 1204 AM

https://www.tradingview.com/chart/USOIL/H3tBaTZ3-1-of-Crude-Oil-Weekly-Chart-Wedge-Very-bullish-oil-trading/

crude, oil, trade, alerts, signals
1 of … Crude Oil Weekly Chart Wedge. Very bullish oil trading signal here, lower trendline held w break to upside. Sept 24 1204 AM FX $USOIL $WTI $USO $CL_F #oiltradealerts

2 of … Crude Oil Weekly. Over 71.76 suggests 74.20 – 79.00 in to Oct 22. Sept 24 1209 AM

crude oil, trade, alerts, price, targets
2 of … Crude Oil Weekly. Over 71.76 suggests 74.20 – 79.00 in to Oct 22. Sept 24 1209 AM FX $USOIL $WTI $USO $CL_F #oiltradealerts

3 of … Crude Oil Weekly. Resistance 71.76, 74.20, 78.17, 79.00, 79.34 ish. Sept 24 1211 AM

crude. oil, trade, alerts, resistance
3 of … Crude Oil Weekly. Resistance 71.76, 74.20, 78.17, 79.00, 79.34 ish. Sept 24 1211 AM FX $USOIL $WTI $USO $CL_F #oiltradealerts

4 of 4 … Crude Oil Weekly. If it fails for some reason, it targets 68.58 – 69.21 Oct 22. Sept 24 1215 AM

Crude, oil. trading, chart, downside, targets
4 of 4 … Crude Oil Weekly. If it fails for some reason, it targets 68.58 – 69.21 Oct 22. Sept 24 1215 AM FX $USOIL $WTI $USO $CL_F #oiltradealerts

Daily Oil Charts:

Crude Oil Daily Chart, MACD crossed down with trade testing mid pivot Oct 15 1244 AM FX $USOIL $WTI $USO $CL_F #OIL #chart

https://www.tradingview.com/chart/USOIL/boaVJYSK-Crude-Oil-Daily-Chart-MACD-crossed-down-with-trade-testing-mid/

crude, oil, chart, daily, MACD, pivot
Crude Oil Daily Chart, MACD crossed down with trade testing mid pivot Oct 15 1244 AM FX $USOIL $WTI $USO $CL_F #OIL #chart

Crude Oil Daily basic algorithmic chart model highlighting symmetry scenarios of trade. Oct 14 1249 AM FX $USOIL $WTI $USO $CL_F #OIL #chart #algorithm #symmetry

https://www.tradingview.com/chart/USOIL/Ts6Pa0Ud-Crude-Oil-Daily-basic-algorithmic-chart-model-highlighting-symme/

crude, oil, symmetry
Crude Oil Daily basic algorithmic chart model highlighting symmetry scenarios of trade. Oct 14 1249 AM FX $USOIL $WTI $USO $CL_F #OIL #chart #algorithm #symmetry

Diagonal Trend Lines:

Diagonal trend-lines are critical inflection points (currently represented in red below on our conventional charting).

Please review many of my recent posts so you can learn about how important these diagonal trend-lines are. If one is breached you can look to pull-back to next diagonal trend line about 90% of the time. Also pay attention to how thick the lines are – the thicker the line the more important because they represent extensions from previous time / price cycles.

Remember you can come in to the chat room to message the trader and REMEMBER I have posted a live chart link in this post so if you can’t see the lines well on this chart above you can go to the live chart link and watch for member live algo chart links through-out the day in your email inbox!

The diagonal trend-lines are marked on chart below:

Crude Oil Weekly chart trend-lines suggest approx 75.71 peak price approx Nov 12 Oct 15 1254 AM FX $USOIL $WTI $USO $CL_F #OIL #chart #trendlines

https://www.tradingview.com/chart/USOIL/7ZgJp2nU-Crude-Oil-Weekly-chart-trendlines-suggest-approx-75-71-peak-pric/

Crude, oil, weekly, chart, trendlines
Crude Oil Weekly chart trendlines suggest approx 75.71 peak price approx Nov 12 Oct 15 1254 AM FX $USOIL $WTI $USO $CL_F #OIL #chart #trendlines

Sept 17: Previous remains signal;

Oil Chart (Weekly). Oil trend lines on weekly time-frame. Aug 12 951 PM FX $USOIL $WTI $USO $UWT $DWT $CL_F #OIL

Significant probability oil hits 79.50 ish Dec 3, 2018 ish. But over that area unlikely unless there is a geo political event. Over 79.50 the shorts would get wrecked. Low 50s most probable by 2022. Early Dec 2018 is likely the highs. $USOIL $WTI $CL_F $USO #OOTT

https://www.tradingview.com/chart/USOIL/ouLad9xj-Crude-oil-weekly-trendline-chart-suggests-79-50-area-Dec-3-2018/

oil, trend lines, chart
Oil Chart (Weekly). Oil trend lines on weekly time-frame. Aug 12 951 PM FX $USOIL $WTI $USO $UWT $DWT $CL_F #OIL

Oil Chart (Weekly). Oil trend lines on weekly time-frame. Aug 7 605 AM FX $USOIL $WTI $USO $UWT $DWT $CL_F #OIL

https://www.tradingview.com/chart/USOIL/bS8T4ism-Oil-Chart-Weekly-Oil-trend-lines-on-weekly-time-frame-Aug-7/

Oil, trend line, chart
Oil Chart (Weekly). Oil trend lines on weekly time-frame. Aug 7 605 AM FX $USOIL $WTI $USO $UWT $DWT $CL_F #OIL

Previous posts for perspective;

Oil has now cleared every trendline resistance provided on conventional charting I’ve posted last year. $USOIL $WTI $CL_F #OOTT #OIL $USO $UWT $DWT 233 PM Jan 1

Oil, trendline, resistance, chart
Oil has now cleared every trendline resistance provided on conventional charting I’ve posted last year. $USOIL $WTI $CL_F #OOTT #OIL $USO $UWT $DWT 233 PM Jan 1
$USOIL, $WTI, Chart, Trendlines
Simple lines show expose clusters of resistance. Crude algo intra work sheet 201 AM Apr 10 FX $USOIL $WTIC #OIL $CL_F CL $USO $UCO $SCO $UWT $DWT #OOTT

Notice when the daily chart is opened, the simple lines extend to current day trade.

Daily chart view. Simple lines show expose clusters of resistance. Crude algo intra work sheet 213 AM Apr 10 FX $USOIL $WTIC #OIL $CL_F CL $USO $UCO $SCO $UWT $DWT #OOTT

Daily, $USOIL $WTI, Chart, Trendlines
Daily chart view. Simple lines show expose clusters of resistance. Crude algo intra work sheet 213 AM Apr 10 FX $USOIL $WTIC #OIL $CL_F CL $USO $UCO $SCO $UWT $DWT #OOTT

Fibonacci Levels:

Watch the lines for support and resistance. Careful using them as traditional retracement levels with crude because the algo lines etc are more dominant / predictable. But the Fib lines are excellent indicators for intra-day trade support and resistance.

The Fibonacci lines are marked on main chart above.

Horizontal Trend-Lines (purple):

Horizontal trend-lines are not as important as the other indicators reviewed above, however, they do serve as important resistance and support intra-day for tight trading and they are important if thick (in other words they come from previous time / price cycles). WE STARTED TO REPRESENT THE REALLY IMPORTANT LINES IN YELLOW FYI FOR EASE. Refer to chart for current applicable horizontal trend-lines.

Horizontal trend-lines are marked on charts above.

Oil Time / Price Cycles:

Watch your email and / or my Twitter feed for time price cycles they may start to terminate.

Time / price cycles are the single most important indicator and my record calling them is near 100% – since inception seven months ago. The reason they are so important is that a trader does not want to be holding a crude oil instrument at termination of a time cycle if not absolutely sure if price will go up or down. A trade may choose to enter a large position in advance of a time price cycle termination IF THERE IS A HIGH PROBABILITY OF A DIRECTION IN PRICE and if the market is trading at a really important pivot area. In other words, if the market is trading at the bottom of the upward trending channel at a support (yellow lines) and we knew there was a significant probability of a time cycle about to terminate a trader may enter with a long position. The price really spikes or drops significantly when these important time cycles terminate.

The problem with time / price cycle terminations is they change from minute to minute (depending on where price is on the chart) so you have to be in the trade room to get the alert. Our lead traders will do everything they can in future to send these on SMS but we have to be careful because it can be difficult with so much going on in the room. The reason they (time cycles) change is because they are actually represented by or are geometric shapes in the chart – I know it sounds odd but I have (as I mentioned) hit these calls just shy of 100%. The oil political people know the same algorithmic modeling principles and they ALWAYS TIME THEIR BIG ANNOUNCEMENTS AROUND THE TIME PRICE CYCLE TERMINATIONS.

So if you can picture a triangle on the chart – and price is trading in the triangle – and price is going to come to the edge of the triangle and there is a significant support or resistance or an algo line terminating there too or a target (those type of indications)… then we know there is a high probability of a time and price change. In other words, it is where there are clusters of algorithm points that cross and when price is going to cross over that cluster is where they are. And these are represented on all the different time frames – the larger the time frame – the larger the time price cycle termination – the larger the spike or downdraft. This is where we establish our intra-day quadrants from for sniping trades (which we will put in to the room soon because it looks like the geo political rhetoric is over for a while making them more predictable). Difficult to explain in short. So we will do our best to SMS alert these in future.

Also, the real large or important time / price cycle terminations we know far in advance and they can be put in these newsletters.

If you review my Epic the Oil Algo Twitter feed, my blog posts and my story on our website you will get a feel for how accurate these calls are.

Alpha Algo Trading Trend-Lines (Primary – Red dotted lines. Secondary – White dotted lines):

To determine which algo line is most alpha (or probable) intra day, it is the nearest line to price action. This can also help you determine the trend of trade. If the algo line is trending up the price will follow it up until price is tested at an algorithm indicator (the main tests are diagonal trendlines, horizontal trendlines, time / price cycles etc – as I have shared with you). This is why it is important to watch all the lines because they are all support and resistance. To keep it simple trade the range (yellow lines) as I’ve mentioned but keep an eye on these indicators.

Current Alpha Algo Targets (Red circles):

Your closest target that crude is trending toward is always the most probable.Then, your second most probable is the one that is up or down trend depending on whether general price is in an upward or downtrend for the most recent week or so and what your other indicators look like (such as the MA’s I explained above).

The other way to determine which targets are in play is actually quite simple, you will notice that crude trades between the channel lines up and down and up and down and there are various support and resistance along the way. If it hits a target at the top of the channel you can bet most times (unless the next day like today) that the next target hit will be at the bottom of the channel.

Wait for the price to trend toward a target and take your position and watch as price gets closer and closer to the target. Remember, that the machines trade from decision to decision – or in other words from support to next resistance or resistance to next support or when the times come each week on Tuesday Wednesday and Friday they will trend toward the target that market price action determines they go to.

Our lead trader will explain more in the room and do not hesitate to ask our lead trader in the room by private message or on twitter to explain intra day decisions.

Recent Live Crude Oil Trade Alerts (sample signals):

Oct 15 – Recent trade alerts will be updated soon.

Aug 12 2018 – Recent trades are found in this recent report:

Crude Oil Trading Face-Off Results “Pro Trader” (Man) vs. EPIC Oil Algorithm (Machine Trading Tech)

Click on feature post for recent crude oil trading alerts blog post; Oil Trading Alerts Live Video w EPIC Oil Algorithm #EIA Report #Oil #Trading #Algorithm #Alerts $USOIL $WTI $CL_F

Recent Oil Algorithm Price Target Hits:

Oct 15 – Price Target Reporting will be updated soon.

Wed 1030 EIA report lower price target a perfect hit published on weekend report. Oil Algorithm (EPIC). FX $USOIL $WTI $USO $UWT $DWT $CL_F #OIL #Algorithm #OOTT

https://twitter.com/EPICtheAlgo/status/1024665109338222592

Oil Intra-Day Algo Trading Quadrants (white dotted lines):

Trading quadrants are simply support and resistance lines that can assist your intra-day trading – they are not alpha or primary support and resistance by any measure. Price action does however typically move more assertively when leaving a trading quadrant.

Indicator Methods:

As explained above, my algorithm is a consideration of up to fifty traditional indicators at any one time – each one given its own weight in accordance to its accuracy (win rate). This is how we establish the probability of specific targets hitting (we call them alpha algo targets).

Alpha Algo Targets, Algo Trend-lines, Algo Timing, Quadrants for Intra Snipes

Algo targets are the red circles – they correspond with important times each week in oil reporting land. Tuesday 4:30 PM, Wednesday 10:30 AM and Friday at 1:00 PM. The red dotted diagonal lines are the algo trend-lines. And the vertical dotted (red or green) are marking the important times each week. You will find that the price of crude will hit one of the alpha algo targets about 90% of the time. In the absence of market direction the machines take price to the next algo line and/or target. Understanding how the price of crude reacts to the algos and how they move price from target to target is critical for intra-day and swing trading crude oil and associated instruments.

You will notice that price action of crude will use these algo trend-lines and act as support and resistance, and that price also often violently moves when an alpha algo line is breached either upward or downward.

We cover this in much more detail in the member updates, trading room. A review of my Twitter feed and previous blog posts will help you understand the relation of these indicators. We will start posting video blogs (for my subscribers) on YouTube (in addition to my daily blog posts) for swing traders that work during regular trading hours.

Also… we will cover how to establish algo trend-lines and price targets future forward (as you have seen me do on my Twitter feed for some time now).

Conclusion:

See you in the live trade room! And again, if you struggle to know how to use these indicators as a trader’s edge, it is recommended (if you have earnestly reviewed all of our documentation first) that you obtain private coaching prior to trading a real account with real money – we recommend you use a paper trading account at first.

You can also send specific questions to our email inbox at [email protected] – if you do this be sure to ask a specific question so it can be answered specifically. When the 24 hour oil trading room opens you will have ample opportunity in that 24 hour room to ask questions also.

Watch my EPIC the Oil Algo Twitter feed for intra day notices and your email in box for member only material intra day also.

EPIC the Oil Algo

Subscribe to Service Here:

Standalone Crude Oil Algorithm Newsletter (member charting sent out weekly).

Real-Time Crude Oil Trading Alerts (Private Twitter feed).

Crude Oil Trading Room Bundle (includes weekly newsletter charting and real-time trading alerts on Twitter).

Commercial / Institutional Multi User License (for professional trading groups).

One-on-One Trade Coaching (Via Skype or in person).

Connect:

Register to free email list for trade set-ups, webinars, special events: https://compoundtrading.com/contact/

Website: https://compoundtrading.com

Blog: https://compoundtrading.com/blog/

Free chat room: https://discord.gg/2HRTk6n

Subscribe: https://compoundtrading.com/overview-…

Twitter: https://twitter.com/CompoundTrading

Lead Trader: https://twitter.com/curtmelonopoly

Tradingview: https://www.tradingview.com/u/curtmel…

Facebook: https://www.facebook.com/compoundtrad…

StockTwits: https://stocktwits.com/compoundtrading

Email: https://[email protected]

Curtis Melonopoly (@curtmelonopoly) is rated Top 250 Stock exchanges authority, covering also Mathematical finance and Economy of the United States

Tweets by EPICtheAlgo


Article topics: EPIC, Crude, Oil, Algorithm, Trade, Alerts, Trading Room, Chat, Charts, Signals, $USOIL, $WTI, $USO, $CL_F

Read More
Crude Oil Algorithm Trading Report (EPIC) w/ Gen 2 Machine Trade Tues Oct 2 FX: $USOIL $WTI $CL_F $USO #Oil #Trading #Algorithm

Crude Oil Algorithm Trading Report (EPIC) w/ Gen 2 Machine Trade Tues Oct 2 FX: $USOIL $WTI $CL_F $USO #Oil #Trading #Algorithm

October 2, 2018February 5, 2019 Epic the AlgoCrude Oil Trading Algorithm (EPIC)$CL_F, $USO, $USOIL, $WTI, Alerts, Algorithm, Charts, chat, Crude, EPIC, Oil, Signals, Trade, Trading Room

Crude Oil Trading Algorithm Chart Report (EPIC) Tuesday October 2, 2018.

FX: $USOIL $WTI $USO $CL_F $UWT $DWT $UCO $SCO $ERX $ERY $GUSH $DRIP

Welcome to the oil trading algorithm report. My name is EPIC the Oil Algorithm and I am one of the seven primary Algorithmic Chart Models in development at Compound Trading Group (there are over one hundred in total in development at various stages in various markets).

NOTICES:

New members to our oil algorithm charting models, oil trade alerts and oil trading room are encouraged to on-board in a way that equips you as an oil trader for consistent profit.

Visit my public Twitter feed EPIC Oil Algorithm Twitter (@EPICtheAlgo) and review tweets over the last few months, visit our blog and review the recent crude oil trading algorithm blog posts, our You Tube channel “how my oil algorithm works”, “how to use my charting”, weekly EIA oil report videos and our website explains how the oil algorithm was developed.

Invaluable are the crude oil trade alerts (available with or without the trading room / weekly report bundle) and the private member crude oil trading chat room on Discord (included in the bundle). The live alerts are important if you are not at your trading screens 24 hours a day and the chat room allows for interactive lead trader oil trade set-ups as each oil trade approaches.

Reviewing important points of reference and engaging the subscription resources will increase your probability of success considerably. This report also includes links to some recent example “how-to” videos.

Oil Trade Coaching – We strongly suggest users of this algorithmic crude oil trading strategy opt for some level of private one-on-one coaching with our lead trader. Our lead trader is currently maintaining a crude oil trading alert win-rate of over 90% (as of Sept 2, 2018 – time-stamped, live alert, recorded).

On our website one-on-one online coaching packages are made available (coaching via Skype) or you can request a custom package reflecting the time you wish to invest in learning. To request a custom package suited to your needs email [email protected] or click here for standard private trade coaching packages. Other options for coaching include online webinars, trade coaching bootcamps and private on location (in person) coaching sessions. 

Oil Trading Room – How to Use the Oil Algorithm

Oil Trading Room – How to Trade Intra-day with my Algorithmic Oil Charting

Oil Trading Alerts. Live Lead Trader Video Trading w EPIC Oil Algorithm

Recent articles from our blog about how to trade crude oil with our oil trading algorithm:

Crude Oil Trading Room – Member Oil Trade Signals / Alerts for Trading the EIA Report (w/ video)

Oil Trade Alerts: How We Knew Where Oil Sell-Off Bottom Was in Advance. Crude Oil Trading Strategy.

Crude Oil Trading Face-Off Results “Pro Trader” (Man) vs. EPIC Oil Algorithm (Machine Trading Tech).

Oil Trading Alerts Live Video w EPIC Oil Algorithm #EIA Report.

“The Nut Hand” Today’s Huge Oil Trade Win. Exactly How It Was Done. How I Knew & How You Can Too.

CRITICAL Oil Trade. Weekly Timing. EPIC Oil Algorithm Channel $USOIL $WTI $CL_F $USO. 

MULTI-USERS: Institutional / commercial platform now available.

SOFTWARE: My algorithmic charting is now also in the coding phase for our trader’s dashboard program. Please review my algorithm development process, about my oil algorithm story on our website www.compoundtrading.com and my oil algo charting posts on my Twitter feed and/or this blog.

HOW MY ALGORITHM WORKS: I am an oil algorithm model in development. My math is based on traditional indicators (up to fifty at any given time each weighted on win ratio merit – all not shown on chart at any given time) – such as simple math calculations relating to price and volume, Fibonacci, simple pivots, moving averages, Gann, Schiff and various other charting, geometric and mathematical factors. I do not yet have AI integration – only math as it relates to traditional indicators with the primary goal being probabilities. I am not a high frequency robot type algorithm – I am presented on (and used on) a traditional trading chart as one would normally use as a probability indicator.

The goal is to provide oil traders with a signals edge when triggering entries and exits on trades with instruments that rely on the price of crude oil – first with the reporting format as below, then with machine trading functions and an integrated intelligent assisted traders platform that will provide the user with various settings of automation and personal trade execution.

In the weekly report below you will find simplified levels represented on conventional and algorithmic charting for intra-day (day-trading crude oil), swing trading and investing. You will also find below introduction of our Generation 2 machine trading models.

This work (and associated trading) should be considered one decision at a time, “if this happens then this or this are my targets”… price – trigger – trade and so on.oil related financial instruments.

Forward questions to [email protected], private message our lead trader on Twitter or in the private Discord oil trading room.

For further information this link explains how our algorithmic charting is done, this YouTube video explains in summary how my algorithm works https://www.youtube.com/watch?v=LUNyxFoXJp8 this link for more information about our algorithmic stock charting models and what makes them different than most.

EVERY CALL WE MAKE, EVERY PUBLIC INTERACTION, REPRESENTATION OF TRADE SIGNAL (ON EVERY VENUE) IS VIDEO RECORDED, ON SOCIAL MEDIA OR ON BLOG / WEBSITE TIME-STAMPED FOR PERMANENT RECORD AND TRANSPARENCY. PLEASE ALSO REFER TO OUR PUBLIC DISCLOSURE https://compoundtrading.com/disclosure-disclaimer/.

Oil Algorithm Observations:

Below is a link for the live algorithmic chart of EPIC the Crude Oil Trading Algorithm (Generation 1, Version 5 including black box modeling). The charting is a real-time trading chart represented on FX $USOIL $WTI published October 2, 2018.

Per member request we will continue to post both Gen 1 and Gen 2 models (we had previously planned to discontinue including Gen 1 in weekly reporting).

Click on share button (bottom right beside flag) and when that screen opens click on “make it mine” to view real-time, make edits etc:

Crude Oil Trading Algorithm. Gen1.V5 (EPIC). Intra-day crude oil trade. Oct 2 410 AM FX $USOIL $WTI $USO $CL_F #Crude #Oil #Trading #Algorithm

https://www.tradingview.com/chart/USOIL/jgyY6g45-Crude-Oil-Trading-Algorithm-Gen1-V5-EPIC-Intra-day-crude-oil/

Crude, oil, trading, algorithm
Crude Oil Trading Algorithm. Gen1.V5 (EPIC). Intra-day crude oil trade. Oct 2 410 AM FX $USOIL $WTI $USO $CL_F #Crude #Oil #Trading #Algorithm

October 2, 2018

Generation 1 Model Oil Trading Signals

The first most predictable trade are the resistance and support cluster areas formed by long term chart trend lines (see charts that have trend-lines represented in red as made available below near bottom of this report – conventional charting trend-lines).

The second most predictable trade (wide trading range primary resistance and support that become predictable buy and sell triggers). Current algorithmic model wide trading range resistance (grey arrow – grey horizontal line) at approximately 76.14 in the current trading range. Current algorithmic model wide trading range support (grey arrow – grey horizontal line) at approximately 72.55 in the current trading range – these areas are general range support and resistance areas (our algorithm uses a .15 – .20 cent buffer on either side for these trades – if that is exceeded then trading price is likely to use the line as a pivot until a directional trending trade is established).

Trading between the resistance / support horizontal grey lines is extremely profitable risk – reward if one is disciplined to the patience required and follows the trend of trade.

More recently (as of September 2018) our back-testing has shown that the support and resistance areas noted are used in trade as a decision pivot – in other words, the price tends to pivot around these decision points on the chart and coil over a period of time and then spring out of the coil in an upward or downward trend.

The lower trading range is 68.92 – 72.54 and upper trading range 76.15 – 79.74.

Third most predictable trade (support and resistance of uptrend or down trend channels). On the chart an upward trending trade channel is presented and a downward option (channel support and resistance / trading range is represented as diagonal dotted orange lines and purple arrows – as made available, assist in displaying directional trade decision areas).

Fourth most predictable trade (support and resistance of 30 min quadrants). The diagonal lines make up quadrants (in this instance on a 30 min chart) and are represented as orange diagonal lines that make up geometric diamond shapes. These lines also assist in intra-day trade.

Fifth most predictable trade (support and resistance of most applicable Fibonacci) the Fib support and resistance lines are the horizontal lines in various colors with the exception of purple and yellow (see below). These horizontal lines become support and resistance for intra-day trade.

Sixth most predictable trade (support and resistance of historical support and resistance) Natural / historical support and resistance lines shown in purple or yellow – they represent historical support and resistance. The strongest of the historical support and resistance lines are shown in yellow horizontal and are typically accompanied by a yellow arrow marker.

Seventh most predictable trade signal we use are the time and price targets (red circles). When trade is in a significant uptrend or downtrend the targets become very precise and move up the indicator priority list quick.

Tues, Wed and Fri targets are most predictable in extended multi week uptrends or downtrends. In recent time, trade could be described as range-bound.

The Eighth most predictable trade is intra-day. You will notice on some of the charting geometric shapes in green on some of my charting (at times). They are charted live in the trading room and at times the lead trader will highlight these areas intra with white outlines (typically geometric shapes such as diamonds or triangles).

Intra-day Trading Bias

Intra day bias is up as the MACD is turned up on the daily chart and this indicator is usually a leading indicator for oil trade on this time-frame.

Wide Trading Range – Buy and Sell Triggers for Swing Trading Crude Oil:

Swing trading bias / forward guidance as of Sept 24, 2018 1:16 AM EST for the near term (two week swing trade) is bullish in uptrending channels as trade bounced off range support on up-trending wedge charting. 

Trade the ranges noted above between the thick grey lines (grey arrows) for the most predictable swing trades between 58.13 to 61.72, 61.72 to 65.32, 65.32 to 68.92, 68.93 to 72.54, 72.55 to 76.14 and 76.15 to 79.74. This is a highly profitable risk-reward way to trade oil if you can be patient to trigger at only the break of the wide range charting areas and are disciplined to cut a losing trade that does not prove in your anticipated trend.

Or trade the range between the channel diagonal lines at support and resistance in up or down channel (orange dotted diagonals).

Significantly more advanced trading rules will be introduced over the coming weeks with the newer Generation 2 models per below in this report.

Also, the recent trade coaching boot camp provided for excellent trading on the Friday in oil and also many other charting set-ups.

Crude Oil Trading Algorithm. Gen1.V5 (EPIC). Downtrend channel oil scenario. Oct 2 509 AM FX $USOIL $WTI $USO $CL_F #Crude #Oil #Algorithm #OOTT

Crude, oil, trading, algorithm, downtrend
Crude Oil Trading Algorithm. Gen1.V5 (EPIC). Downtrend channel oil scenario. Oct 2 509 AM FX $USOIL $WTI $USO $CL_F #Crude #Oil #Algorithm #OOTT

Crude Oil Trading Algorithm. Gen1.V5 (EPIC). Uptrend channel oil scenario. Oct 2 508 AM FX $USOIL $WTI $USO $CL_F #Crude #Oil #Algorithm #OOTT

crude, oil, algorithm, up trend
Crude Oil Trading Algorithm. Gen1.V5 (EPIC). Uptrend channel oil scenario. Oct 2 508 AM FX $USOIL $WTI $USO $CL_F #Crude #Oil #Algorithm #OOTT

Generation 2 Model Oil Trading Signals.

October 2 – Generation 2 model is currently in back-testing and will be released to members when available. Below are a few versions of late.

Per recent;

Crude Oil Trading Algorithm. Gen2.V2 (EPIC). Machine trading intra-day. Sept 17 552 AM FX $USOIL $WTI $USO $UWT $DWT $CL_F #Crude #Oil #Algorithm #OOTT

This is an alternate machine trading model currently in development.

https://www.tradingview.com/chart/USOIL/KZPGrSny-Crude-Oil-Trading-Algorithm-Gen2-V2-EPIC-Machine-trading-int/

Crude, oil, machine, trading, algorithm
Crude Oil Trading Algorithm. Gen2.V2 (EPIC). Machine trading intra-day. Sept 17 552 AM FX $USOIL $WTI $USO $UWT $DWT $CL_F #Crude #Oil #Algorithm #OOTT

Per previous;

Crude Oil Trading Algorithm. Gen2.V1 (EPIC). Machine trading intra-day. Sept 11 1246 AM FX $USOIL $WTI $USO $UWT $DWT $CL_F #Crude #Oil #Algorithm #OOTT

https://www.tradingview.com/chart/USOIL/zBBnd8C8-Crude-Oil-Trading-Algorithm-Gen2-V1-EPIC-Machine-trading-int/

Crude, oil, algorithm, machine, trading
Crude Oil Trading Algorithm. Gen2.V1 (EPIC). Machine trading intra-day. Sept 11 1246 AM FX $USOIL $WTI $USO $UWT $DWT $CL_F #Crude #Oil #Algorithm #OOTT

Generation 1 Day-trading Crude Oil 1 Minute Chart Signals

Oct 2 – Currently in updating by technician, will be added to Discord room when available.

During a squeeze trade spikes upward through the highlighted area and then rests and works its way through the next area and spikes through the next highlighted area. This does not occur in regular trade. More on this chart in our special reporting for oil trading over the coming days.

Per recent;

7:58 AM update Sept 17:

Crude Oil Day-Trading Chart Signals. 1 minute time frame. Sept 17 723 AM FX $USOIL $WTI $USO $UWT $DWT $CL_F #OIL #Chart

https://www.tradingview.com/chart/USOIL/dn38QRqh-Crude-Oil-Day-Trading-Chart-Signals-1-minute-time-frame-Sept-1/

Crude, oil, chart, 1 min
Crude Oil Day-Trading Chart Signals. 1 minute time frame. Sept 17 723 AM FX $USOIL $WTI $USO $UWT $DWT $CL_F #OIL #Chart

Crude Oil Swing Trade Charting.

Monthly Oil Chart:

Crude Oil Monthly Chart testing 100 MA resistance. Oct 2 517 AM FX $USOIL $WTI $USO $CL_F #OIL #chart

https://www.tradingview.com/chart/USOIL/RbQoU7kO-Crude-Oil-Monthly-Chart-testing-100-MA-resistance-Oct-2-517-AM/

Crude, oil, monthly, chart
Crude Oil Monthly Chart testing 100 MA resistance. Oct 2 517 AM FX $USOIL $WTI $USO $CL_F #OIL #chart

Weekly Crude Oil Chart:

Crude Oil Weekly Chart Wedge. Testing resistance points on chart intra-day. Oct 2 521 AM FX $USOIL $WTI $USO $CL_F 

https://www.tradingview.com/chart/USOIL/ZleXvNiq-Crude-Oil-Weekly-Chart-Wedge-Testing-resistance-points-on-chart/

Crude, oil, weekly, chart
Crude Oil Weekly Chart Wedge. Testing resistance points on chart intra-day. Oct 2 521 AM FX $USOIL $WTI $USO $CL_F #oiltradealerts

Per previous for reference;

1 of … Crude Oil Weekly Chart Wedge. Very bullish oil trading signal here, lower trend line held w break to upside. Sept 24 1204 AM

https://www.tradingview.com/chart/USOIL/H3tBaTZ3-1-of-Crude-Oil-Weekly-Chart-Wedge-Very-bullish-oil-trading/

crude, oil, trade, alerts, signals
1 of … Crude Oil Weekly Chart Wedge. Very bullish oil trading signal here, lower trendline held w break to upside. Sept 24 1204 AM FX $USOIL $WTI $USO $CL_F #oiltradealerts

2 of … Crude Oil Weekly. Over 71.76 suggests 74.20 – 79.00 in to Oct 22. Sept 24 1209 AM

crude oil, trade, alerts, price, targets
2 of … Crude Oil Weekly. Over 71.76 suggests 74.20 – 79.00 in to Oct 22. Sept 24 1209 AM FX $USOIL $WTI $USO $CL_F #oiltradealerts

3 of … Crude Oil Weekly. Resistance 71.76, 74.20, 78.17, 79.00, 79.34 ish. Sept 24 1211 AM

crude. oil, trade, alerts, resistance
3 of … Crude Oil Weekly. Resistance 71.76, 74.20, 78.17, 79.00, 79.34 ish. Sept 24 1211 AM FX $USOIL $WTI $USO $CL_F #oiltradealerts

4 of 4 … Crude Oil Weekly. If it fails for some reason, it targets 68.58 – 69.21 Oct 22. Sept 24 1215 AM

Crude, oil. trading, chart, downside, targets
4 of 4 … Crude Oil Weekly. If it fails for some reason, it targets 68.58 – 69.21 Oct 22. Sept 24 1215 AM FX $USOIL $WTI $USO $CL_F #oiltradealerts

Daily Oil Chart:

Crude Oil Daily Chart, MACD trend up with price above all MA’s Oct 2 548 AM FX $USOIL $WTI $USO $CL_F #OIL #chart

https://www.tradingview.com/chart/USOIL/loYQ4WwL-Crude-Oil-Daily-Chart-MACD-trend-up-with-price-above-all-MA-s-O/

crude, oil, daily, chart
Crude Oil Daily Chart, MACD trend up with price above all MA’s Oct 2 548 AM FX $USOIL $WTI $USO $CL_F #OIL #chart

Crude Oil Daily basic algorithmic chart model. Oct 2 536 AM FX $USOIL $WTI $USO $CL_F #OIL #chart #algorithm

https://www.tradingview.com/chart/USOIL/ge5PHprn-Crude-Oil-Daily-Chart-baisc-algorithm-model-Oct-2-536-AM-FX-US/

crude, oil, algorithm, chart
Crude Oil Daily Chart baisc algorithm model. Oct 2 536 AM FX $USOIL $WTI $USO $CL_F #OIL #chart #algorithm

Crude Oil Daily Chart. For symmetry to remain intact 67.18 Sept 28 would have to hit. Can’t imagine how. Sept 24 1229 AM

https://www.tradingview.com/chart/USOIL/477BtvRa-Crude-Oil-Daily-Chart-For-symmetry-to-remain-intact-67-18-Sept/

Crude, oil, symmetry, chart
Crude Oil Daily Chart. For symmetry to remain intact 67.18 Sept 28 would have to hit. Can’t imagine how. Sept 24 1229 AM FX $USOIL $WTI $USO $CL_F #OIL #chart

Diagonal Trend Lines:

Diagonal trend-lines are critical inflection points (currently represented in red below on our conventional charting).

Please review many of my recent posts so you can learn about how important these diagonal trend-lines are. If one is breached you can look to pull-back to next diagonal trend line about 90% of the time. Also pay attention to how thick the lines are – the thicker the line the more important because they represent extensions from previous time / price cycles.

Remember you can come in to the chat room to message the trader and REMEMBER I have posted a live chart link in this post so if you can’t see the lines well on this chart above you can go to the live chart link and watch for member live algo chart links through-out the day in your email inbox!

The diagonal trend-lines are marked on chart below:

Sept 17: Previous remains signal;

Oil Chart (Weekly). Oil trend lines on weekly time-frame. Aug 12 951 PM FX $USOIL $WTI $USO $UWT $DWT $CL_F #OIL

Significant probability oil hits 79.50 ish Dec 3, 2018 ish. But over that area unlikely unless there is a geo political event. Over 79.50 the shorts would get wrecked. Low 50s most probable by 2022. Early Dec 2018 is likely the highs. $USOIL $WTI $CL_F $USO #OOTT

https://www.tradingview.com/chart/USOIL/ouLad9xj-Crude-oil-weekly-trendline-chart-suggests-79-50-area-Dec-3-2018/

oil, trend lines, chart
Oil Chart (Weekly). Oil trend lines on weekly time-frame. Aug 12 951 PM FX $USOIL $WTI $USO $UWT $DWT $CL_F #OIL

Oil Chart (Weekly). Oil trend lines on weekly time-frame. Aug 7 605 AM FX $USOIL $WTI $USO $UWT $DWT $CL_F #OIL

https://www.tradingview.com/chart/USOIL/bS8T4ism-Oil-Chart-Weekly-Oil-trend-lines-on-weekly-time-frame-Aug-7/

Oil, trend line, chart
Oil Chart (Weekly). Oil trend lines on weekly time-frame. Aug 7 605 AM FX $USOIL $WTI $USO $UWT $DWT $CL_F #OIL

Previous posts for perspective;

Oil has now cleared every trendline resistance provided on conventional charting I’ve posted last year. $USOIL $WTI $CL_F #OOTT #OIL $USO $UWT $DWT 233 PM Jan 1

Oil, trendline, resistance, chart
Oil has now cleared every trendline resistance provided on conventional charting I’ve posted last year. $USOIL $WTI $CL_F #OOTT #OIL $USO $UWT $DWT 233 PM Jan 1
$USOIL, $WTI, Chart, Trendlines
Simple lines show expose clusters of resistance. Crude algo intra work sheet 201 AM Apr 10 FX $USOIL $WTIC #OIL $CL_F CL $USO $UCO $SCO $UWT $DWT #OOTT

Notice when the daily chart is opened, the simple lines extend to current day trade.

Daily chart view. Simple lines show expose clusters of resistance. Crude algo intra work sheet 213 AM Apr 10 FX $USOIL $WTIC #OIL $CL_F CL $USO $UCO $SCO $UWT $DWT #OOTT

Daily, $USOIL $WTI, Chart, Trendlines
Daily chart view. Simple lines show expose clusters of resistance. Crude algo intra work sheet 213 AM Apr 10 FX $USOIL $WTIC #OIL $CL_F CL $USO $UCO $SCO $UWT $DWT #OOTT

Fibonacci Levels:

Watch the lines for support and resistance. Careful using them as traditional retracement levels with crude because the algo lines etc are more dominant / predictable. But the Fib lines are excellent indicators for intra-day trade support and resistance.

The Fibonacci lines are marked on main chart above.

Horizontal Trend-Lines (purple):

Horizontal trend-lines are not as important as the other indicators reviewed above, however, they do serve as important resistance and support intra-day for tight trading and they are important if thick (in other words they come from previous time / price cycles). WE STARTED TO REPRESENT THE REALLY IMPORTANT LINES IN YELLOW FYI FOR EASE. Refer to chart for current applicable horizontal trend-lines.

Horizontal trend-lines are marked on charts above.

Oil Time / Price Cycles:

Watch your email and / or my Twitter feed for time price cycles they may start to terminate.

Time / price cycles are the single most important indicator and my record calling them is near 100% – since inception seven months ago. The reason they are so important is that a trader does not want to be holding a crude oil instrument at termination of a time cycle if not absolutely sure if price will go up or down. A trade may choose to enter a large position in advance of a time price cycle termination IF THERE IS A HIGH PROBABILITY OF A DIRECTION IN PRICE and if the market is trading at a really important pivot area. In other words, if the market is trading at the bottom of the upward trending channel at a support (yellow lines) and we knew there was a significant probability of a time cycle about to terminate a trader may enter with a long position. The price really spikes or drops significantly when these important time cycles terminate.

The problem with time / price cycle terminations is they change from minute to minute (depending on where price is on the chart) so you have to be in the trade room to get the alert. Our lead traders will do everything they can in future to send these on SMS but we have to be careful because it can be difficult with so much going on in the room. The reason they (time cycles) change is because they are actually represented by or are geometric shapes in the chart – I know it sounds odd but I have (as I mentioned) hit these calls just shy of 100%. The oil political people know the same algorithmic modeling principles and they ALWAYS TIME THEIR BIG ANNOUNCEMENTS AROUND THE TIME PRICE CYCLE TERMINATIONS.

So if you can picture a triangle on the chart – and price is trading in the triangle – and price is going to come to the edge of the triangle and there is a significant support or resistance or an algo line terminating there too or a target (those type of indications)… then we know there is a high probability of a time and price change. In other words, it is where there are clusters of algorithm points that cross and when price is going to cross over that cluster is where they are. And these are represented on all the different time frames – the larger the time frame – the larger the time price cycle termination – the larger the spike or downdraft. This is where we establish our intra-day quadrants from for sniping trades (which we will put in to the room soon because it looks like the geo political rhetoric is over for a while making them more predictable). Difficult to explain in short. So we will do our best to SMS alert these in future.

Also, the real large or important time / price cycle terminations we know far in advance and they can be put in these newsletters.

If you review my Epic the Oil Algo Twitter feed, my blog posts and my story on our website you will get a feel for how accurate these calls are.

Alpha Algo Trading Trend-Lines (Primary – Red dotted lines. Secondary – White dotted lines):

To determine which algo line is most alpha (or probable) intra day, it is the nearest line to price action. This can also help you determine the trend of trade. If the algo line is trending up the price will follow it up until price is tested at an algorithm indicator (the main tests are diagonal trendlines, horizontal trendlines, time / price cycles etc – as I have shared with you). This is why it is important to watch all the lines because they are all support and resistance. To keep it simple trade the range (yellow lines) as I’ve mentioned but keep an eye on these indicators.

Current Alpha Algo Targets (Red circles):

Your closest target that crude is trending toward is always the most probable.Then, your second most probable is the one that is up or down trend depending on whether general price is in an upward or downtrend for the most recent week or so and what your other indicators look like (such as the MA’s I explained above).

The other way to determine which targets are in play is actually quite simple, you will notice that crude trades between the channel lines up and down and up and down and there are various support and resistance along the way. If it hits a target at the top of the channel you can bet most times (unless the next day like today) that the next target hit will be at the bottom of the channel.

Wait for the price to trend toward a target and take your position and watch as price gets closer and closer to the target. Remember, that the machines trade from decision to decision – or in other words from support to next resistance or resistance to next support or when the times come each week on Tuesday Wednesday and Friday they will trend toward the target that market price action determines they go to.

Our lead trader will explain more in the room and do not hesitate to ask our lead trader in the room by private message or on twitter to explain intra day decisions.

Recent Live Crude Oil Trade Alerts (sample signals):

Oct 2 – Recent trade alerts will be updated soon.

Aug 12 2018 – Recent trades are found in this recent report:

Crude Oil Trading Face-Off Results “Pro Trader” (Man) vs. EPIC Oil Algorithm (Machine Trading Tech)

Click on feature post for recent crude oil trading alerts blog post; Oil Trading Alerts Live Video w EPIC Oil Algorithm #EIA Report #Oil #Trading #Algorithm #Alerts $USOIL $WTI $CL_F

Recent Oil Algorithm Price Target Hits:

Oct 2 – Price Target Reporting will be updated soon.

Wed 1030 EIA report lower price target a perfect hit published on weekend report. Oil Algorithm (EPIC). FX $USOIL $WTI $USO $UWT $DWT $CL_F #OIL #Algorithm #OOTT

https://twitter.com/EPICtheAlgo/status/1024665109338222592

Oil Intra-Day Algo Trading Quadrants (white dotted lines):

Trading quadrants are simply support and resistance lines that can assist your intra-day trading – they are not alpha or primary support and resistance by any measure. Price action does however typically move more assertively when leaving a trading quadrant.

Indicator Methods:

As explained above, my algorithm is a consideration of up to fifty traditional indicators at any one time – each one given its own weight in accordance to its accuracy (win rate). This is how we establish the probability of specific targets hitting (we call them alpha algo targets).

Alpha Algo Targets, Algo Trend-lines, Algo Timing, Quadrants for Intra Snipes

Algo targets are the red circles – they correspond with important times each week in oil reporting land. Tuesday 4:30 PM, Wednesday 10:30 AM and Friday at 1:00 PM. The red dotted diagonal lines are the algo trend-lines. And the vertical dotted (red or green) are marking the important times each week. You will find that the price of crude will hit one of the alpha algo targets about 90% of the time. In the absence of market direction the machines take price to the next algo line and/or target. Understanding how the price of crude reacts to the algos and how they move price from target to target is critical for intra-day and swing trading crude oil and associated instruments.

You will notice that price action of crude will use these algo trend-lines and act as support and resistance, and that price also often violently moves when an alpha algo line is breached either upward or downward.

We cover this in much more detail in the member updates, trading room. A review of my Twitter feed and previous blog posts will help you understand the relation of these indicators. We will start posting video blogs (for my subscribers) on YouTube (in addition to my daily blog posts) for swing traders that work during regular trading hours.

Also… we will cover how to establish algo trend-lines and price targets future forward (as you have seen me do on my Twitter feed for some time now).

Conclusion:

See you in the live trade room! And again, if you struggle to know how to use these indicators as a trader’s edge, it is recommended (if you have earnestly reviewed all of our documentation first) that you obtain private coaching prior to trading a real account with real money – we recommend you use a paper trading account at first.

You can also send specific questions to our email inbox at [email protected] – if you do this be sure to ask a specific question so it can be answered specifically. When the 24 hour oil trading room opens you will have ample opportunity in that 24 hour room to ask questions also.

Watch my EPIC the Oil Algo Twitter feed for intra day notices and your email in box for member only material intra day also.

EPIC the Oil Algo

Subscribe to Service Here:

Standalone Crude Oil Algorithm Newsletter (member charting sent out weekly).

Real-Time Crude Oil Trading Alerts (Private Twitter feed).

Crude Oil Trading Room Bundle (includes weekly newsletter charting and real-time trading alerts on Twitter).

Commercial / Institutional Multi User License (for professional trading groups).

One-on-One Trade Coaching (Via Skype or in person).

Connect:

Register to free email list for trade set-ups, webinars, special events: https://compoundtrading.com/contact/

Website: https://compoundtrading.com

Blog: https://compoundtrading.com/blog/

Free chat room: https://discord.gg/2HRTk6n

Subscribe: https://compoundtrading.com/overview-…

Twitter: https://twitter.com/CompoundTrading

Lead Trader: https://twitter.com/curtmelonopoly

Tradingview: https://www.tradingview.com/u/curtmel…

Facebook: https://www.facebook.com/compoundtrad…

StockTwits: https://stocktwits.com/compoundtrading

Email: https://[email protected]

Curtis Melonopoly (@curtmelonopoly) is rated Top 250 Stock exchanges authority, covering also Mathematical finance and Economy of the United States

Tweets by EPICtheAlgo


Article topics: EPIC, Crude, Oil, Algorithm, Trade, Alerts, Trading Room, Chat, Charts, Signals, $USOIL, $WTI, $USO, $CL_F

Read More
Crude Oil Algorithm Trading Report (EPIC) w/ Gen 2 Machine Trade Mon Sept 24 FX: $USOIL $WTI $CL_F $USO #Oil #Trading #Algorithm

Crude Oil Algorithm Trading Report (EPIC) w/ Gen 2 Machine Trade Mon Sept 24 FX: $USOIL $WTI $CL_F $USO #Oil #Trading #Algorithm

September 24, 2018February 5, 2019 Epic the AlgoCrude Oil Trading Algorithm (EPIC)$CL_F, $USO, $USOIL, $WTI, Alerts, Algorithm, Charts, chat, Crude, EPIC, Oil, Signals, Trade, Trading Room

Crude Oil Trading Algorithm Chart Report (EPIC) Monday September 24, 2018.

FX: $USOIL $WTI $USO $CL_F $UWT $DWT $UCO $SCO $ERX $ERY $GUSH $DRIP

Welcome to the oil trading algorithm report. My name is EPIC the Oil Algorithm and I am one of seven primary Algorithmic Chart Models in development at Compound Trading Group (there are over one hundred in total in development at various stages in various markets).

NOTICES:

New members to our oil algorithm charting models, oil trade alerts and oil trading room are encouraged to on-board in a way that equips you as an oil trader for consistent profit.

Visit my public Twitter feed EPIC Oil Algorithm Twitter (@EPICtheAlgo) and review tweets over the last few months, visit our blog and review the recent crude oil trading algorithm blog posts, our You Tube channel “how my oil algorithm works”, “how to use my charting”, weekly EIA oil report videos and our website explains how the oil algorithm was developed.

Invaluable are the crude oil trade alerts (available with or without the trading room / weekly report bundle) and the private member crude oil trading chat room on Discord (included in the bundle). The live alerts are important if you are not at your trading screens 24 hours a day and the chat room allows for interactive lead trader oil trade set-ups as each oil trade approaches.

Reviewing important points of reference and engaging the subscription resources will increase your probability of success considerably. This report also includes links to some recent example “how-to” videos.

Oil Trade Coaching – We strongly suggest users of this algorithmic crude oil trading strategy opt for some level of private one-on-one coaching with our lead trader. Our lead trader is currently maintaining a crude oil trading alert win-rate of over 90% (as of Sept 2, 2018 – time-stamped, live alert, recorded).

On our website one-on-one online coaching packages are made available (coaching via Skype) or you can request a custom package reflecting the time you wish to invest in learning. To request a custom package suited to your needs email [email protected] or click here for standard private trade coaching packages. Other options for coaching include online webinars, trade coaching bootcamps and private on location (in person) coaching sessions. 

Oil Trading Room – How to Use the Oil Algorithm

Oil Trading Room – How to Trade Intra-day with my Algorithmic Oil Charting

Oil Trading Alerts. Live Lead Trader Video Trading w EPIC Oil Algorithm

Recent articles from our blog about how to trade crude oil with our oil trading algorithm:

Oil Trade Alerts: How We Knew Where Oil Sell-Off Bottom Was in Advance. Crude Oil Trading Strategy.

Crude Oil Trading Face-Off Results “Pro Trader” (Man) vs. EPIC Oil Algorithm (Machine Trading Tech).

Oil Trading Alerts Live Video w EPIC Oil Algorithm #EIA Report.

“The Nut Hand” Today’s Huge Oil Trade Win. Exactly How It Was Done. How I Knew & How You Can Too.

CRITICAL Oil Trade. Weekly Timing. EPIC Oil Algorithm Channel $USOIL $WTI $CL_F $USO. 

MULTI-USERS: Institutional / commercial platform now available.

SOFTWARE: My algorithmic charting is now also in the coding phase for our trader’s dashboard program. Please review my algorithm development process, about my oil algorithm story on our website www.compoundtrading.com and my oil algo charting posts on my Twitter feed and/or this blog.

HOW MY ALGORITHM WORKS: I am an oil algorithm model in development. My math is based on traditional indicators (up to fifty at any given time each weighted on win ratio merit – all not shown on chart at any given time) – such as simple math calculations relating to price and volume, Fibonacci, simple pivots, moving averages, Gann, Schiff and various other charting, geometric and mathematical factors. I do not yet have AI integration – only math as it relates to traditional indicators with the primary goal being probabilities. I am not a high frequency robot type algorithm – I am presented on (and used on) a traditional trading chart as one would normally use as a probability indicator.

The goal is to provide oil traders with a signals edge when triggering entries and exits on trades with instruments that rely on the price of crude oil – first with the reporting format as below, then with machine trading functions and an integrated intelligent assisted traders platform that will provide the user with various settings of automation and personal trade execution.

In the weekly report below you will find simplified levels represented on conventional and algorithmic charting for intra-day (day-trading crude oil), swing trading and investing. You will also find below introduction of our Generation 2 machine trading models.

This work (and associated trading) should be considered one decision at a time, “if this happens then this or this are my targets”… price – trigger – trade and so on.oil related financial instruments.

Forward questions to [email protected], private message our lead trader on Twitter or in the private Discord oil trading room.

For further information this link explains how our algorithmic charting is done, this YouTube video explains in summary how my algorithm works https://www.youtube.com/watch?v=LUNyxFoXJp8 this link for more information about our algorithmic stock charting models and what makes them different than most.

EVERY CALL WE MAKE, EVERY PUBLIC INTERACTION, REPRESENTATION OF TRADE SIGNAL (ON EVERY VENUE) IS VIDEO RECORDED, ON SOCIAL MEDIA OR ON BLOG / WEBSITE TIME-STAMPED FOR PERMANENT RECORD AND TRANSPARENCY. PLEASE ALSO REFER TO OUR PUBLIC DISCLOSURE https://compoundtrading.com/disclosure-disclaimer/.

Oil Algorithm Observations:

Below is a link for the live algorithmic chart of EPIC the Crude Oil Trading Algorithm (Generation 1, Version 5 including black box modeling). The charting is a real-time trading chart represented on FX $USOIL $WTI published Sept 23, 2018.

A Generation 1, Version 6 model (with and without machine trading chart overlays) is currently also available. Per member request we will continue to post both Gen 1 and Gen 2 models (we had previously planned to discontinue including Gen 1 in weekly reporting).

Click on share button (bottom right beside flag) and when that screen opens click on “make it mine” to view real-time, make edits etc:

Crude Oil Trading Algorithm. Gen1.V5 (EPIC). Current crude oil trade. Sept 23 1113 PM

https://www.tradingview.com/chart/USOIL/sTbDIv7F-Crude-Oil-Trading-Algorithm-Gen1-V5-EPIC-Current-crude-oil-t/

crude, oil, trading, algorithm, current trade
Crude Oil Trading Algorithm. Gen1.V5 (EPIC). Current crude oil trade. Sept 23 1113 PM FX $USOIL $WTI $USO $UWT $DWT $CL_F #Crude #Oil #Algorithm #OOTT

Sept 24, 2018

Generation 1 Model Oil Trading Signals

The first most predictable trade are the resistance and support cluster areas formed by long term chart trend lines (see charts that have trend-lines represented in red as made available below near bottom of this report – conventional charting trend-lines).

The second most predictable trade (wide trading range primary resistance and support that become predictable buy and sell triggers). Current algorithmic model wide trading range resistance (grey arrow – grey horizontal line) at approximately 72.54 in the current trading range. Current algorithmic model wide trading range support (grey arrow – grey horizontal line) at approximately 68.93 in the current trading range – these areas are general range support and resistance areas (our algorithm uses a .15 – .20 cent buffer on either side for these trades – if that is exceeded then trading price is likely to use the line as a pivot until a directional trending trade is established).

Trading between the resistance / support horizontal grey lines is extremely profitable risk – reward if one is disciplined to the patience required and follows the trend of trade.

More recently (as of September 2018) our back-testing has shown that the support and resistance areas noted are used in trade as a decision pivot – in other words, the price tends to pivot around these decision points on the chart and coil over a period of time and then spring out of the coil in an upward or downward trend.

The lower trading range is 65.32 – 68.92 and upper trading range 72.55 to 76.15.

Third most predictable trade (support and resistance of uptrend or down trend channels). On the chart an upward trending trade channel is presented and a downward option (channel support and resistance / trading range is represented as diagonal dotted orange lines and purple arrows – as made available, assist in displaying directional trade decision areas).

Fourth most predictable trade (support and resistance of 30 min quadrants). The diagonal lines make up quadrants (in this instance on a 30 min chart) and are represented as orange diagonal lines that make up geometric diamond shapes. These lines also assist in intra-day trade.

Fifth most predictable trade (support and resistance of most applicable Fibonacci) the Fib support and resistance lines are the horizontal lines in various colors with the exception of purple and yellow (see below). These horizontal lines become support and resistance for intra-day trade.

Sixth most predictable trade (support and resistance of historical support and resistance) Natural / historical support and resistance lines shown in purple or yellow – they represent historical support and resistance. The strongest of the historical support and resistance lines are shown in yellow horizontal and are typically accompanied by a yellow arrow marker.

Seventh most predictable trade signal we use are the time and price targets (red circles). When trade is in a significant uptrend or downtrend the targets become very precise and move up the indicator priority list quick.

Tues, Wed and Fri targets are most predictable in extended multi week uptrends or downtrends. In recent time, trade could be described as range-bound.

The Eighth most predictable trade is intra-day. You will notice on some of the charting geometric shapes in green on some of my charting (at times). They are charted live in the trading room and at times the lead trader will highlight these areas intra with white outlines (typically geometric shapes such as diamonds or triangles).

Intra-day Trading Bias

Intra day bias is up as the MACD is turned up on the daily chart and this indicator is usually a leading indicator for oil trade on this time-frame.

Wide Trading Range – Buy and Sell Triggers for Swing Trading Crude Oil:

Swing trading bias / forward guidance as of Sept 24, 2018 1:16 AM EST for the near term (two week swing trade) is bullish in uptrending channels as trade bounced off range support on up-trending wedge charting. 

Trade the ranges noted above between the thick grey lines (grey arrows) for the most predictable swing trades between 58.13 to 61.72, 61.72 to 65.32, 65.32 to 68.92, 68.93 to 72.54 and 72.55 to 76.15. This is a highly profitable risk-reward way to trade oil if you can be patient to trigger at only the break of the wide range charting areas and are disciplined to cut a losing trade that does not prove in your anticipated trend.

Or trade the range between the channel diagonal lines at support and resistance in up or down channel (orange dotted diagonals).

Significantly more advanced trading rules will be introduced over the coming weeks with the newer Generation 2 models per below in this report.

Also, the recent trade coaching boot camp provided for excellent trading on the Friday in oil and also many other charting set-ups.

Crude Oil Trading Algorithm. Gen1.V5 (EPIC). Uptrend channel oil scenario. Sept 23 1145 PM

crude, oil, algorithm, uptrend, channel
Crude Oil Trading Algorithm. Gen1.V5 (EPIC). Uptrend channel oil scenario. Sept 23 1145 PM FX $USOIL $WTI $USO $UWT $DWT $CL_F #Crude #Oil #Algorithm #OOTT

Crude Oil Trading Algorithm. Gen1.V5 (EPIC). Down trend channel oil scenario. Sept 23 1145 PM

crude, oil, trading, algrithm
Crude Oil Trading Algorithm. Gen1.V5 (EPIC). Down trend channel oil scenario. Sept 23 1145 PM FX $USOIL $WTI $USO $UWT $DWT $CL_F #Crude #Oil #Algorithm #OOTT

Generation 2 Model Oil Trading Signals.

Sept 24 – Generation 2 model is currently in back-testing and will be released to members when available.

Per recent;

Crude Oil Trading Algorithm. Gen2.V2 (EPIC). Machine trading intra-day. Sept 17 552 AM FX $USOIL $WTI $USO $UWT $DWT $CL_F #Crude #Oil #Algorithm #OOTT

This is an alternate machine trading model currently in development.

https://www.tradingview.com/chart/USOIL/KZPGrSny-Crude-Oil-Trading-Algorithm-Gen2-V2-EPIC-Machine-trading-int/

Crude, oil, machine, trading, algorithm
Crude Oil Trading Algorithm. Gen2.V2 (EPIC). Machine trading intra-day. Sept 17 552 AM FX $USOIL $WTI $USO $UWT $DWT $CL_F #Crude #Oil #Algorithm #OOTT

Per previous;

Crude Oil Trading Algorithm. Gen2.V1 (EPIC). Machine trading intra-day. Sept 11 1246 AM FX $USOIL $WTI $USO $UWT $DWT $CL_F #Crude #Oil #Algorithm #OOTT

https://www.tradingview.com/chart/USOIL/zBBnd8C8-Crude-Oil-Trading-Algorithm-Gen2-V1-EPIC-Machine-trading-int/

Crude, oil, algorithm, machine, trading
Crude Oil Trading Algorithm. Gen2.V1 (EPIC). Machine trading intra-day. Sept 11 1246 AM FX $USOIL $WTI $USO $UWT $DWT $CL_F #Crude #Oil #Algorithm #OOTT

Generation 1 Day-trading Crude Oil 1 Minute Chart Signals

Sept 24 – Currently in updating by technician, will be added to Discord room when available.

During a squeeze trade spikes upward through the highlighted area and then rests and works its way through the next area and spikes through the next highlighted area. This does not occur in regular trade. More on this chart in our special reporting for oil trading over the coming days.

Per recent;

7:58 AM update Sept 17:

Crude Oil Day-Trading Chart Signals. 1 minute time frame. Sept 17 723 AM FX $USOIL $WTI $USO $UWT $DWT $CL_F #OIL #Chart

https://www.tradingview.com/chart/USOIL/dn38QRqh-Crude-Oil-Day-Trading-Chart-Signals-1-minute-time-frame-Sept-1/

Crude, oil, chart, 1 min
Crude Oil Day-Trading Chart Signals. 1 minute time frame. Sept 17 723 AM FX $USOIL $WTI $USO $UWT $DWT $CL_F #OIL #Chart

Crude Oil Swing Trade Charting.

Monthly Oil Chart:

Crude Oil Monthly Chart. Touched 200 MA bounced, trading over pivot under 100 MA. Range intact. Sept 24 1234 AM.

https://www.tradingview.com/chart/USOIL/3A1M4Zd2-Crude-Oil-Monthly-Chart-Touched-200-MA-bounced-trading-over-pi/

crude, oil. monthly, chart
Crude Oil Monthly Chart. Touched 200 MA bounced, trading over pivot under 100 MA. Range intact. Sept 24 1234 AM FX $USOIL $WTI $USO $CL_F #OIL #chart

Weekly Crude Oil Chart:

1 of … Crude Oil Weekly Chart Wedge. Very bullish oil trading signal here, lower trend line held w break to upside. Sept 24 1204 AM

https://www.tradingview.com/chart/USOIL/H3tBaTZ3-1-of-Crude-Oil-Weekly-Chart-Wedge-Very-bullish-oil-trading/

crude, oil, trade, alerts, signals
1 of … Crude Oil Weekly Chart Wedge. Very bullish oil trading signal here, lower trendline held w break to upside. Sept 24 1204 AM FX $USOIL $WTI $USO $CL_F #oiltradealerts

2 of … Crude Oil Weekly. Over 71.76 suggests 74.20 – 79.00 in to Oct 22. Sept 24 1209 AM

crude oil, trade, alerts, price, targets
2 of … Crude Oil Weekly. Over 71.76 suggests 74.20 – 79.00 in to Oct 22. Sept 24 1209 AM FX $USOIL $WTI $USO $CL_F #oiltradealerts

3 of … Crude Oil Weekly. Resistance 71.76, 74.20, 78.17, 79.00, 79.34 ish. Sept 24 1211 AM

crude. oil, trade, alerts, resistance
3 of … Crude Oil Weekly. Resistance 71.76, 74.20, 78.17, 79.00, 79.34 ish. Sept 24 1211 AM FX $USOIL $WTI $USO $CL_F #oiltradealerts

4 of 4 … Crude Oil Weekly. If it fails for some reason, it targets 68.58 – 69.21 Oct 22. Sept 24 1215 AM

Crude, oil. trading, chart, downside, targets
4 of 4 … Crude Oil Weekly. If it fails for some reason, it targets 68.58 – 69.21 Oct 22. Sept 24 1215 AM FX $USOIL $WTI $USO $CL_F #oiltradealerts

Daily Oil Chart:

Crude Oil Daily Chart, MACD re-confirms upward with price above all MA’s Sept 23 1155 PM

https://www.tradingview.com/chart/USOIL/QdCvwqh3-Crude-Oil-Daily-Chart-MACD-re-confirms-upward-with-price-above/

crude, oil, daily, chart, WTI, USOIL, USO, CL_F
Crude Oil Daily Chart, MACD re-confirms upward with price above all MA’s Sept 23 1155 PM FX $USOIL $WTI $USO $UWT $DWT $CL_F #OIL #chart

Crude Oil Daily Chart. For symmetry to remain intact 67.18 Sept 28 would have to hit. Can’t imagine how. Sept 24 1229 AM

https://www.tradingview.com/chart/USOIL/477BtvRa-Crude-Oil-Daily-Chart-For-symmetry-to-remain-intact-67-18-Sept/

Crude, oil, symmetry, chart
Crude Oil Daily Chart. For symmetry to remain intact 67.18 Sept 28 would have to hit. Can’t imagine how. Sept 24 1229 AM FX $USOIL $WTI $USO $CL_F #OIL #chart

Diagonal Trend Lines:

Diagonal trend-lines are critical inflection points (currently represented in red below on our conventional charting).

Please review many of my recent posts so you can learn about how important these diagonal trend-lines are. If one is breached you can look to pull-back to next diagonal trend line about 90% of the time. Also pay attention to how thick the lines are – the thicker the line the more important because they represent extensions from previous time / price cycles.

Remember you can come in to the chat room to message the trader and REMEMBER I have posted a live chart link in this post so if you can’t see the lines well on this chart above you can go to the live chart link and watch for member live algo chart links through-out the day in your email inbox!

The diagonal trend-lines are marked on chart below:

Sept 17: Previous remains signal;

Oil Chart (Weekly). Oil trend lines on weekly time-frame. Aug 12 951 PM FX $USOIL $WTI $USO $UWT $DWT $CL_F #OIL

Significant probability oil hits 79.50 ish Dec 3, 2018 ish. But over that area unlikely unless there is a geo political event. Over 79.50 the shorts would get wrecked. Low 50s most probable by 2022. Early Dec 2018 is likely the highs. $USOIL $WTI $CL_F $USO #OOTT

https://www.tradingview.com/chart/USOIL/ouLad9xj-Crude-oil-weekly-trendline-chart-suggests-79-50-area-Dec-3-2018/

oil, trend lines, chart
Oil Chart (Weekly). Oil trend lines on weekly time-frame. Aug 12 951 PM FX $USOIL $WTI $USO $UWT $DWT $CL_F #OIL

Oil Chart (Weekly). Oil trend lines on weekly time-frame. Aug 7 605 AM FX $USOIL $WTI $USO $UWT $DWT $CL_F #OIL

https://www.tradingview.com/chart/USOIL/bS8T4ism-Oil-Chart-Weekly-Oil-trend-lines-on-weekly-time-frame-Aug-7/

Oil, trend line, chart
Oil Chart (Weekly). Oil trend lines on weekly time-frame. Aug 7 605 AM FX $USOIL $WTI $USO $UWT $DWT $CL_F #OIL

Previous posts for perspective;

Oil has now cleared every trendline resistance provided on conventional charting I’ve posted last year. $USOIL $WTI $CL_F #OOTT #OIL $USO $UWT $DWT 233 PM Jan 1

Oil, trendline, resistance, chart
Oil has now cleared every trendline resistance provided on conventional charting I’ve posted last year. $USOIL $WTI $CL_F #OOTT #OIL $USO $UWT $DWT 233 PM Jan 1
$USOIL, $WTI, Chart, Trendlines
Simple lines show expose clusters of resistance. Crude algo intra work sheet 201 AM Apr 10 FX $USOIL $WTIC #OIL $CL_F CL $USO $UCO $SCO $UWT $DWT #OOTT

Notice when the daily chart is opened, the simple lines extend to current day trade.

Daily chart view. Simple lines show expose clusters of resistance. Crude algo intra work sheet 213 AM Apr 10 FX $USOIL $WTIC #OIL $CL_F CL $USO $UCO $SCO $UWT $DWT #OOTT

Daily, $USOIL $WTI, Chart, Trendlines
Daily chart view. Simple lines show expose clusters of resistance. Crude algo intra work sheet 213 AM Apr 10 FX $USOIL $WTIC #OIL $CL_F CL $USO $UCO $SCO $UWT $DWT #OOTT

Fibonacci Levels:

Watch the lines for support and resistance. Careful using them as traditional retracement levels with crude because the algo lines etc are more dominant / predictable. But the Fib lines are excellent indicators for intra-day trade support and resistance.

The Fibonacci lines are marked on main chart above.

Horizontal Trend-Lines (purple):

Horizontal trend-lines are not as important as the other indicators reviewed above, however, they do serve as important resistance and support intra-day for tight trading and they are important if thick (in other words they come from previous time / price cycles). WE STARTED TO REPRESENT THE REALLY IMPORTANT LINES IN YELLOW FYI FOR EASE. Refer to chart for current applicable horizontal trend-lines.

Horizontal trend-lines are marked on charts above.

Oil Time / Price Cycles:

Watch your email and / or my Twitter feed for time price cycles they may start to terminate.

Time / price cycles are the single most important indicator and my record calling them is near 100% – since inception seven months ago. The reason they are so important is that a trader does not want to be holding a crude oil instrument at termination of a time cycle if not absolutely sure if price will go up or down. A trade may choose to enter a large position in advance of a time price cycle termination IF THERE IS A HIGH PROBABILITY OF A DIRECTION IN PRICE and if the market is trading at a really important pivot area. In other words, if the market is trading at the bottom of the upward trending channel at a support (yellow lines) and we knew there was a significant probability of a time cycle about to terminate a trader may enter with a long position. The price really spikes or drops significantly when these important time cycles terminate.

The problem with time / price cycle terminations is they change from minute to minute (depending on where price is on the chart) so you have to be in the trade room to get the alert. Our lead traders will do everything they can in future to send these on SMS but we have to be careful because it can be difficult with so much going on in the room. The reason they (time cycles) change is because they are actually represented by or are geometric shapes in the chart – I know it sounds odd but I have (as I mentioned) hit these calls just shy of 100%. The oil political people know the same algorithmic modeling principles and they ALWAYS TIME THEIR BIG ANNOUNCEMENTS AROUND THE TIME PRICE CYCLE TERMINATIONS.

So if you can picture a triangle on the chart – and price is trading in the triangle – and price is going to come to the edge of the triangle and there is a significant support or resistance or an algo line terminating there too or a target (those type of indications)… then we know there is a high probability of a time and price change. In other words, it is where there are clusters of algorithm points that cross and when price is going to cross over that cluster is where they are. And these are represented on all the different time frames – the larger the time frame – the larger the time price cycle termination – the larger the spike or downdraft. This is where we establish our intra-day quadrants from for sniping trades (which we will put in to the room soon because it looks like the geo political rhetoric is over for a while making them more predictable). Difficult to explain in short. So we will do our best to SMS alert these in future.

Also, the real large or important time / price cycle terminations we know far in advance and they can be put in these newsletters.

If you review my Epic the Oil Algo Twitter feed, my blog posts and my story on our website you will get a feel for how accurate these calls are.

Alpha Algo Trading Trend-Lines (Primary – Red dotted lines. Secondary – White dotted lines):

To determine which algo line is most alpha (or probable) intra day, it is the nearest line to price action. This can also help you determine the trend of trade. If the algo line is trending up the price will follow it up until price is tested at an algorithm indicator (the main tests are diagonal trendlines, horizontal trendlines, time / price cycles etc – as I have shared with you). This is why it is important to watch all the lines because they are all support and resistance. To keep it simple trade the range (yellow lines) as I’ve mentioned but keep an eye on these indicators.

Current Alpha Algo Targets (Red circles):

Your closest target that crude is trending toward is always the most probable.Then, your second most probable is the one that is up or down trend depending on whether general price is in an upward or downtrend for the most recent week or so and what your other indicators look like (such as the MA’s I explained above).

The other way to determine which targets are in play is actually quite simple, you will notice that crude trades between the channel lines up and down and up and down and there are various support and resistance along the way. If it hits a target at the top of the channel you can bet most times (unless the next day like today) that the next target hit will be at the bottom of the channel.

Wait for the price to trend toward a target and take your position and watch as price gets closer and closer to the target. Remember, that the machines trade from decision to decision – or in other words from support to next resistance or resistance to next support or when the times come each week on Tuesday Wednesday and Friday they will trend toward the target that market price action determines they go to.

Our lead trader will explain more in the room and do not hesitate to ask our lead trader in the room by private message or on twitter to explain intra day decisions.

Recent Live Crude Oil Trade Alerts (sample signals):

Sept 23 – Recent trade alerts will be updated soon.

Aug 12 2018 – Recent trades are found in this recent report:

Crude Oil Trading Face-Off Results “Pro Trader” (Man) vs. EPIC Oil Algorithm (Machine Trading Tech)

Click on feature post for recent crude oil trading alerts blog post; Oil Trading Alerts Live Video w EPIC Oil Algorithm #EIA Report #Oil #Trading #Algorithm #Alerts $USOIL $WTI $CL_F

Oil trade alert to start the week 68.61 long, 68.85 closed. Win rate high 90% – ask for a tour. Time stamped, recorded, live alerts. 

https://twitter.com/EPICtheAlgo/status/1026287786113081344

Oil trade alert to start the week 68.61 long, 68.85 closed. 

oil, trading, alert
Oil trade alert to start the week 68.61 long, 68.85 closed. EPIC Oil Algorithm $USOIL $WTI $CL_F #OilTradeAlerts $UWT $DWT

Oil trade alert to start the week 68.61 long, 68.85 closed (Part 2). 

Crude, oil, trade alert, PT2
Oil trade alert to start the week 68.61 long, 68.85 closed (Part 2). EPIC Oil Algorithm $USOIL $WTI $CL_F #OilTradeAlerts $UWT $DWT

Machine trading 🙂 

Machine trading 🙂 $USOIL $WTI $CL_F #OIL #Algorithmic #trading #alerts pic.twitter.com/Hja5Tbgmob

— Melonopoly (@curtmelonopoly) August 3, 2018

A scalp to start the day. Multi-month winning streak continues. Ask for a tour of the feed if you need proof. 

A scalp to start the day. Multi-month winning streak continues. Ask for a tour of the feed if you need proof. EPIC Oil Algorithm FX $USOIL $WTI #CL $USO $UWT $DWT #OOTT #Oil #trading #algorithm pic.twitter.com/JTHCMp58Cv

— Melonopoly (@curtmelonopoly) July 27, 2018

100% personal alerted oil trade win rate documented, recorded, alerted real time to feed continues for months (we did have one loss alert by a tech a few weeks back). 

100% personal alerted oil trade win rate documented, recorded, alerted real time to feed continues for months (we did have one loss alert by a tech a few weeks back). EPIC the Oil Algorithm FX $USOIL $WTI $USO $UWT $DWT #OIl #OOTT #Trading @EPICtheAlgo pic.twitter.com/pKL1iKE5T1

— Melonopoly (@curtmelonopoly) July 25, 2018

Live oil trade alert. Long 69.06 US OIL WTI 1 5th sizing EPIC Oil Algorithm.

oil, trade, alerts, WTI
Live oil trade alert. Long 69.06 US OIL WTI 1 5th sizing EPIC Oil Algorithm $USOIL $WTI #OIL #OOTT $UWT $DWT $USO

Live oil trade alert. Trim 50 percent 69.30. EPIC Oil Algorithm.

oil, trading, alerts, crude
Live oil trade alert. Trim 50 percent 69.30. EPIC Oil Algorithm $USOIL $WTI #OIL #OOTT $UWT $DWT $USO #trading #alerts

Live oil trade alert. Long 68.93 add 50 percent. EPIC Oil Algorithm. 

oil, trading, alert, long
Live oil trade alert. Long 68.93 add 50 percent. EPIC Oil Algorithm $USOIL $WTI #OIL #OOTT $UWT $DWT $USO #trading #alerts

Live oil trade alert. Trim other 50 percent 69.26 50 percent.

Live, oil, trade, alert, trim
Live oil trade alert. Trim other 50 percent 69.26 50 percent. EPIC Oil Algorithm $USOIL $WTI #OIL #OOTT $UWT $DWT $USO #trading #alerts

Overnight oil trade: short 72.79 add 72.71 cover 72.27s-72.35s. Not cleanest trade but HUGE win. 100% win rate continues (for months). Guidance detail in oil trading room (to expect heat). Live alerts, time stamped, recorded.

https://twitter.com/EPICtheAlgo/status/1015202909041102849

Overnight oil trade alert short 72.79 add 72.71 cover 72.27s to 72.35s. Not cleanest trade but HUGE win. 100% win rate continues 

Oil, trade, alert, short
Overnight oil trade short 72.79 add 72.71 cover 72.27s to 72.35s. Not cleanest trade but HUGE win. 100% win rate continues $USOIL $WTI $USO #OIL #Trading #Alerts

Member guidance in oil chat room this morning “i’ll be selling spikes in to resistance until it doesn’t work – the larger more obvious i’ll alert against downtrend upper channel orange dotted etc” 

https://twitter.com/EPICtheAlgo/status/1014943645974323204

Member guidance this morning in crude oil trading room – i’ll be selling spikes in to resistance until it doesn’t work 

Oil, chat, trading, room, guidance
Member guidance this morning i’ll be selling spikes in to resistance until it doesn’t work $USOIL $WTI $USO $UWT $DWT EPIC Oil Algorithm #oil #trading #alerts

Scalp day. 100 percent win rate for months continues. Time stamped, live oil alerted, recorded. 

https://twitter.com/EPICtheAlgo/status/1014938308961595393

100 percent win rate for months continues. Time stamped, live alerted, recorded. #oilalerts

oil, trade, alerts, winning, rate, ,best
100 percent win rate for months continues. Time stamped, live alerted, recorded. $USOIL $WTI $USO $UWT $DWT EPIC Oil Algorithm #oil #trading #alerts

Oil trading chat room member guidance and intra day daytrading charting example ‘70.02 would be the swing retrace. So the thesis is sound but you may have pain before potential drop”.

oil, trading, chat, room, guidance
70.02 would be the swing retrace. So the thesis is sound but you may have pain before potential drop.

Crude oil trading room member guidance and intra day daytrading charting example “Target is in 70.70 area so I will likely give this lots of room swing if I have to. We’ll see”.

oil, trade, alert, price, targets
Target is in 70.70 area so I will likely give this lots of room swing if I have to. We’ll see. FX $USOIL $WTI #OilTrading

Oil trade chat room member guidance and intra day daytrading charting example “Machines defending the retrace intra day”.

oil, machine, trading, WTI
Machines defending the retrace intra day FX $USOIL $WTI #OIL #Algorithm

Trims / close longs 71.39 to 71.71 crude oil trade alert. 

https://twitter.com/EPICtheAlgo/status/1011981290051129346

Long 71.21 oil trade alert with the one add. 

https://twitter.com/EPICtheAlgo/status/1011980052198719488

Today’s #EIA oil trade with Oil Algorithm (EPIC) Live alert entries (green) exits (red).

https://twitter.com/EPICtheAlgo/status/1011977209442177026

Screen shot member oil chat room first oil trade alert of day – Long 71.21 hoping we squeeze in to EIA

EIA, oil, trading, chat, room
Screen shot member oil chat room first oil trade alert of day – Long 71.21 hoping we squeeze in to EIA

One minute algorithmic on the fly chart trade came off after initial long side oil trade alert- see green arrow. 

oil, trade, alert, chart, trades
One minute algorithmic on the fly chart trade came off after initial long side oil trade alert- see green arrow. #oiltradealert #oil

Screen shot of crude oil signals alert to trim half at 71.39 place stop 71.26 on remaining half and resistance guidance. 

oil, trade, alert, trim, position
Screen shot of alert to trim half at 71.39 place stop 71.26 on remaining half and resistance guidance. #oil #trading #chat

Oil chat room screen shot of next trade signal alert to trim long at 71.52 25 percent and hold 25 percent.

oil, trading, alert, chat, room
Oil chat room screen shot of next trade alert to trim long at 71.52 25 percent and hold 25 percent.

Final crude oil trade alert signal to close final 12.5 percent at 71.74 and hold 0 percent at chart resistance.

oil, crude, oil, trading, alert
Final crude oil trade alert to close final 12.5 percent at 71.74 and hold 0 percent at chart resistance.

And then the post EIA 1030 Wed trade alert with trading signals plan price targets were posted – usually wait 2nd 5 min candle

oil, trade, alerts, EIA, report
And then the post EIA 1030 Wed trade alert with trading plan price targets were posted – usually wait 2nd 5 min candle

And then this happened, oil shot up right through the price targets from the alert.

oi, trade, alert, price, targets, reached
And then this happened, oil shot up right through the price targets from the alert.

Winning streak continues. 100% live oil trade alert win rate for many weeks now. Time stamped real time. 

https://twitter.com/EPICtheAlgo/status/1010004212950843392

EPIC Oil Algorithm trade alert wins continue for many weeks now. Time stamped real time. 

oil, trade, alerts, winning, streak
EPIC Oil Algorithm trade alert wins continue for many weeks now. Time stamped real time. FX $USOIL $WTI $CL_F $USO #OIL #OOTT #Oiltradealerts #algorithm

Boom “3rd target hit. Trade thesis complete for #EIA. Next levels to follow. 

Boom "3rd target hit. Trade thesis complete for #EIA. Next levels to follow. Oil Algorithm (EPIC). June 20 1148 AM FX $USOIL $WTI $USO $UWT $DWT $CL_F #OIL #Algorithm #OOTT " pic.twitter.com/WAl4N9n2yH

— Melonopoly (@curtmelonopoly) June 20, 2018

First 3 targets intra if long side trade alert holds. Trim in add above or on pull back and turns up.

oil, trading, plan, chart, price, targets
First 3 targets intra if long side trade alert holds. Trim in add above or on pull back and turns up. Oil Algorithm (EPIC). June 20 1046 AM FX $USOIL $WTI $USO $UWT $DWT $CL_F #OIL #Algorithm #OOTT

Trade is using our 50% retrace on daytrade coding level intra as pivot.

oil, trade, alert, member, guidance, charting
Trade is using our 50% retrace on daytrade coding level intra as pivot Oil Algorithm (EPIC). June 20 1058 AM FX $USOIL $WTI $USO $UWT $DWT $CL_F #OIL #Algorithm #OOTT

Close up of intra day trading battle.

oil, trading, plan, chart, alert
Close up of intra day trading battle #daytrading Oil Algorithm (EPIC). June 20 1105 AM FX $USOIL $WTI $USO $UWT $DWT $CL_F #OIL #Algorithm #OOTT

1st of 3 targets hit. Curt didn’t get it but coding team did.

oil, algorithm, trading, alert
1st of 3 targets hit. Curt didn’t get it but coding team did. Oil Algorithm (EPIC). June 20 1121 AM FX $USOIL $WTI $USO $UWT $DWT $CL_F #OIL #Algorithm #OOTT

Up over 1st target longs want to trim in to 2nd target level.

live, oil, trade, in progress
Up over 1st target longs want to trim in to 2nd target level. Oil Algorithm (EPIC). June 20 1141 AM FX $USOIL $WTI $USO $UWT $DWT $CL_F #OIL #Algorithm #OOTT

3rd target hit. Trade thesis complete for #EIA. Next levels to follow.

oil, trade, alerts, targets, complete
3rd target hit. Trade thesis complete for #EIA. Next levels to follow. Oil Algorithm (EPIC). June 20 1148 AM FX $USOIL $WTI $USO $UWT $DWT $CL_F #OIL #Algorithm #OOTT

Daytrading support and resistance fractals (white arrows key).

daytrade, oil, alert, guidance, chart
Daytrading support and resistance fractals (white arrows key) Oil Algorithm (EPIC). June 20 1209 PM FX $USOIL $WTI $USO $UWT $DWT $CL_F #OIL #Algorithm #OOTT

Recent Oil Algorithm Price Target Hits:

Sept 23 – Price Target Reporting will be updated soon.

Wed 1030 EIA report lower price target a perfect hit published on weekend report. Oil Algorithm (EPIC). FX $USOIL $WTI $USO $UWT $DWT $CL_F #OIL #Algorithm #OOTT

https://twitter.com/EPICtheAlgo/status/1024665109338222592

Wed 1030 EIA report lower price target a perfect hit published on weekend report.

Oil, algorithm, price, target, hit, EIA
Wed 1030 EIA report lower price target a perfect hit published on weekend report. Oil Algorithm (EPIC). FX $USOIL $WTI $USO $UWT $DWT $CL_F #OIL #Algorithm #OOTT

Tues 430 lower price target a perfect hit, as published on weekend report. Oil Algorithm (EPIC). FX $USOIL $WTI $USO $UWT $DWT $CL_F #OIL #Algorithm #OOTT

https://twitter.com/EPICtheAlgo/status/1024447086102827011

Tues 430 lower price target a perfect hit published on weekend report. Oil Algorithm (EPIC). FX $USOIL $WTI $USO $UWT $DWT $CL_F #OIL #Algorithm #OOTT

Oil, algorithm, price, target, hit
Tues 430 lower price target a perfect hit published on weekend report. Oil Algorithm (EPIC). FX $USOIL $WTI $USO $UWT $DWT $CL_F #OIL #Algorithm #OOTT

Oil Intra-Day Algo Trading Quadrants (white dotted lines):

Trading quadrants are simply support and resistance lines that can assist your intra-day trading – they are not alpha or primary support and resistance by any measure. Price action does however typically move more assertively when leaving a trading quadrant.

Indicator Methods:

As explained above, my algorithm is a consideration of up to fifty traditional indicators at any one time – each one given its own weight in accordance to its accuracy (win rate). This is how we establish the probability of specific targets hitting (we call them alpha algo targets).

Alpha Algo Targets, Algo Trend-lines, Algo Timing, Quadrants for Intra Snipes

Algo targets are the red circles – they correspond with important times each week in oil reporting land. Tuesday 4:30 PM, Wednesday 10:30 AM and Friday at 1:00 PM. The red dotted diagonal lines are the algo trend-lines. And the vertical dotted (red or green) are marking the important times each week. You will find that the price of crude will hit one of the alpha algo targets about 90% of the time. In the absence of market direction the machines take price to the next algo line and/or target. Understanding how the price of crude reacts to the algos and how they move price from target to target is critical for intra-day and swing trading crude oil and associated instruments.

You will notice that price action of crude will use these algo trend-lines and act as support and resistance, and that price also often violently moves when an alpha algo line is breached either upward or downward.

We cover this in much more detail in the member updates, trading room. A review of my Twitter feed and previous blog posts will help you understand the relation of these indicators. We will start posting video blogs (for my subscribers) on YouTube (in addition to my daily blog posts) for swing traders that work during regular trading hours.

Also… we will cover how to establish algo trend-lines and price targets future forward (as you have seen me do on my Twitter feed for some time now).

Conclusion:

See you in the live trade room! And again, if you struggle to know how to use these indicators as a trader’s edge, it is recommended (if you have earnestly reviewed all of our documentation first) that you obtain private coaching prior to trading a real account with real money – we recommend you use a paper trading account at first.

You can also send specific questions to our email inbox at [email protected] – if you do this be sure to ask a specific question so it can be answered specifically. When the 24 hour oil trading room opens you will have ample opportunity in that 24 hour room to ask questions also.

Watch my EPIC the Oil Algo Twitter feed for intra day notices and your email in box for member only material intra day also.

EPIC the Oil Algo

Subscribe to my Service here:

Standalone Crude Oil Algorithm Newsletter (member charting sent out weekly).

Real-Time Crude Oil Trading Alerts (Private Twitter feed).

Crude Oil Trading Room Bundle (includes weekly newsletter charting and real-time trading alerts on Twitter).

Commercial / Institutional Multi User License (for professional trading groups).

One-on-One Trade Coaching (Via Skype or in person).

Connect:

Register to free email list for trade set-ups, webinars, special events: https://compoundtrading.com/contact/

Website: https://compoundtrading.com

Blog: https://compoundtrading.com/blog/

Free chat room: https://discord.gg/2HRTk6n

Subscribe: https://compoundtrading.com/overview-…

Twitter: https://twitter.com/CompoundTrading

Lead Trader: https://twitter.com/curtmelonopoly

Tradingview: https://www.tradingview.com/u/curtmel…

Facebook: https://www.facebook.com/compoundtrad…

StockTwits: https://stocktwits.com/compoundtrading

Email: https://[email protected]

Curtis Melonopoly (@curtmelonopoly) is rated Top 250 Stock exchanges authority, covering also Mathematical finance and Economy of the United States

Tweets by EPICtheAlgo


Article topics: EPIC, Crude, Oil, Algorithm, Trade, Alerts, Trading Room, Chat, Charts, Signals, $USOIL, $WTI, $USO, $CL_F

Read More
Trade Alerts (w/ video): $VIX $WTI $CL_F $PROQR $CARA $BOX $BABA $SSW $SPY $FB $SENS #daytrading #swingtrading

Trade Alerts (w/ video): $VIX $WTI $CL_F $PROQR $CARA $BOX $BABA $SSW $SPY $FB $SENS #daytrading #swingtrading

September 18, 2018October 3, 2018 Curt MelonopolyTrade Alerts$BABA, $CARA, $CL_F, $FB, $FF, $GTHX, $PROQR, $SENS, $SSW, $USO, $WTI, BOX, Daytrading, DXY, SPY, Swingtrading, Trade Alerts, Trading, VIX

Trade Alerts Report and Video from Live Day Trading Room for: $VIX Volatility $WTI $CL_F Oil $PROQR $CARA $BOX $BABA $SSW $SPY $FB $SENS #daytrading #swingtrading

#TradeAlerts

Trading alerts and trading set-ups raw video from Live Trading Room mid-day review Sept 17, 2018. Some of the trade set-ups in this video are from the Trading Boot-Camp.

Tickers reviewed: $VIX $WTI $CL_F $USO $PROQR $CARA $BOX $BABA $SSW $DXY $SPY $GTHX $FB $FF $SENS and more.

I apologize for the sound interference – at times it was just awful, we’ll re hard wire the set-up again soon here and get that fixed. In tomorrow’s mid day I will hard wire that one computer to modem and you can let me know if it is any better please.

Voice broadcast does not start until 3:18 on video.

Market discovery theme on day.

Volatility $VIX – time-cycles reviewed in to Dec 24 beyond and inflections in markets, market open, futures and account return expectations over next two trading quarters or so.

Crude oil trading $WTI $CL_F $USO – review of crude oil algorithm,  machine trading model, charting, price targets for time cycles this week reviewed.

PROQR Therapeutics $PROQR – Excellent chart set-up, one of my favorite trades of late. Buy sell trading signals reviewed. Bounced at support at previous trade alert now at key resistance, trim in to resistance and over 22.70 targets 24.85 then 27.50. Watch the diagonal trend line (quad wall). Careful shorting this stock, 18.05 possible.

https://www.tradingview.com/chart/PRQR/OyRe6HUz-PROQR-THERAPEUTICS-PRQR-Bounced-at-support-range-box-now-at/

PROQR, stock chart
PROQR THERAPEUTICS (PRQR) Bounced at support range (box) now at key res, over 22.70 targets 24.85 fast then 27.55 $PRQR #swingtrading #daytrade #tradealerts

US Dollar $DXY – Review of US Dollar Algorithm charting. Lower support trend line and upper trend line, support and resistance areas to watch. Review of structure.

DXY, US Dollar, chart, currencies
US Dollar Index (DXY) Algorithm support area test 94.50, 94.04 break bounce area $DXY $UUP #USD #tradingalerts

$CARA Therapeutics – testing previous highs, testing other side of bowl and a full extension is possible here, structured chart trading signals reviewed, Target Dec 10 30s or 38.00s if it breaks out. Pull back to 16.36 support, look for a bounce there if it sells-off. 19.70 is near term support for a test long also.

https://www.tradingview.com/chart/CARA/DtYzRa8p-CARA/

CARA, stock, chart
CARA THERAPEUTICS (CARA) Testing break-out area intra-day. On watch. $CARA #tradingsetups #tradealert

BOX $BOX – previously provided upside targets, down side scenario on video 22.32 good support, 50 MA support is good, intra day in down trajectory lines, 10.36 is a downside sell-off target that is possible in a panic. Channel symmetry also reviewed.

https://www.tradingview.com/chart/BOX/drvq3hKB-BOX-INC-BOX-Box-testing-support-short-under-red-box-support/

BOX, stock, chart
BOX INC (BOX) Box testing support, short under red box support, down side targets at arrows in sell-off $BOX #Swingtrading #daytrade #tradealerts

SEASPAN $SSW – keeps hitting resistance, simple short at each, looking for a long over resistance in trajectory on video. Upside 10.18 first target, best scenario Nov 11.93 and 18.30 best best not probable.

https://www.tradingview.com/chart/SSW/68GukhqX-Seaspan-SSW-over-9-50-intra-shoud-see-lower-10s-fast-trading/

SSW, SEASPAN, daytrade, swing, trading
Seaspan (SSW) over 9.50 intra shoud see lower 10s fast, trading 9.34 intraday. $SSW #daytrade #swingtrade #tradealerts

G1 Therapeutics $GTHX – pullback in price here doesn’t surprise me, candle body is in current bullish trajectory lines on chart, review of downside supports and upside price targets. 76.00 – 80.00 (up over 69.62 is a trigger). All areas reviewed on video.

https://www.tradingview.com/chart/GTHX/9JK8kcY4-G1-THERAPEUTICS-GTHX-at-intra-day-model-support-could-bounce/

GTHX, stock, chart, trade, alert
G1 THERAPEUTICS (GTHX) at intra day model support, could bounce here targets near 70 first if so $GTHX #tradealerts

SHOPIFY $SHOP – chart pivot acting as support (red line) Oct 10 166.72 price target, holding key support, working up against a quad wall (diagonal Fib resistance), 154.35 buy side comes in at that area. Pull back support is 50 MA primary for a long side test trade.

https://www.tradingview.com/chart/SHOP/JlUsn0iZ-SHOPIFY-SHOP-is-working-the-area-between-main-pivot-red-line/

$SHOP, SHOPIFY, trade, alerts, stock, chart
SHOPIFY (SHOP) is working the area between main pivot (red line) and upper price target $SHOP #tradealerts #swingtrading

SP500 $SPY – the box test area reviewed, above box is a long and under is a short. 283.93 278.47 Sept 1 are downside targets in a sell-off. Other trade signals and price targets reviewed on video.

SP500, SPY, trade, alerts
SP500 (SPY) Chart – Came off at test area around pivot on 60 min chart, above box long below short $SPY $ES_F $SPXL $SPXS #SPY #SwingTrade #Daytrade

ALIBABA $BABA – underwater a bit on this swing trade in BABA, I’m in 1/10 sizing now. Bounced off 100 MA, trading right at box support, Dec 17 trade price targets discussed to low side. Adds at each support is the trading plan for ALIBABA should sell-off continue.

https://www.tradingview.com/chart/BABA/gKTnmCkK-BABA/

trading, BABA, ALIBABA
ALIBABA (BABA) got a bounce at 100 MA under rane support, watching close here now $BABA #tradealerts #swingtrading

FACEBOOK $FB – 20 MA upside resistance trade alarm set for possible turn on the snap-back trade I’m looking for. 240 min chart.

https://www.tradingview.com/chart/FB/iwdxQYxE-FACEBOOK-FB-On-watch-for-wash-out-snap-back-trade-now-main-su/

Facebook, chart
FACEBOOK (FB) On watch for wash-out snap-back trade now, main support and resistance marked on chart $FB #swingtrade #daytrade

Top momentum stocks for the day reviewed;

$OTM 20 MA resistance on weekly, above will target the 50 MA. It respects the 50 MA and 200 MA on weekly chart. Trading plan reviewed on video.

$LEU – stay away from

$FF – Currently at support and resistance area, price extensions for a possible run are reviewed on video. Targets 23.67 in a bullish scenario, trading 17.63.

$TAHO – junk

$GHG – junk, no structure

$CEL – not a good chart

$CWH – terrible

$SPA – at previous lows, bounced there before…. but…. no structure

$SUPV – junk

$TGS – bounced off 200 MA support, good example of a bullish run out of the bowl for multiple extensions up on the chart.

$WAB – not interested

$AG – on 200 MA support, not interested.

$SENS – support 3.97 trading 4.16, looking for a bounce. The trade set-up will be on the upcoming swing trading report.

https://www.tradingview.com/chart/SENS/3pgi46jC-SENSEONICS-SENS-4-HR-Daytrading-chart-Structured-algorithmic/

Others were also reviewed.

VIDEO Trade Alerts: $VIX $WTI $CL_F $PROQR $CARA $BOX $BABA $SSW $SPY $FB $SENS #daytrading #swingtrading

Voice broadcast does not start until 3:18 on video.

Register to free email list for trade set-ups, webinars, special events: https://compoundtrading.com/contact/ 

Website: https://compoundtrading.com

Free chat room: https://discord.gg/2HRTk6n

Subscribe: https://compoundtrading.com/overview-…

Twitter: https://twitter.com/CompoundTrading

Lead Trader: https://twitter.com/curtmelonopoly

Tradingview: https://www.tradingview.com/u/curtmel…

Facebook: https://www.facebook.com/compoundtrad…

StockTwits: https://stocktwits.com/compoundtrading

Email: https://[email protected]

#tradealerts #swingtrading #daytrading

Article Topics; Trade Alerts, Trading, $VIX, $WTI, $CL_F, $USO, $PROQR, $CARA, $BOX, $BABA, $SSW, $DXY, $SPY, $GTHX, $FB, $FF, $SENS, swingtrading, daytrading

Read More
Crude Oil Algorithm Trading Report (EPIC) w/ Gen 2 Machine Trade Mon Sept 17 FX: $USOIL $WTI $CL_F $USO #Oil #Trading #Algorithm

Crude Oil Algorithm Trading Report (EPIC) w/ Gen 2 Machine Trade Mon Sept 17 FX: $USOIL $WTI $CL_F $USO #Oil #Trading #Algorithm

September 17, 2018February 5, 2019 Curt MelonopolyCrude Oil Trading Alerts, Crude Oil Trading Algorithm (EPIC), Crude Oil Trading Room$CL_F, $USO, $USOIL, $WTI, Alerts, Algorithm, Charts, chat, Crude, EPIC, Oil, Signals, Trade, Trading Room

Crude Oil Trading Algorithm Chart Report (EPIC) Monday September 17, 2018.

FX: $USOIL $WTI $USO $CL_F $UWT $DWT $UCO $SCO $ERX $ERY $GUSH $DRIP

Welcome to the oil trading algorithm report. My name is EPIC the Oil Algorithm and I am one of seven primary Algorithmic Chart Models in development at Compound Trading Group (there are over one hundred in total in development at various stages in various markets).

NOTICES:

New members to our oil algorithm charting models, oil trade alerts and oil trading room are encouraged to on-board in a way that equips you as an oil trader for consistent profit.

Visit my public Twitter feed EPIC Oil Algorithm Twitter (@EPICtheAlgo) and review tweets over the last few months, visit our blog and review the recent crude oil trading algorithm blog posts, our You Tube channel “how my oil algorithm works”, “how to use my charting”, weekly EIA oil report videos and our website explains how the oil algorithm was developed.

Invaluable are the crude oil trade alerts (available with or without the trading room / weekly report bundle) and the private member crude oil trading chat room on Discord (included in the bundle). The live alerts are important if you are not at your trading screens 24 hours a day and the chat room allows for interactive lead trader oil trade set-ups as each oil trade approaches.

Reviewing important points of reference and engaging the subscription resources will increase your probability of success considerably. This report also includes links to some recent example “how-to” videos.

Oil Trade Coaching – We strongly suggest users of this algorithmic crude oil trading strategy opt for some level of private one-on-one coaching with our lead trader. Our lead trader is currently maintaining a crude oil trading alert win-rate of over 90% (as of Sept 2, 2018 – time-stamped, live alert, recorded).

On our website one-on-one online coaching packages are made available (coaching via Skype) or you can request a custom package reflecting the time you wish to invest in learning. To request a custom package suited to your needs email [email protected] or click here for standard private trade coaching packages. Other options for coaching include online webinars, trade coaching bootcamps and private on location (in person) coaching sessions. 

Oil Trading Room – How to Use the Oil Algorithm

Oil Trading Room – How to Trade Intra-day with my Algorithmic Oil Charting

Oil Trading Alerts. Live Lead Trader Video Trading w EPIC Oil Algorithm

Recent articles from our blog about how to trade crude oil with our oil trading algorithm:

Oil Trade Alerts: How We Knew Where Oil Sell-Off Bottom Was in Advance. Crude Oil Trading Strategy.

Crude Oil Trading Face-Off Results “Pro Trader” (Man) vs. EPIC Oil Algorithm (Machine Trading Tech).

Oil Trading Alerts Live Video w EPIC Oil Algorithm #EIA Report.

“The Nut Hand” Today’s Huge Oil Trade Win. Exactly How It Was Done. How I Knew & How You Can Too.

CRITICAL Oil Trade. Weekly Timing. EPIC Oil Algorithm Channel $USOIL $WTI $CL_F $USO. 

MULTI-USERS: Institutional / commercial platform now available.

SOFTWARE: My algorithmic charting is now also in the coding phase for our trader’s dashboard program. Please review my algorithm development process, about my oil algorithm story on our website www.compoundtrading.com and my oil algo charting posts on my Twitter feed and/or this blog.

HOW MY ALGORITHM WORKS: I am an oil algorithm model in development. My math is based on traditional indicators (up to fifty at any given time each weighted on win ratio merit – all not shown on chart at any given time) – such as simple math calculations relating to price and volume, Fibonacci, simple pivots, moving averages, Gann, Schiff and various other charting, geometric and mathematical factors. I do not yet have AI integration – only math as it relates to traditional indicators with the primary goal being probabilities. I am not a high frequency robot type algorithm – I am presented on (and used on) a traditional trading chart as one would normally use as a probability indicator.

The goal is to provide oil traders with a signals edge when triggering entries and exits on trades with instruments that rely on the price of crude oil – first with the reporting format as below, then with machine trading functions and an integrated intelligent assisted traders platform that will provide the user with various settings of automation and personal trade execution.

In the weekly report below you will find simplified levels represented on conventional and algorithmic charting for intra-day (day-trading crude oil), swing trading and investing. You will also find below introduction of our Generation 2 machine trading models.

This work (and associated trading) should be considered one decision at a time, “if this happens then this or this are my targets”… price – trigger – trade and so on.oil related financial instruments.

Forward questions to [email protected], private message our lead trader on Twitter or in the private Discord oil trading room.

For further information this link explains how our algorithmic charting is done, this YouTube video explains in summary how my algorithm works https://www.youtube.com/watch?v=LUNyxFoXJp8 this link for more information about our algorithmic stock charting models and what makes them different than most.

EVERY CALL WE MAKE, EVERY PUBLIC INTERACTION, REPRESENTATION OF TRADE SIGNAL (ON EVERY VENUE) IS VIDEO RECORDED, ON SOCIAL MEDIA OR ON BLOG / WEBSITE TIME-STAMPED FOR PERMANENT RECORD AND TRANSPARENCY. PLEASE ALSO REFER TO OUR PUBLIC DISCLOSURE https://compoundtrading.com/disclosure-disclaimer/.

Oil Algorithm Observations:

Below is a link for the live algorithmic chart of EPIC the Crude Oil Trading Algorithm (Generation 1, Version 5 including black box modeling). The charting is a real-time trading chart represented on FX $USOIL $WTI published Sept 17, 2018.

A Generation 1, Version 6 model (with and without machine trading chart overlays) is currently also available. Per member request we will continue to post both Gen 1 and Gen 2 models (we had previously planned to discontinue including Gen 1 in weekly reporting).

Click on share button (bottom right beside flag) and when that screen opens click on “make it mine” to view real-time, make edits etc:

Crude Oil Trading Algorithm. Gen1.V5 (EPIC). Current crude oil trade. Sept 17 441 AM FX $USOIL $WTI $USO $UWT $DWT $CL_F #Crude #Oil #Algorithm #OOTT

https://www.tradingview.com/chart/USOIL/aIhSI7ji-Crude-Oil-Trading-Algorithm-Gen1-V5-EPIC-Current-crude-oil-t/

crude, oil, trading, algorithm
Crude Oil Trading Algorithm. Gen1.V5 (EPIC). Current crude oil trade. Sept 17 441 AM FX $USOIL $WTI $USO $UWT $DWT $CL_F #Crude #Oil #Algorithm #OOTT

Sept 17, 2018

Generation 1 Model Oil Trading Signals

The first most predictable trade are the resistance and support cluster areas formed by long term chart trend lines (see charts that have trend-lines represented in red as made available below near bottom of this report – conventional charting trend-lines).

The second most predictable trade (wide trading range primary resistance and support that become predictable buy and sell triggers). Current algorithmic model wide trading range resistance (grey arrow – grey horizontal line) at approximately 72.54 in the current trading range. Current algorithmic model wide trading range support (grey arrow – grey horizontal line) at approximately 68.93 in the current trading range – these areas are general range support and resistance areas (our algorithm uses a .15 – .20 cent buffer on either side for these trades – if that is exceeded then trading price is likely to use the line as a pivot until a directional trending trade is established).

Trading between the resistance / support horizontal grey lines is extremely profitable risk – reward if one is disciplined to the patience required and follows the trend of trade.

More recently (as of September 2018) our back-testing has shown that the support and resistance areas noted are used in trade as a decision pivot – in other words, the price tends to pivot around these decision points on the chart and coil over a period of time and then spring out of the coil in an upward or downward trend.

The lower trading range is 65.32 – 68.92 and upper trading range 72.55 to 76.15.

Third most predictable trade (support and resistance of uptrend or down trend channels). On the chart an upward trending trade channel is presented and a downward option (channel support and resistance / trading range is represented as diagonal dotted orange lines and purple arrows – as made available, assist in displaying directional trade decision areas).

Fourth most predictable trade (support and resistance of 30 min quadrants). The diagonal lines make up quadrants (in this instance on a 30 min chart) and are represented as orange diagonal lines that make up geometric diamond shapes. These lines also assist in intra-day trade.

Fifth most predictable trade (support and resistance of most applicable Fibonacci) the Fib support and resistance lines are the horizontal lines in various colors with the exception of purple and yellow (see below). These horizontal lines become support and resistance for intra-day trade.

Sixth most predictable trade (support and resistance of historical support and resistance) Natural / historical support and resistance lines shown in purple or yellow – they represent historical support and resistance. The strongest of the historical support and resistance lines are shown in yellow horizontal and are typically accompanied by a yellow arrow marker.

Seventh most predictable trade signal we use are the time and price targets (red circles). When trade is in a significant uptrend or downtrend the targets become very precise and move up the indicator priority list quick.

Tues, Wed and Fri targets are most predictable in extended multi week uptrends or downtrends. In recent time, trade could be described as range-bound under key resistance on weekly chart.

The Eighth most predictable trade is intra-day. You will notice on some of the charting geometric shapes in green on some of my charting (at times). They are charted live in the trading room and at times the lead trader will highlight these areas intra with white outlines (typically geometric shapes such as diamonds or triangles).

Intra-day Trading Bias

Intra day bias is up as the trading the last number of days has been in sell mode so a bounce should occur soon, however, the MACD is turned down on the daily chart and this indicator is usually a leading indicator for oil trade.

Wide Trading Range – Buy and Sell Triggers for Swing Trading Crude Oil:

Swing trading bias / forward guidance as of Sept 17, 2018 5:14 AM EST for the near term (two week swing trade) is bullish in uptrending channels as trade bounced off range support (thick gray line) in overnight futures trading. 

Trade the ranges noted above between the thick grey lines (grey arrows) for the most predictable swing trades between 58.13 to 61.72, 61.72 to 65.32, 65.32 to 68.92, 68.93 to 72.54 and 72.55 to 76.15. This is a highly profitable risk-reward way to trade oil if you can be patient to trigger at only the break of the wide range charting areas and are disciplined to cut a losing trade that does not prove in your anticipated trend.

Or trade the range between the channel diagonal lines at support and resistance in up or down channel (orange dotted diagonals).

Significantly more advanced trading rules will be introduced over the coming weeks with the newer Generation 2 models per below in this report.

Also, the recent trade coaching boot camp provided for excellent trading on the Friday in oil and also many other charting set-ups – excerpts from the trade coaching event will be released soon for members.

Crude Oil Trading Algorithm. Gen1.V5 (EPIC). Down trending channel scenario. Sept 17 522 AM FX $USOIL $WTI $USO $UWT $DWT $CL_F #Crude #Oil #Algorithm #OOTT

crude, oil , algorithm, down, channel, chart
Crude Oil Trading Algorithm. Gen1.V5 (EPIC). Down trending channel scenario. Sept 17 522 AM FX $USOIL $WTI $USO $UWT $DWT $CL_F #Crude #Oil #Algorithm #OOTT

Crude Oil Trading Algorithm. Gen1.V5 (EPIC). Up trending channel scenario. Sept 17 524 AM FX $USOIL $WTI $USO $UWT $DWT $CL_F #Crude #Oil #Algorithm #OOTT

Crude, oil, algorithm, uptrend
Crude Oil Trading Algorithm. Gen1.V5 (EPIC). Up trending channel scenario. Sept 17 524 AM FX $USOIL $WTI $USO $UWT $DWT $CL_F #Crude #Oil #Algorithm #OOTT

Generation 2 Model Oil Trading Signals.

Crude Oil Trading Algorithm. Gen2.V2 (EPIC). Machine trading intra-day. Sept 17 552 AM FX $USOIL $WTI $USO $UWT $DWT $CL_F #Crude #Oil #Algorithm #OOTT

This is an alternate machine trading model currently in development.

https://www.tradingview.com/chart/USOIL/KZPGrSny-Crude-Oil-Trading-Algorithm-Gen2-V2-EPIC-Machine-trading-int/

Crude, oil, machine, trading, algorithm
Crude Oil Trading Algorithm. Gen2.V2 (EPIC). Machine trading intra-day. Sept 17 552 AM FX $USOIL $WTI $USO $UWT $DWT $CL_F #Crude #Oil #Algorithm #OOTT

Per previous;

Crude Oil Trading Algorithm. Gen2.V1 (EPIC). Machine trading intra-day. Sept 11 1246 AM FX $USOIL $WTI $USO $UWT $DWT $CL_F #Crude #Oil #Algorithm #OOTT

https://www.tradingview.com/chart/USOIL/zBBnd8C8-Crude-Oil-Trading-Algorithm-Gen2-V1-EPIC-Machine-trading-int/

Crude, oil, algorithm, machine, trading
Crude Oil Trading Algorithm. Gen2.V1 (EPIC). Machine trading intra-day. Sept 11 1246 AM FX $USOIL $WTI $USO $UWT $DWT $CL_F #Crude #Oil #Algorithm #OOTT

Generation 1 Day-trading Crude Oil 1 Minute Chart Signals

Sept 17 – Currently in updating by technician, will be added to Discord room when available.

During a squeeze trade spikes upward through the highlighted area and then rests and works its way through the next area and spikes through the next highlighted area. This does not occur in regular trade. More on this chart in our special reporting for oil trading over the coming days.

7:58 AM update Sept 17:

Crude Oil Day-Trading Chart Signals. 1 minute time frame. Sept 17 723 AM FX $USOIL $WTI $USO $UWT $DWT $CL_F #OIL #Chart

https://www.tradingview.com/chart/USOIL/dn38QRqh-Crude-Oil-Day-Trading-Chart-Signals-1-minute-time-frame-Sept-1/

Crude, oil, chart, 1 min
Crude Oil Day-Trading Chart Signals. 1 minute time frame. Sept 17 723 AM FX $USOIL $WTI $USO $UWT $DWT $CL_F #OIL #Chart

Per recent;

Crude Oil Day-Trading Chart Signals. 1 minute time frame. Sept 11 151 AM FX $USOIL $WTI $USO $UWT $DWT $CL_F #OIL #Chart

https://www.tradingview.com/chart/USOIL/SOTfqMf9-Crude-Oil-Day-Trading-Chart-Signals-1-minute-time-frame-Sept-1/

Crude, oil, day, trading, chart
Crude Oil Day-Trading Chart Signals. 1 minute time frame. Sept 11 151 AM FX $USOIL $WTI $USO $UWT $DWT $CL_F #OIL #Chart

Crude Oil Swing Trade Charting.

Monthly Oil Chart:

Sept 17 – Oil trading at monthly pivot 69.54 per previous chart below;

Crude Oil Monthly Chart. Near 200 MA, still trading generally between 200 MA and 100 MA on monthly. Sept 11 159 AM FX $USOIL $WTI $USO $UWT $DWT $CL_F #OIL #chart

https://www.tradingview.com/chart/USOIL/03XF1bEv-Crude-Oil-Monthly-Chart-Near-200-MA-still-trading-generally-be/

Crude, oil, monthly, chart
Crude Oil Monthly Chart. Near 200 MA, still trading generally between 200 MA and 100 MA on monthly. Sept 11 159 AM FX $USOIL $WTI $USO $UWT $DWT $CL_F #OIL #chart

Weekly Crude Oil Chart:

Crude Oil Weekly Chart Wedge. Failure at lower trend line likely. Sept 17 618 AM AM FX $USOIL $WTI $USO $UWT $DWT $CL_F #OIL #chart

https://www.tradingview.com/chart/USOIL/SqcHep3l-Crude-Oil-Weekly-Chart-Wedge-Failure-at-lower-trend-line-likely/

Crude, oil, chart, weekly, wedge, setup
Crude Oil Weekly Chart Wedge. Failure at lower trend line likely. Sept 17 618 AM AM FX $USOIL $WTI $USO $UWT $DWT $CL_F #OIL #chart

Per recent:

Below are three weekly chart scenarios.

Crude Oil Algorithm Simple Weekly Gen 1 Model has price at 72.11 Sept 10. Sept 2 1052 PM FX $USOIL $WTI $USO $UWT $DWT $CL_F #OIL #Algorithm #OOTT

https://www.tradingview.com/chart/USOIL/MLUSjRgB-Crude-Oil-Algorithm-Simple-Weekly-Gen-1-Model-has-price-at-72-11/

Weekly, oil, trading, algorithm
Crude Oil Algorithm Simple Weekly Gen 1 Model has price at 72.11 Sept 10. Sept 2 1052 PM FX $USOIL $WTI $USO $UWT $DWT $CL_F #OIL #Algorithm #OOTT

Sept 10 crude oil price target scenarios. Sept 2 1048 PM $USOI $WTI $CL_F Weekly #chart #oil

https://www.tradingview.com/chart/USOIL/qJPd2GCF-Sept-10-crude-oil-price-target-scenarios-Sept-2-1048-PM-USOI/

weekly, oil, price, targets
https://www.tradingview.com/chart/USOIL/qJPd2GCF-Sept-10-crude-oil-price-target-scenarios-Sept-2-1048-PM-USOI/

Crude Oil Weekly Chart Scenario III Sept 2 1043 PM FX $USOIL $WTI $USO $UWT $DWT $CL_F #OIL #Algorithm #OOTT

https://www.tradingview.com/chart/USOIL/EzqJ1NvT-Crude-Oil-Weekly-Chart-Scenario-III-Sept-2-1043-PM-FX-USOIL-WT/

Crude, oil, weekly, chart, scenario
Crude Oil Weekly Chart Scenario III Sept 2 1043 PM FX $USOIL $WTI $USO $UWT $DWT $CL_F #OIL #Algorithm #OOTT

May 21 – A feature post was published this week to review time cycles, retrace possibilities on the other side of time cycles on the weekly charts. Below is the post link:

Feature Post: 12 of Last 13 Oil Chart Time-Cycles Have Trend Reversal. $USOIL $WTI $CL_F $USO $UCO $UWT $DWT #OIL #OOTT

Daily Oil Chart:

Crude Oil Daily Chart, MACD turning back up with price above 50 MA Sept 17 623 AM FX $USOIL $WTI $USO $UWT $DWT $CL_F #OIL #chart

https://www.tradingview.com/chart/USOIL/4zzZ0a9h-Crude-Oil-Daily-Chart-MACD-turning-back-up-with-price-above-50/

Crude, oil, daily, chart
Crude Oil Daily Chart, MACD turning back up with price above 50 MA Sept 17 623 AM FX $USOIL $WTI $USO $UWT $DWT $CL_F #OIL #chart

Diagonal Trend Lines:

Diagonal trend-lines are critical inflection points (currently represented in red below on our conventional charting).

Please review many of my recent posts so you can learn about how important these diagonal trend-lines are. If one is breached you can look to pull-back to next diagonal trend line about 90% of the time. Also pay attention to how thick the lines are – the thicker the line the more important because they represent extensions from previous time / price cycles.

Remember you can come in to the chat room to message the trader and REMEMBER I have posted a live chart link in this post so if you can’t see the lines well on this chart above you can go to the live chart link and watch for member live algo chart links through-out the day in your email inbox!

The diagonal trend-lines are marked on chart below:

Sept 17: Previous remains signal;

Oil Chart (Weekly). Oil trend lines on weekly time-frame. Aug 12 951 PM FX $USOIL $WTI $USO $UWT $DWT $CL_F #OIL

Significant probability oil hits 79.50 ish Dec 3, 2018 ish. But over that area unlikely unless there is a geo political event. Over 79.50 the shorts would get wrecked. Low 50s most probable by 2022. Early Dec 2018 is likely the highs. $USOIL $WTI $CL_F $USO #OOTT

https://www.tradingview.com/chart/USOIL/ouLad9xj-Crude-oil-weekly-trendline-chart-suggests-79-50-area-Dec-3-2018/

oil, trend lines, chart
Oil Chart (Weekly). Oil trend lines on weekly time-frame. Aug 12 951 PM FX $USOIL $WTI $USO $UWT $DWT $CL_F #OIL

Oil Chart (Weekly). Oil trend lines on weekly time-frame. Aug 7 605 AM FX $USOIL $WTI $USO $UWT $DWT $CL_F #OIL

https://www.tradingview.com/chart/USOIL/bS8T4ism-Oil-Chart-Weekly-Oil-trend-lines-on-weekly-time-frame-Aug-7/

Oil, trend line, chart
Oil Chart (Weekly). Oil trend lines on weekly time-frame. Aug 7 605 AM FX $USOIL $WTI $USO $UWT $DWT $CL_F #OIL

Previous posts for perspective;

Oil has now cleared every trendline resistance provided on conventional charting I’ve posted last year. $USOIL $WTI $CL_F #OOTT #OIL $USO $UWT $DWT 233 PM Jan 1

Oil, trendline, resistance, chart
Oil has now cleared every trendline resistance provided on conventional charting I’ve posted last year. $USOIL $WTI $CL_F #OOTT #OIL $USO $UWT $DWT 233 PM Jan 1
$USOIL, $WTI, Chart, Trendlines
Simple lines show expose clusters of resistance. Crude algo intra work sheet 201 AM Apr 10 FX $USOIL $WTIC #OIL $CL_F CL $USO $UCO $SCO $UWT $DWT #OOTT

Notice when the daily chart is opened, the simple lines extend to current day trade.

Daily chart view. Simple lines show expose clusters of resistance. Crude algo intra work sheet 213 AM Apr 10 FX $USOIL $WTIC #OIL $CL_F CL $USO $UCO $SCO $UWT $DWT #OOTT

Daily, $USOIL $WTI, Chart, Trendlines
Daily chart view. Simple lines show expose clusters of resistance. Crude algo intra work sheet 213 AM Apr 10 FX $USOIL $WTIC #OIL $CL_F CL $USO $UCO $SCO $UWT $DWT #OOTT

Fibonacci Levels:

Watch the lines for support and resistance. Careful using them as traditional retracement levels with crude because the algo lines etc are more dominant / predictable. But the Fib lines are excellent indicators for intra-day trade support and resistance.

The Fibonacci lines are marked on main chart above.

Horizontal Trend-Lines (purple):

Horizontal trend-lines are not as important as the other indicators reviewed above, however, they do serve as important resistance and support intra-day for tight trading and they are important if thick (in other words they come from previous time / price cycles). WE STARTED TO REPRESENT THE REALLY IMPORTANT LINES IN YELLOW FYI FOR EASE. Refer to chart for current applicable horizontal trend-lines.

Horizontal trend-lines are marked on charts above.

Oil Time / Price Cycles:

Watch your email and / or my Twitter feed for time price cycles they may start to terminate.

Time / price cycles are the single most important indicator and my record calling them is near 100% – since inception seven months ago. The reason they are so important is that a trader does not want to be holding a crude oil instrument at termination of a time cycle if not absolutely sure if price will go up or down. A trade may choose to enter a large position in advance of a time price cycle termination IF THERE IS A HIGH PROBABILITY OF A DIRECTION IN PRICE and if the market is trading at a really important pivot area. In other words, if the market is trading at the bottom of the upward trending channel at a support (yellow lines) and we knew there was a significant probability of a time cycle about to terminate a trader may enter with a long position. The price really spikes or drops significantly when these important time cycles terminate.

The problem with time / price cycle terminations is they change from minute to minute (depending on where price is on the chart) so you have to be in the trade room to get the alert. Our lead traders will do everything they can in future to send these on SMS but we have to be careful because it can be difficult with so much going on in the room. The reason they (time cycles) change is because they are actually represented by or are geometric shapes in the chart – I know it sounds odd but I have (as I mentioned) hit these calls just shy of 100%. The oil political people know the same algorithmic modeling principles and they ALWAYS TIME THEIR BIG ANNOUNCEMENTS AROUND THE TIME PRICE CYCLE TERMINATIONS.

So if you can picture a triangle on the chart – and price is trading in the triangle – and price is going to come to the edge of the triangle and there is a significant support or resistance or an algo line terminating there too or a target (those type of indications)… then we know there is a high probability of a time and price change. In other words, it is where there are clusters of algorithm points that cross and when price is going to cross over that cluster is where they are. And these are represented on all the different time frames – the larger the time frame – the larger the time price cycle termination – the larger the spike or downdraft. This is where we establish our intra-day quadrants from for sniping trades (which we will put in to the room soon because it looks like the geo political rhetoric is over for a while making them more predictable). Difficult to explain in short. So we will do our best to SMS alert these in future.

Also, the real large or important time / price cycle terminations we know far in advance and they can be put in these newsletters.

If you review my Epic the Oil Algo Twitter feed, my blog posts and my story on our website you will get a feel for how accurate these calls are.

Alpha Algo Trading Trend-Lines (Primary – Red dotted lines. Secondary – White dotted lines):

To determine which algo line is most alpha (or probable) intra day, it is the nearest line to price action. This can also help you determine the trend of trade. If the algo line is trending up the price will follow it up until price is tested at an algorithm indicator (the main tests are diagonal trendlines, horizontal trendlines, time / price cycles etc – as I have shared with you). This is why it is important to watch all the lines because they are all support and resistance. To keep it simple trade the range (yellow lines) as I’ve mentioned but keep an eye on these indicators.

Current Alpha Algo Targets (Red circles):

Your closest target that crude is trending toward is always the most probable.Then, your second most probable is the one that is up or down trend depending on whether general price is in an upward or downtrend for the most recent week or so and what your other indicators look like (such as the MA’s I explained above).

The other way to determine which targets are in play is actually quite simple, you will notice that crude trades between the channel lines up and down and up and down and there are various support and resistance along the way. If it hits a target at the top of the channel you can bet most times (unless the next day like today) that the next target hit will be at the bottom of the channel.

Wait for the price to trend toward a target and take your position and watch as price gets closer and closer to the target. Remember, that the machines trade from decision to decision – or in other words from support to next resistance or resistance to next support or when the times come each week on Tuesday Wednesday and Friday they will trend toward the target that market price action determines they go to.

Our lead trader will explain more in the room and do not hesitate to ask our lead trader in the room by private message or on twitter to explain intra day decisions.

Recent Live Crude Oil Trade Alerts (sample signals):

Sept 17 – Recent trade alerts will be updated soon.

Aug 12 2018 – Recent trades are found in this recent report:

Crude Oil Trading Face-Off Results “Pro Trader” (Man) vs. EPIC Oil Algorithm (Machine Trading Tech)

Click on feature post for recent crude oil trading alerts blog post; Oil Trading Alerts Live Video w EPIC Oil Algorithm #EIA Report #Oil #Trading #Algorithm #Alerts $USOIL $WTI $CL_F

Oil trade alert to start the week 68.61 long, 68.85 closed. Win rate high 90% – ask for a tour. Time stamped, recorded, live alerts. 

https://twitter.com/EPICtheAlgo/status/1026287786113081344

Oil trade alert to start the week 68.61 long, 68.85 closed. 

oil, trading, alert
Oil trade alert to start the week 68.61 long, 68.85 closed. EPIC Oil Algorithm $USOIL $WTI $CL_F #OilTradeAlerts $UWT $DWT

Oil trade alert to start the week 68.61 long, 68.85 closed (Part 2). 

Crude, oil, trade alert, PT2
Oil trade alert to start the week 68.61 long, 68.85 closed (Part 2). EPIC Oil Algorithm $USOIL $WTI $CL_F #OilTradeAlerts $UWT $DWT

Machine trading 🙂 

Machine trading 🙂 $USOIL $WTI $CL_F #OIL #Algorithmic #trading #alerts pic.twitter.com/Hja5Tbgmob

— Melonopoly (@curtmelonopoly) August 3, 2018

A scalp to start the day. Multi-month winning streak continues. Ask for a tour of the feed if you need proof. 

A scalp to start the day. Multi-month winning streak continues. Ask for a tour of the feed if you need proof. EPIC Oil Algorithm FX $USOIL $WTI #CL $USO $UWT $DWT #OOTT #Oil #trading #algorithm pic.twitter.com/JTHCMp58Cv

— Melonopoly (@curtmelonopoly) July 27, 2018

100% personal alerted oil trade win rate documented, recorded, alerted real time to feed continues for months (we did have one loss alert by a tech a few weeks back). 

100% personal alerted oil trade win rate documented, recorded, alerted real time to feed continues for months (we did have one loss alert by a tech a few weeks back). EPIC the Oil Algorithm FX $USOIL $WTI $USO $UWT $DWT #OIl #OOTT #Trading @EPICtheAlgo pic.twitter.com/pKL1iKE5T1

— Melonopoly (@curtmelonopoly) July 25, 2018

Live oil trade alert. Long 69.06 US OIL WTI 1 5th sizing EPIC Oil Algorithm.

oil, trade, alerts, WTI
Live oil trade alert. Long 69.06 US OIL WTI 1 5th sizing EPIC Oil Algorithm $USOIL $WTI #OIL #OOTT $UWT $DWT $USO

Live oil trade alert. Trim 50 percent 69.30. EPIC Oil Algorithm.

oil, trading, alerts, crude
Live oil trade alert. Trim 50 percent 69.30. EPIC Oil Algorithm $USOIL $WTI #OIL #OOTT $UWT $DWT $USO #trading #alerts

Live oil trade alert. Long 68.93 add 50 percent. EPIC Oil Algorithm. 

oil, trading, alert, long
Live oil trade alert. Long 68.93 add 50 percent. EPIC Oil Algorithm $USOIL $WTI #OIL #OOTT $UWT $DWT $USO #trading #alerts

Live oil trade alert. Trim other 50 percent 69.26 50 percent.

Live, oil, trade, alert, trim
Live oil trade alert. Trim other 50 percent 69.26 50 percent. EPIC Oil Algorithm $USOIL $WTI #OIL #OOTT $UWT $DWT $USO #trading #alerts

Overnight oil trade: short 72.79 add 72.71 cover 72.27s-72.35s. Not cleanest trade but HUGE win. 100% win rate continues (for months). Guidance detail in oil trading room (to expect heat). Live alerts, time stamped, recorded.

https://twitter.com/EPICtheAlgo/status/1015202909041102849

Overnight oil trade alert short 72.79 add 72.71 cover 72.27s to 72.35s. Not cleanest trade but HUGE win. 100% win rate continues 

Oil, trade, alert, short
Overnight oil trade short 72.79 add 72.71 cover 72.27s to 72.35s. Not cleanest trade but HUGE win. 100% win rate continues $USOIL $WTI $USO #OIL #Trading #Alerts

Member guidance in oil chat room this morning “i’ll be selling spikes in to resistance until it doesn’t work – the larger more obvious i’ll alert against downtrend upper channel orange dotted etc” 

https://twitter.com/EPICtheAlgo/status/1014943645974323204

Member guidance this morning in crude oil trading room – i’ll be selling spikes in to resistance until it doesn’t work 

Oil, chat, trading, room, guidance
Member guidance this morning i’ll be selling spikes in to resistance until it doesn’t work $USOIL $WTI $USO $UWT $DWT EPIC Oil Algorithm #oil #trading #alerts

Scalp day. 100 percent win rate for months continues. Time stamped, live oil alerted, recorded. 

https://twitter.com/EPICtheAlgo/status/1014938308961595393

100 percent win rate for months continues. Time stamped, live alerted, recorded. #oilalerts

oil, trade, alerts, winning, rate, ,best
100 percent win rate for months continues. Time stamped, live alerted, recorded. $USOIL $WTI $USO $UWT $DWT EPIC Oil Algorithm #oil #trading #alerts

Oil trading chat room member guidance and intra day daytrading charting example ‘70.02 would be the swing retrace. So the thesis is sound but you may have pain before potential drop”.

oil, trading, chat, room, guidance
70.02 would be the swing retrace. So the thesis is sound but you may have pain before potential drop.

Crude oil trading room member guidance and intra day daytrading charting example “Target is in 70.70 area so I will likely give this lots of room swing if I have to. We’ll see”.

oil, trade, alert, price, targets
Target is in 70.70 area so I will likely give this lots of room swing if I have to. We’ll see. FX $USOIL $WTI #OilTrading

Oil trade chat room member guidance and intra day daytrading charting example “Machines defending the retrace intra day”.

oil, machine, trading, WTI
Machines defending the retrace intra day FX $USOIL $WTI #OIL #Algorithm

Trims / close longs 71.39 to 71.71 crude oil trade alert. 

https://twitter.com/EPICtheAlgo/status/1011981290051129346

Long 71.21 oil trade alert with the one add. 

https://twitter.com/EPICtheAlgo/status/1011980052198719488

Today’s #EIA oil trade with Oil Algorithm (EPIC) Live alert entries (green) exits (red).

https://twitter.com/EPICtheAlgo/status/1011977209442177026

Screen shot member oil chat room first oil trade alert of day – Long 71.21 hoping we squeeze in to EIA

EIA, oil, trading, chat, room
Screen shot member oil chat room first oil trade alert of day – Long 71.21 hoping we squeeze in to EIA

One minute algorithmic on the fly chart trade came off after initial long side oil trade alert- see green arrow. 

oil, trade, alert, chart, trades
One minute algorithmic on the fly chart trade came off after initial long side oil trade alert- see green arrow. #oiltradealert #oil

Screen shot of crude oil signals alert to trim half at 71.39 place stop 71.26 on remaining half and resistance guidance. 

oil, trade, alert, trim, position
Screen shot of alert to trim half at 71.39 place stop 71.26 on remaining half and resistance guidance. #oil #trading #chat

Oil chat room screen shot of next trade signal alert to trim long at 71.52 25 percent and hold 25 percent.

oil, trading, alert, chat, room
Oil chat room screen shot of next trade alert to trim long at 71.52 25 percent and hold 25 percent.

Final crude oil trade alert signal to close final 12.5 percent at 71.74 and hold 0 percent at chart resistance.

oil, crude, oil, trading, alert
Final crude oil trade alert to close final 12.5 percent at 71.74 and hold 0 percent at chart resistance.

And then the post EIA 1030 Wed trade alert with trading signals plan price targets were posted – usually wait 2nd 5 min candle

oil, trade, alerts, EIA, report
And then the post EIA 1030 Wed trade alert with trading plan price targets were posted – usually wait 2nd 5 min candle

And then this happened, oil shot up right through the price targets from the alert.

oi, trade, alert, price, targets, reached
And then this happened, oil shot up right through the price targets from the alert.

Winning streak continues. 100% live oil trade alert win rate for many weeks now. Time stamped real time. 

https://twitter.com/EPICtheAlgo/status/1010004212950843392

EPIC Oil Algorithm trade alert wins continue for many weeks now. Time stamped real time. 

oil, trade, alerts, winning, streak
EPIC Oil Algorithm trade alert wins continue for many weeks now. Time stamped real time. FX $USOIL $WTI $CL_F $USO #OIL #OOTT #Oiltradealerts #algorithm

Boom “3rd target hit. Trade thesis complete for #EIA. Next levels to follow. 

Boom "3rd target hit. Trade thesis complete for #EIA. Next levels to follow. Oil Algorithm (EPIC). June 20 1148 AM FX $USOIL $WTI $USO $UWT $DWT $CL_F #OIL #Algorithm #OOTT " pic.twitter.com/WAl4N9n2yH

— Melonopoly (@curtmelonopoly) June 20, 2018

First 3 targets intra if long side trade alert holds. Trim in add above or on pull back and turns up.

oil, trading, plan, chart, price, targets
First 3 targets intra if long side trade alert holds. Trim in add above or on pull back and turns up. Oil Algorithm (EPIC). June 20 1046 AM FX $USOIL $WTI $USO $UWT $DWT $CL_F #OIL #Algorithm #OOTT

Trade is using our 50% retrace on daytrade coding level intra as pivot.

oil, trade, alert, member, guidance, charting
Trade is using our 50% retrace on daytrade coding level intra as pivot Oil Algorithm (EPIC). June 20 1058 AM FX $USOIL $WTI $USO $UWT $DWT $CL_F #OIL #Algorithm #OOTT

Close up of intra day trading battle.

oil, trading, plan, chart, alert
Close up of intra day trading battle #daytrading Oil Algorithm (EPIC). June 20 1105 AM FX $USOIL $WTI $USO $UWT $DWT $CL_F #OIL #Algorithm #OOTT

1st of 3 targets hit. Curt didn’t get it but coding team did.

oil, algorithm, trading, alert
1st of 3 targets hit. Curt didn’t get it but coding team did. Oil Algorithm (EPIC). June 20 1121 AM FX $USOIL $WTI $USO $UWT $DWT $CL_F #OIL #Algorithm #OOTT

Up over 1st target longs want to trim in to 2nd target level.

live, oil, trade, in progress
Up over 1st target longs want to trim in to 2nd target level. Oil Algorithm (EPIC). June 20 1141 AM FX $USOIL $WTI $USO $UWT $DWT $CL_F #OIL #Algorithm #OOTT

3rd target hit. Trade thesis complete for #EIA. Next levels to follow.

oil, trade, alerts, targets, complete
3rd target hit. Trade thesis complete for #EIA. Next levels to follow. Oil Algorithm (EPIC). June 20 1148 AM FX $USOIL $WTI $USO $UWT $DWT $CL_F #OIL #Algorithm #OOTT

Daytrading support and resistance fractals (white arrows key).

daytrade, oil, alert, guidance, chart
Daytrading support and resistance fractals (white arrows key) Oil Algorithm (EPIC). June 20 1209 PM FX $USOIL $WTI $USO $UWT $DWT $CL_F #OIL #Algorithm #OOTT

Recent Oil Algorithm Price Target Hits:

Sept 17 – Price Target Reporting will be updated soon.

Wed 1030 EIA report lower price target a perfect hit published on weekend report. Oil Algorithm (EPIC). FX $USOIL $WTI $USO $UWT $DWT $CL_F #OIL #Algorithm #OOTT

https://twitter.com/EPICtheAlgo/status/1024665109338222592

Wed 1030 EIA report lower price target a perfect hit published on weekend report.

Oil, algorithm, price, target, hit, EIA
Wed 1030 EIA report lower price target a perfect hit published on weekend report. Oil Algorithm (EPIC). FX $USOIL $WTI $USO $UWT $DWT $CL_F #OIL #Algorithm #OOTT

Tues 430 lower price target a perfect hit, as published on weekend report. Oil Algorithm (EPIC). FX $USOIL $WTI $USO $UWT $DWT $CL_F #OIL #Algorithm #OOTT

https://twitter.com/EPICtheAlgo/status/1024447086102827011

Tues 430 lower price target a perfect hit published on weekend report. Oil Algorithm (EPIC). FX $USOIL $WTI $USO $UWT $DWT $CL_F #OIL #Algorithm #OOTT

Oil, algorithm, price, target, hit
Tues 430 lower price target a perfect hit published on weekend report. Oil Algorithm (EPIC). FX $USOIL $WTI $USO $UWT $DWT $CL_F #OIL #Algorithm #OOTT

Oil Intra-Day Algo Trading Quadrants (white dotted lines):

Trading quadrants are simply support and resistance lines that can assist your intra-day trading – they are not alpha or primary support and resistance by any measure. Price action does however typically move more assertively when leaving a trading quadrant.

Indicator Methods:

As explained above, my algorithm is a consideration of up to fifty traditional indicators at any one time – each one given its own weight in accordance to its accuracy (win rate). This is how we establish the probability of specific targets hitting (we call them alpha algo targets).

Alpha Algo Targets, Algo Trend-lines, Algo Timing, Quadrants for Intra Snipes

Algo targets are the red circles – they correspond with important times each week in oil reporting land. Tuesday 4:30 PM, Wednesday 10:30 AM and Friday at 1:00 PM. The red dotted diagonal lines are the algo trend-lines. And the vertical dotted (red or green) are marking the important times each week. You will find that the price of crude will hit one of the alpha algo targets about 90% of the time. In the absence of market direction the machines take price to the next algo line and/or target. Understanding how the price of crude reacts to the algos and how they move price from target to target is critical for intra-day and swing trading crude oil and associated instruments.

You will notice that price action of crude will use these algo trend-lines and act as support and resistance, and that price also often violently moves when an alpha algo line is breached either upward or downward.

We cover this in much more detail in the member updates, trading room. A review of my Twitter feed and previous blog posts will help you understand the relation of these indicators. We will start posting video blogs (for my subscribers) on YouTube (in addition to my daily blog posts) for swing traders that work during regular trading hours.

Also… we will cover how to establish algo trend-lines and price targets future forward (as you have seen me do on my Twitter feed for some time now).

Conclusion:

See you in the live trade room! And again, if you struggle to know how to use these indicators as a trader’s edge, it is recommended (if you have earnestly reviewed all of our documentation first) that you obtain private coaching prior to trading a real account with real money – we recommend you use a paper trading account at first.

You can also send specific questions to our email inbox at [email protected] – if you do this be sure to ask a specific question so it can be answered specifically. When the 24 hour oil trading room opens you will have ample opportunity in that 24 hour room to ask questions also.

Watch my EPIC the Oil Algo Twitter feed for intra day notices and your email in box for member only material intra day also.

EPIC the Oil Algo

Subscribe to my Service here:

Standalone Crude Oil Algorithm Newsletter (member charting sent out weekly).

Real-Time Crude Oil Trading Alerts (Private Twitter feed).

Crude Oil Trading Room Bundle (includes weekly newsletter charting and real-time trading alerts on Twitter).

Commercial / Institutional Multi User License (for professional trading groups).

One-on-One Trade Coaching (Via Skype or in person).

Connect:

Register to free email list for trade set-ups, webinars, special events: https://compoundtrading.com/contact/

Website: https://compoundtrading.com

Blog: https://compoundtrading.com/blog/

Free chat room: https://discord.gg/2HRTk6n

Subscribe: https://compoundtrading.com/overview-…

Twitter: https://twitter.com/CompoundTrading

Lead Trader: https://twitter.com/curtmelonopoly

Tradingview: https://www.tradingview.com/u/curtmel…

Facebook: https://www.facebook.com/compoundtrad…

StockTwits: https://stocktwits.com/compoundtrading

Email: https://[email protected]

Curtis Melonopoly (@curtmelonopoly) is rated Top 250 Stock exchanges authority, covering also Mathematical finance and Economy of the United States

Tweets by EPICtheAlgo


Article topics: EPIC, Crude, Oil, Algorithm, Trade, Alerts, Trading Room, Chat, Charts, Signals, $USOIL, $WTI, $USO, $CL_F

Read More
Crude Oil Algorithm Trading Report (EPIC) w/ Gen 2 Machine Trade Tues Sept 11 FX: $USOIL $WTI $CL_F $USO #Oil #Trading #Algorithm

Crude Oil Algorithm Trading Report (EPIC) w/ Gen 2 Machine Trade Tues Sept 11 FX: $USOIL $WTI $CL_F $USO #Oil #Trading #Algorithm

September 11, 2018February 5, 2019 Epic the AlgoCrude Oil Trading Algorithm (EPIC)$CL_F, $UCO, $USO, $USOIL, $UWT, $WTI, Alerts, Algorithm, Chart, Crude, DWT, EPIC, Oil, Trading

Crude Oil Trading Algorithm Chart Report (EPIC) Tuesday September 11, 2018.

FX: $USOIL $WTI $USO $CL_F $UWT $DWT $UCO $SCO $ERX $ERY $GUSH $DRIP

Welcome to the oil trading algorithm report. My name is EPIC the Oil Algorithm and I am one of seven primary Algorithmic Chart Models in development at Compound Trading Group (there are over one hundred in total in development at various stages in various markets).

NOTICES:

New members to our oil algorithm charting model are encouraged to on-board in a way that equips you as an oil trader for consistent profit.

Visit my public Twitter feed EPIC Oil Algorithm Twitter (@EPICtheAlgo) and review tweets over the last few months, visit our blog and review the recent crude oil trading algorithm blog posts, our You Tube channel “how my oil algorithm works”, “how to use my charting”, weekly EIA oil report videos and our website explains how the oil algorithm was developed.

Invaluable are the crude oil trade alerts (available with or without the trading room / weekly report bundle) and the private member crude oil trading chat room on Discord (included in the bundle). The live alerts are important if you are not at your trading screens 24 hours a day and the chat room allows for interactive lead trader oil trade set-ups as each oil trade approaches.

Reviewing important points of reference and engaging the subscription resources will increase your probability of success considerably. This report also includes links to some recent example “how-to” videos.

Oil Trade Coaching – We strongly suggest users of this algorithmic crude oil trading strategy opt for some level of private one-on-one coaching with our lead trader. Our lead trader is currently maintaining a crude oil trading alert win-rate of over 90% (as of Sept 2, 2018 – time-stamped, live alert, recorded).

On our website one-on-one online coaching packages are made available (coaching via Skype) or you can request a custom package reflecting the time you wish to invest in learning. To request a custom package suited to your needs email [email protected] or click here for standard private trade coaching packages. Other options for coaching include online webinars, trade coaching bootcamps and private on location (in person) coaching sessions. 

Oil Trading Room – How to Use the Oil Algorithm

Oil Trading Room – How to Trade Intra-day with my Algorithmic Oil Charting

Oil Trading Alerts. Live Lead Trader Video Trading w EPIC Oil Algorithm

Recent articles from our blog about how to trade crude oil with our oil trading algorithm:

Oil Trade Alerts: How We Knew Where Oil Sell-Off Bottom Was in Advance. Crude Oil Trading Strategy.

Crude Oil Trading Face-Off Results “Pro Trader” (Man) vs. EPIC Oil Algorithm (Machine Trading Tech).

Oil Trading Alerts Live Video w EPIC Oil Algorithm #EIA Report.

“The Nut Hand” Today’s Huge Oil Trade Win. Exactly How It Was Done. How I Knew & How You Can Too.

MULTI-USERS: Institutional / commercial platform now available.

SOFTWARE: My algorithmic charting is now also in the coding phase for our trader’s dashboard program. Please review my algorithm development process, about my oil algorithm story on our website www.compoundtrading.com and my oil algo charting posts on my Twitter feed and/or this blog.

HOW MY ALGORITHM WORKS: I am an oil algorithm model in development. My math is based on traditional indicators (up to fifty at any given time each weighted on win ratio merit – all not shown on chart at any given time) – such as simple math calculations relating to price and volume, Fibonacci, simple pivots, moving averages, Gann, Schiff and various other charting, geometric and mathematical factors. I do not yet have AI integration – only math as it relates to traditional indicators with the primary goal being probabilities. I am not a high frequency robot type algorithm – I am presented on (and used on) a traditional trading chart as one would normally use as a probability indicator.

The goal is to provide oil traders with a signals edge when triggering entries and exits on trades with instruments that rely on the price of crude oil – first with the reporting format as below, then with machine trading functions and an integrated intelligent assisted traders platform that will provide the user with various settings of automation and personal trade execution.

In the weekly report below you will find simplified levels represented on conventional and algorithmic charting for intra-day (day-trading crude oil), swing trading and investing. You will also find below introduction of our Generation 2 machine trading models.

This work (and associated trading) should be considered one decision at a time, “if this happens then this or this are my targets”… price – trigger – trade and so on.oil related financial instruments.

Forward questions to [email protected], private message our lead trader on Twitter or in the private Discord oil trading room.

For further information this link explains how our algorithmic charting is done, this YouTube video explains in summary how my algorithm works https://www.youtube.com/watch?v=LUNyxFoXJp8 this link for more information about our algorithmic stock charting models and what makes them different than most.

EVERY CALL WE MAKE, EVERY PUBLIC INTERACTION, REPRESENTATION OF TRADE SIGNAL (ON EVERY VENUE) IS VIDEO RECORDED, ON SOCIAL MEDIA OR ON BLOG / WEBSITE TIME-STAMPED FOR PERMANENT RECORD AND TRANSPARENCY. PLEASE ALSO REFER TO OUR PUBLIC DISCLOSURE https://compoundtrading.com/disclosure-disclaimer/.

Oil Algorithm Observations:

Below is a link for the live algorithmic chart of EPIC the Crude Oil Trading Algorithm (Generation 1, Version 5 including black box modeling). The charting is a real-time trading chart represented on FX $USOIL $WTI published Sept 10, 2018.

A Generation 1, Version 6 model (with and without machine trading chart overlays) is currently also available. Per member request we will continue to post both Gen 1 and Gen 2 models (we had previously planned to discontinue including Gen 1 in weekly reporting).

Click on share button (bottom right beside flag) and when that screen opens click on “make it mine” to view real-time, make edits etc:

Crude Oil Trading Algorithm. Gen1.V5 (EPIC). Current crude oil trade. Sept 10 1150 PM FX $USOIL $WTI $USO $UWT $DWT $CL_F #Crude #OiL #Algorithm #OOTT

https://www.tradingview.com/chart/USOIL/X1cqCzTY-Crude-Oil-Trading-Algorithm-Gen1-V5-EPIC-Current-crude-oil-t/

Oil, Algorithm, CL_F, WTI, Crude
Crude Oil Trading Algorithm. Gen1.V5 (EPIC). Current crude oil trade. Sept 10 1150 PM FX $USOIL $WTI $USO $UWT $DWT $CL_F #Crude #OiL #Algorithm #OOTT

Sept 11, 2018

Generation 1 Model Oil Trading Signals

The first most predictable trade are the resistance and support cluster areas formed by long term chart trend lines (see charts that have trend-lines represented in red as made available below).

The second most predictable trade (wide trading range primary resistance and support that become predictable buy and sell triggers). Current algorithmic model wide trading range resistance (grey arrow – grey horizontal line) at approximately 68.93 in the current trading range. Current algorithmic model wide trading range support (grey arrow – grey horizontal line) at approximately 65.31 in the current trading range – these areas are general range support and resistance areas (our algorithm uses a .15 – .20 cent buffer on either side for these trades). Trading between the resistance / support horizontal grey lines is extremely profitable risk – reward if one is disciplined to the patience required and follows the trend of trade.

More recently (as of September 2018) our back-testing has shown that the support and resistance areas noted are used in trade as a decision pivot – in other words, the price tends to pivot around these decision points on the chart and coil over a period of time and then spring out of the coil in an upward or downward trend.

The lower trading range is 58.13 to 61.71 to 65.31. The upper trading range 61.71 to 65.31.

Third most predictable trade (support and resistance of uptrend or down trend channels). On the chart an upward trending trade channel is presented and a downward option (channel support and resistance / trading range is represented as diagonal dotted orange lines and purple arrows – as made available, assist in displaying directional trade decision areas).

Fourth most predictable trade (support and resistance of 30 min quadrants). The diagonal lines make up quadrants (in this instance on a 30 min chart) and are represented as orange diagonal lines that make up geometric diamond shapes. These lines also assist in intra-day trade.

Fifth most predictable trade (support and resistance of most applicable Fibonacci) the Fib support and resistance lines are the horizontal lines in various colors with the exception of purple and yellow (see below). These horizontal lines become support and resistance for intra-day trade.

Sixth most predictable trade (support and resistance of historical support and resistance) Natural / historical support and resistance lines shown in purple or yellow – they represent historical support and resistance. The strongest of the historical support and resistance lines are shown in yellow horizontal and are typically accompanied by a yellow arrow marker.

Seventh most predictable trade signal we use are the time and price targets (red circles). When trade is in a significant uptrend or downtrend the targets become very precise and move up the indicator priority list quick.

Tues, Wed and Fri targets are most predictable in extended multi week uptrends or downtrends. In recent time, trade could be described as range-bound under key resistance on weekly chart.

The Eighth most predictable trade is intra-day. You will notice on some of the charting geometric shapes in green on some of my charting (at times). They are charted live in the trading room and at times the lead trader will highlight these areas intra with white outlines (typically geometric shapes such as diamonds or triangles).

Intra-day Trading Bias

Intra day bias is up as the trading the last number of days has been in sell mode so a bounce should occur soon, however, the MACD is turned down on the daily chart and this indicator is usually a leading indicator for oil trade.

Wide Trading Range – Buy and Sell Triggers for Swing Trading Crude Oil:

Swing trading bias / forward guidance as of Sept 11, 2018 12;11 AM EST for the near term (two week swing trade) is bearish per the MACD on daily chart. However, a day bounce up to the wide resistance (gray line) is likely first. This is of course just a bias and trade of oil should be trump in decision making process.

Trade the ranges noted above between the thick grey lines (grey arrows) for the most predictable swing trades between 58.13 to 61.72, 61.72 to 65.32, 65.32 to 68.92, 68.93 to 72.54 and 72.54 to 76.15. This is a highly profitable risk-reward way to trade oil if you can be patient to trigger at only the break of the wide range charting areas and are disciplined to cut a losing trade that does not prove in your anticipated trend.

Or trade the range between the channel diagonal lines at support and resistance in up or down channel (orange dotted diagonals).

Significantly more advanced trading rules will be introduced over the coming weeks with the newer Generation 2 models per below in this report.

Crude Oil Trading Algorithm. Gen1.V5 (EPIC). Down trending channel scenario. Sept 11 1215 AM FX $USOIL $WTI $USO $UWT $DWT $CL_F #Crude #Oil #Algorithm #OOTT

  • Please note, there is also a parallel down channel scenario on the chart (not shown – it must be opened to view).
down trend, channel, oil, algroithm
Crude Oil Trading Algorithm. Gen1.V5 (EPIC). Down trending channel scenario. Sept 11 1215 AM FX $USOIL $WTI $USO $UWT $DWT $CL_F #Crude #Oil #Algorithm #OOTT

Crude Oil Trading Algorithm. Gen1.V5 (EPIC). Uptrending channel scenario. Sept 11 1214 AM FX $USOIL $WTI $USO $UWT $DWT $CL_F #Crude #Oil #Algorithm #OOTT

uptrend, channel, crude, oil, algorithm
Crude Oil Trading Algorithm. Gen1.V5 (EPIC). Uptrending channel scenario. Sept 11 1214 AM FX $USOIL $WTI $USO $UWT $DWT $CL_F #Crude #Oil #Algorithm #OOTT

Generation 2 Model Oil Trading Signals.

Crude Oil Trading Algorithm. Gen2.V1 (EPIC). Machine trading intra-day. Sept 11 1246 AM FX $USOIL $WTI $USO $UWT $DWT $CL_F #Crude #Oil #Algorithm #OOTT

https://www.tradingview.com/chart/USOIL/zBBnd8C8-Crude-Oil-Trading-Algorithm-Gen2-V1-EPIC-Machine-trading-int/

Crude, oil, algorithm, machine, trading
Crude Oil Trading Algorithm. Gen2.V1 (EPIC). Machine trading intra-day. Sept 11 1246 AM FX $USOIL $WTI $USO $UWT $DWT $CL_F #Crude #Oil #Algorithm #OOTT

Generation 1 Day-trading Crude Oil 1 Minute Chart Signals

During a squeeze trade spikes upward through the highlighted area and then rests and works its way through the next area and spikes through the next highlighted area. This does not occur in regular trade. More on this chart in our special reporting for oil trading over the coming days.

Crude Oil Day-Trading Chart Signals. 1 minute time frame. Sept 11 151 AM FX $USOIL $WTI $USO $UWT $DWT $CL_F #OIL #Chart

https://www.tradingview.com/chart/USOIL/SOTfqMf9-Crude-Oil-Day-Trading-Chart-Signals-1-minute-time-frame-Sept-1/

Crude, oil, day, trading, chart
Crude Oil Day-Trading Chart Signals. 1 minute time frame. Sept 11 151 AM FX $USOIL $WTI $USO $UWT $DWT $CL_F #OIL #Chart

Crude Oil Swing Trade Charting.

Monthly Oil Chart:

Crude Oil Monthly Chart. Near 200 MA, still trading generally between 200 MA and 100 MA on monthly. Sept 11 159 AM FX $USOIL $WTI $USO $UWT $DWT $CL_F #OIL #chart

https://www.tradingview.com/chart/USOIL/03XF1bEv-Crude-Oil-Monthly-Chart-Near-200-MA-still-trading-generally-be/

Crude, oil, monthly, chart
Crude Oil Monthly Chart. Near 200 MA, still trading generally between 200 MA and 100 MA on monthly. Sept 11 159 AM FX $USOIL $WTI $USO $UWT $DWT $CL_F #OIL #chart

In our never ending quest to find structure in crude oil trade, here is yet another to watch on the monthly chart.

https://www.tradingview.com/chart/USOIL/Aj7iz4hS-In-our-never-ending-quest-to-find-structure-in-crude-oil-trade/

Crude, oil, chart, monthly
In our never ending quest to find structure in crude oil trade, here is yet another to watch on the monthly chart.

Weekly Crude Oil Chart:

Last week’s sell-off in oil highlights the importance of time cycles and trader bias. Going in to Sept 10 the assumption was that trade would likely upside trade, it didn’t – at the time cycle peak it sold off.

Crude Oil Weekly chart wedge. One more wave up probable and failure at lower TL likely. Sept 11 217 AM FX $USOIL $WTI $USO $UWT $DWT $CL_F #OIL #chart

https://www.tradingview.com/chart/USOIL/8sh10VSe-Crude-Oil-Weekly-chart-wedge-One-more-wave-up-probable-and-fail/

Crude, oil, weekly, chart, wedge, pattern
Crude Oil Weekly chart wedge. One more wave up probable and failure at lower TL likely. Sept 11 217 AM FX $USOIL $WTI $USO $UWT $DWT $CL_F #OIL #chart

Per recent:

Below are three weekly chart scenarios.

Crude Oil Algorithm Simple Weekly Gen 1 Model has price at 72.11 Sept 10. Sept 2 1052 PM FX $USOIL $WTI $USO $UWT $DWT $CL_F #OIL #Algorithm #OOTT

https://www.tradingview.com/chart/USOIL/MLUSjRgB-Crude-Oil-Algorithm-Simple-Weekly-Gen-1-Model-has-price-at-72-11/

Weekly, oil, trading, algorithm
Crude Oil Algorithm Simple Weekly Gen 1 Model has price at 72.11 Sept 10. Sept 2 1052 PM FX $USOIL $WTI $USO $UWT $DWT $CL_F #OIL #Algorithm #OOTT

Sept 10 crude oil price target scenarios. Sept 2 1048 PM $USOI $WTI $CL_F Weekly #chart #oil

https://www.tradingview.com/chart/USOIL/qJPd2GCF-Sept-10-crude-oil-price-target-scenarios-Sept-2-1048-PM-USOI/

weekly, oil, price, targets
https://www.tradingview.com/chart/USOIL/qJPd2GCF-Sept-10-crude-oil-price-target-scenarios-Sept-2-1048-PM-USOI/

Crude Oil Weekly Chart Scenario III Sept 2 1043 PM FX $USOIL $WTI $USO $UWT $DWT $CL_F #OIL #Algorithm #OOTT

https://www.tradingview.com/chart/USOIL/EzqJ1NvT-Crude-Oil-Weekly-Chart-Scenario-III-Sept-2-1043-PM-FX-USOIL-WT/

Crude, oil, weekly, chart, scenario
Crude Oil Weekly Chart Scenario III Sept 2 1043 PM FX $USOIL $WTI $USO $UWT $DWT $CL_F #OIL #Algorithm #OOTT

May 21 – A feature post was published this week to review time cycles, retrace possibilities on the other side of time cycles on the weekly charts. Below is the post link:

Feature Post: 12 of Last 13 Oil Chart Time-Cycles Have Trend Reversal. $USOIL $WTI $CL_F $USO $UCO $UWT $DWT #OIL #OOTT

Daily Oil Chart:

Oil Daily Chart pivot still in play with MACD turned down, 50 MA above. Sept 11 221 AM FX $USOIL $WTI $USO $UWT $DWT $CL_F #OIL #chart

https://www.tradingview.com/chart/USOIL/nrAm9hcf-Oil-Daily-Chart-pivot-still-in-play-with-MACD-turned-down-50-MA/

crude, oil, daily, chart
https://www.tradingview.com/chart/USOIL/nrAm9hcf-Oil-Daily-Chart-pivot-still-in-play-with-MACD-turned-down-50-MA/

Diagonal Trend Lines:

Diagonal trend-lines are critical inflection points (currently represented in red below on our conventional charting).

Please review many of my recent posts so you can learn about how important these diagonal trend-lines are. If one is breached you can look to pull-back to next diagonal trend line about 90% of the time. Also pay attention to how thick the lines are – the thicker the line the more important because they represent extensions from previous time / price cycles.

Remember you can come in to the chat room to message the trader and REMEMBER I have posted a live chart link in this post so if you can’t see the lines well on this chart above you can go to the live chart link and watch for member live algo chart links through-out the day in your email inbox!

The diagonal trend-lines are marked on chart below:

Sept 11: Previous remains signal;

Oil Chart (Weekly). Oil trend lines on weekly time-frame. Aug 12 951 PM FX $USOIL $WTI $USO $UWT $DWT $CL_F #OIL

Significant probability oil hits 79.50 ish Dec 3, 2018 ish. But over that area unlikely unless there is a geo political event. Over 79.50 the shorts would get wrecked. Low 50s most probable by 2022. Early Dec 2018 is likely the highs. $USOIL $WTI $CL_F $USO #OOTT

https://www.tradingview.com/chart/USOIL/ouLad9xj-Crude-oil-weekly-trendline-chart-suggests-79-50-area-Dec-3-2018/

oil, trend lines, chart
Oil Chart (Weekly). Oil trend lines on weekly time-frame. Aug 12 951 PM FX $USOIL $WTI $USO $UWT $DWT $CL_F #OIL

Oil Chart (Weekly). Oil trend lines on weekly time-frame. Aug 7 605 AM FX $USOIL $WTI $USO $UWT $DWT $CL_F #OIL

https://www.tradingview.com/chart/USOIL/bS8T4ism-Oil-Chart-Weekly-Oil-trend-lines-on-weekly-time-frame-Aug-7/

Oil, trend line, chart
Oil Chart (Weekly). Oil trend lines on weekly time-frame. Aug 7 605 AM FX $USOIL $WTI $USO $UWT $DWT $CL_F #OIL

Previous posts for perspective;

Oil has now cleared every trendline resistance provided on conventional charting I’ve posted last year. $USOIL $WTI $CL_F #OOTT #OIL $USO $UWT $DWT 233 PM Jan 1

Oil, trendline, resistance, chart
Oil has now cleared every trendline resistance provided on conventional charting I’ve posted last year. $USOIL $WTI $CL_F #OOTT #OIL $USO $UWT $DWT 233 PM Jan 1
$USOIL, $WTI, Chart, Trendlines
Simple lines show expose clusters of resistance. Crude algo intra work sheet 201 AM Apr 10 FX $USOIL $WTIC #OIL $CL_F CL $USO $UCO $SCO $UWT $DWT #OOTT

Notice when the daily chart is opened, the simple lines extend to current day trade.

Daily chart view. Simple lines show expose clusters of resistance. Crude algo intra work sheet 213 AM Apr 10 FX $USOIL $WTIC #OIL $CL_F CL $USO $UCO $SCO $UWT $DWT #OOTT

Daily, $USOIL $WTI, Chart, Trendlines
Daily chart view. Simple lines show expose clusters of resistance. Crude algo intra work sheet 213 AM Apr 10 FX $USOIL $WTIC #OIL $CL_F CL $USO $UCO $SCO $UWT $DWT #OOTT

Fibonacci Levels:

Watch the lines for support and resistance. Careful using them as traditional retracement levels with crude because the algo lines etc are more dominant / predictable. But the Fib lines are excellent indicators for intra-day trade support and resistance.

The Fibonacci lines are marked on main chart above.

Horizontal Trend-Lines (purple):

Horizontal trend-lines are not as important as the other indicators reviewed above, however, they do serve as important resistance and support intra-day for tight trading and they are important if thick (in other words they come from previous time / price cycles). WE STARTED TO REPRESENT THE REALLY IMPORTANT LINES IN YELLOW FYI FOR EASE. Refer to chart for current applicable horizontal trend-lines.

Horizontal trend-lines are marked on charts above.

Oil Time / Price Cycles:

Watch your email and / or my Twitter feed for time price cycles they may start to terminate.

Time / price cycles are the single most important indicator and my record calling them is near 100% – since inception seven months ago. The reason they are so important is that a trader does not want to be holding a crude oil instrument at termination of a time cycle if not absolutely sure if price will go up or down. A trade may choose to enter a large position in advance of a time price cycle termination IF THERE IS A HIGH PROBABILITY OF A DIRECTION IN PRICE and if the market is trading at a really important pivot area. In other words, if the market is trading at the bottom of the upward trending channel at a support (yellow lines) and we knew there was a significant probability of a time cycle about to terminate a trader may enter with a long position. The price really spikes or drops significantly when these important time cycles terminate.

The problem with time / price cycle terminations is they change from minute to minute (depending on where price is on the chart) so you have to be in the trade room to get the alert. Our lead traders will do everything they can in future to send these on SMS but we have to be careful because it can be difficult with so much going on in the room. The reason they (time cycles) change is because they are actually represented by or are geometric shapes in the chart – I know it sounds odd but I have (as I mentioned) hit these calls just shy of 100%. The oil political people know the same algorithmic modeling principles and they ALWAYS TIME THEIR BIG ANNOUNCEMENTS AROUND THE TIME PRICE CYCLE TERMINATIONS.

So if you can picture a triangle on the chart – and price is trading in the triangle – and price is going to come to the edge of the triangle and there is a significant support or resistance or an algo line terminating there too or a target (those type of indications)… then we know there is a high probability of a time and price change. In other words, it is where there are clusters of algorithm points that cross and when price is going to cross over that cluster is where they are. And these are represented on all the different time frames – the larger the time frame – the larger the time price cycle termination – the larger the spike or downdraft. This is where we establish our intra-day quadrants from for sniping trades (which we will put in to the room soon because it looks like the geo political rhetoric is over for a while making them more predictable). Difficult to explain in short. So we will do our best to SMS alert these in future.

Also, the real large or important time / price cycle terminations we know far in advance and they can be put in these newsletters.

If you review my Epic the Oil Algo Twitter feed, my blog posts and my story on our website you will get a feel for how accurate these calls are.

Alpha Algo Trading Trend-Lines (Primary – Red dotted lines. Secondary – White dotted lines):

To determine which algo line is most alpha (or probable) intra day, it is the nearest line to price action. This can also help you determine the trend of trade. If the algo line is trending up the price will follow it up until price is tested at an algorithm indicator (the main tests are diagonal trendlines, horizontal trendlines, time / price cycles etc – as I have shared with you). This is why it is important to watch all the lines because they are all support and resistance. To keep it simple trade the range (yellow lines) as I’ve mentioned but keep an eye on these indicators.

Current Alpha Algo Targets (Red circles):

Your closest target that crude is trending toward is always the most probable.Then, your second most probable is the one that is up or down trend depending on whether general price is in an upward or downtrend for the most recent week or so and what your other indicators look like (such as the MA’s I explained above).

The other way to determine which targets are in play is actually quite simple, you will notice that crude trades between the channel lines up and down and up and down and there are various support and resistance along the way. If it hits a target at the top of the channel you can bet most times (unless the next day like today) that the next target hit will be at the bottom of the channel.

Wait for the price to trend toward a target and take your position and watch as price gets closer and closer to the target. Remember, that the machines trade from decision to decision – or in other words from support to next resistance or resistance to next support or when the times come each week on Tuesday Wednesday and Friday they will trend toward the target that market price action determines they go to.

Our lead trader will explain more in the room and do not hesitate to ask our lead trader in the room by private message or on twitter to explain intra day decisions.

Recent Live Crude Oil Trade Alerts (samples):

Sept 11 – Recent trade alerts will be updated soon.

Aug 12 2018 – Recent trades are found in this recent report:

Crude Oil Trading Face-Off Results “Pro Trader” (Man) vs. EPIC Oil Algorithm (Machine Trading Tech)

Click on feature post for recent crude oil trading alerts blog post; Oil Trading Alerts Live Video w EPIC Oil Algorithm #EIA Report #Oil #Trading #Algorithm #Alerts $USOIL $WTI $CL_F

Oil trade alert to start the week 68.61 long, 68.85 closed. Win rate high 90% – ask for a tour. Time stamped, recorded, live alerts. 

https://twitter.com/EPICtheAlgo/status/1026287786113081344

Oil trade alert to start the week 68.61 long, 68.85 closed. 

oil, trading, alert
Oil trade alert to start the week 68.61 long, 68.85 closed. EPIC Oil Algorithm $USOIL $WTI $CL_F #OilTradeAlerts $UWT $DWT

Oil trade alert to start the week 68.61 long, 68.85 closed (Part 2). 

Crude, oil, trade alert, PT2
Oil trade alert to start the week 68.61 long, 68.85 closed (Part 2). EPIC Oil Algorithm $USOIL $WTI $CL_F #OilTradeAlerts $UWT $DWT

Machine trading 🙂 

Machine trading 🙂 $USOIL $WTI $CL_F #OIL #Algorithmic #trading #alerts pic.twitter.com/Hja5Tbgmob

— Melonopoly (@curtmelonopoly) August 3, 2018

A scalp to start the day. Multi-month winning streak continues. Ask for a tour of the feed if you need proof. 

A scalp to start the day. Multi-month winning streak continues. Ask for a tour of the feed if you need proof. EPIC Oil Algorithm FX $USOIL $WTI #CL $USO $UWT $DWT #OOTT #Oil #trading #algorithm pic.twitter.com/JTHCMp58Cv

— Melonopoly (@curtmelonopoly) July 27, 2018

100% personal alerted oil trade win rate documented, recorded, alerted real time to feed continues for months (we did have one loss alert by a tech a few weeks back). 

100% personal alerted oil trade win rate documented, recorded, alerted real time to feed continues for months (we did have one loss alert by a tech a few weeks back). EPIC the Oil Algorithm FX $USOIL $WTI $USO $UWT $DWT #OIl #OOTT #Trading @EPICtheAlgo pic.twitter.com/pKL1iKE5T1

— Melonopoly (@curtmelonopoly) July 25, 2018

Live oil trade alert. Long 69.06 US OIL WTI 1 5th sizing EPIC Oil Algorithm.

oil, trade, alerts, WTI
Live oil trade alert. Long 69.06 US OIL WTI 1 5th sizing EPIC Oil Algorithm $USOIL $WTI #OIL #OOTT $UWT $DWT $USO

Live oil trade alert. Trim 50 percent 69.30. EPIC Oil Algorithm.

oil, trading, alerts, crude
Live oil trade alert. Trim 50 percent 69.30. EPIC Oil Algorithm $USOIL $WTI #OIL #OOTT $UWT $DWT $USO #trading #alerts

Live oil trade alert. Long 68.93 add 50 percent. EPIC Oil Algorithm. 

oil, trading, alert, long
Live oil trade alert. Long 68.93 add 50 percent. EPIC Oil Algorithm $USOIL $WTI #OIL #OOTT $UWT $DWT $USO #trading #alerts

Live oil trade alert. Trim other 50 percent 69.26 50 percent.

Live, oil, trade, alert, trim
Live oil trade alert. Trim other 50 percent 69.26 50 percent. EPIC Oil Algorithm $USOIL $WTI #OIL #OOTT $UWT $DWT $USO #trading #alerts

Overnight oil trade: short 72.79 add 72.71 cover 72.27s-72.35s. Not cleanest trade but HUGE win. 100% win rate continues (for months). Guidance detail in oil trading room (to expect heat). Live alerts, time stamped, recorded.

https://twitter.com/EPICtheAlgo/status/1015202909041102849

Overnight oil trade short 72.79 add 72.71 cover 72.27s to 72.35s. Not cleanest trade but HUGE win. 100% win rate continues 

Oil, trade, alert, short
Overnight oil trade short 72.79 add 72.71 cover 72.27s to 72.35s. Not cleanest trade but HUGE win. 100% win rate continues $USOIL $WTI $USO #OIL #Trading #Alerts

Member guidance in oil chat room this morning “i’ll be selling spikes in to resistance until it doesn’t work – the larger more obvious i’ll alert against downtrend upper channel orange dotted etc” 

https://twitter.com/EPICtheAlgo/status/1014943645974323204

Member guidance this morning i’ll be selling spikes in to resistance until it doesn’t work 

Oil, chat, trading, room, guidance
Member guidance this morning i’ll be selling spikes in to resistance until it doesn’t work $USOIL $WTI $USO $UWT $DWT EPIC Oil Algorithm #oil #trading #alerts

Scalp day. 100 percent win rate for months continues. Time stamped, live alerted, recorded. 

https://twitter.com/EPICtheAlgo/status/1014938308961595393

100 percent win rate for months continues. Time stamped, live alerted, recorded. 

oil, trade, alerts, winning, rate, ,best
100 percent win rate for months continues. Time stamped, live alerted, recorded. $USOIL $WTI $USO $UWT $DWT EPIC Oil Algorithm #oil #trading #alerts

Oil trading chat room member guidance and intra day daytrading charting example ‘70.02 would be the swing retrace. So the thesis is sound but you may have pain before potential drop”.

oil, trading, chat, room, guidance
70.02 would be the swing retrace. So the thesis is sound but you may have pain before potential drop.

Oil trading chat room member guidance and intra day daytrading charting example “Target is in 70.70 area so I will likely give this lots of room swing if I have to. We’ll see”.

oil, trade, alert, price, targets
Target is in 70.70 area so I will likely give this lots of room swing if I have to. We’ll see. FX $USOIL $WTI #OilTrading

Oil trading chat room member guidance and intra day daytrading charting example “Machines defending the retrace intra day”.

oil, machine, trading, WTI
Machines defending the retrace intra day FX $USOIL $WTI #OIL #Algorithm

Trims / close longs 71.39 to 71.71 oil trade alert. 

https://twitter.com/EPICtheAlgo/status/1011981290051129346

Long 71.21 oil trade alert with the one add. 

https://twitter.com/EPICtheAlgo/status/1011980052198719488

Today’s #EIA oil trade with Oil Algorithm (EPIC) Live alert entries (green) exits (red).

https://twitter.com/EPICtheAlgo/status/1011977209442177026

Screen shot member oil chat room first oil trade alert of day – Long 71.21 hoping we squeeze in to EIA

EIA, oil, trading, chat, room
Screen shot member oil chat room first oil trade alert of day – Long 71.21 hoping we squeeze in to EIA

One minute algorithmic on the fly chart trade came off after initial long side oil trade alert- see green arrow. 

oil, trade, alert, chart, trades
One minute algorithmic on the fly chart trade came off after initial long side oil trade alert- see green arrow. #oiltradealert #oil

Screen shot of alert to trim half at 71.39 place stop 71.26 on remaining half and resistance guidance. 

oil, trade, alert, trim, position
Screen shot of alert to trim half at 71.39 place stop 71.26 on remaining half and resistance guidance. #oil #trading #chat

Oil chat room screen shot of next trade alert to trim long at 71.52 25 percent and hold 25 percent.

oil, trading, alert, chat, room
Oil chat room screen shot of next trade alert to trim long at 71.52 25 percent and hold 25 percent.

Final crude oil trade alert to close final 12.5 percent at 71.74 and hold 0 percent at chart resistance.

oil, crude, oil, trading, alert
Final crude oil trade alert to close final 12.5 percent at 71.74 and hold 0 percent at chart resistance.

And then the post EIA 1030 Wed trade alert with trading plan price targets were posted – usually wait 2nd 5 min candle

oil, trade, alerts, EIA, report
And then the post EIA 1030 Wed trade alert with trading plan price targets were posted – usually wait 2nd 5 min candle

And then this happened, oil shot up right through the price targets from the alert.

oi, trade, alert, price, targets, reached
And then this happened, oil shot up right through the price targets from the alert.

Winning streak continues. 100% live oil trade alert win rate for many weeks now. Time stamped real time. 

https://twitter.com/EPICtheAlgo/status/1010004212950843392

EPIC Oil Algorithm trade alert wins continue for many weeks now. Time stamped real time. 

oil, trade, alerts, winning, streak
EPIC Oil Algorithm trade alert wins continue for many weeks now. Time stamped real time. FX $USOIL $WTI $CL_F $USO #OIL #OOTT #Oiltradealerts #algorithm

Boom “3rd target hit. Trade thesis complete for #EIA. Next levels to follow. 

Boom "3rd target hit. Trade thesis complete for #EIA. Next levels to follow. Oil Algorithm (EPIC). June 20 1148 AM FX $USOIL $WTI $USO $UWT $DWT $CL_F #OIL #Algorithm #OOTT " pic.twitter.com/WAl4N9n2yH

— Melonopoly (@curtmelonopoly) June 20, 2018

First 3 targets intra if long side trade alert holds. Trim in add above or on pull back and turns up.

oil, trading, plan, chart, price, targets
First 3 targets intra if long side trade alert holds. Trim in add above or on pull back and turns up. Oil Algorithm (EPIC). June 20 1046 AM FX $USOIL $WTI $USO $UWT $DWT $CL_F #OIL #Algorithm #OOTT

Trade is using our 50% retrace on daytrade coding level intra as pivot.

oil, trade, alert, member, guidance, charting
Trade is using our 50% retrace on daytrade coding level intra as pivot Oil Algorithm (EPIC). June 20 1058 AM FX $USOIL $WTI $USO $UWT $DWT $CL_F #OIL #Algorithm #OOTT

Close up of intra day trading battle.

oil, trading, plan, chart, alert
Close up of intra day trading battle #daytrading Oil Algorithm (EPIC). June 20 1105 AM FX $USOIL $WTI $USO $UWT $DWT $CL_F #OIL #Algorithm #OOTT

1st of 3 targets hit. Curt didn’t get it but coding team did.

oil, algorithm, trading, alert
1st of 3 targets hit. Curt didn’t get it but coding team did. Oil Algorithm (EPIC). June 20 1121 AM FX $USOIL $WTI $USO $UWT $DWT $CL_F #OIL #Algorithm #OOTT

Up over 1st target longs want to trim in to 2nd target level.

live, oil, trade, in progress
Up over 1st target longs want to trim in to 2nd target level. Oil Algorithm (EPIC). June 20 1141 AM FX $USOIL $WTI $USO $UWT $DWT $CL_F #OIL #Algorithm #OOTT

3rd target hit. Trade thesis complete for #EIA. Next levels to follow.

oil, trade, alerts, targets, complete
3rd target hit. Trade thesis complete for #EIA. Next levels to follow. Oil Algorithm (EPIC). June 20 1148 AM FX $USOIL $WTI $USO $UWT $DWT $CL_F #OIL #Algorithm #OOTT

Daytrading support and resistance fractals (white arrows key).

daytrade, oil, alert, guidance, chart
Daytrading support and resistance fractals (white arrows key) Oil Algorithm (EPIC). June 20 1209 PM FX $USOIL $WTI $USO $UWT $DWT $CL_F #OIL #Algorithm #OOTT

Recent Oil Algorithm Price Target Hits:

Sept 11 – Price Target Reporting will be updated soon.

Wed 1030 EIA report lower price target a perfect hit published on weekend report. Oil Algorithm (EPIC). FX $USOIL $WTI $USO $UWT $DWT $CL_F #OIL #Algorithm #OOTT

https://twitter.com/EPICtheAlgo/status/1024665109338222592

Wed 1030 EIA report lower price target a perfect hit published on weekend report.

Oil, algorithm, price, target, hit, EIA
Wed 1030 EIA report lower price target a perfect hit published on weekend report. Oil Algorithm (EPIC). FX $USOIL $WTI $USO $UWT $DWT $CL_F #OIL #Algorithm #OOTT

Tues 430 lower price target a perfect hit, as published on weekend report. Oil Algorithm (EPIC). FX $USOIL $WTI $USO $UWT $DWT $CL_F #OIL #Algorithm #OOTT

https://twitter.com/EPICtheAlgo/status/1024447086102827011

Tues 430 lower price target a perfect hit published on weekend report. Oil Algorithm (EPIC). FX $USOIL $WTI $USO $UWT $DWT $CL_F #OIL #Algorithm #OOTT

Oil, algorithm, price, target, hit
Tues 430 lower price target a perfect hit published on weekend report. Oil Algorithm (EPIC). FX $USOIL $WTI $USO $UWT $DWT $CL_F #OIL #Algorithm #OOTT

Oil Intra-Day Algo Trading Quadrants (white dotted lines):

Trading quadrants are simply support and resistance lines that can assist your intra-day trading – they are not alpha or primary support and resistance by any measure. Price action does however typically move more assertively when leaving a trading quadrant.

Indicator Methods:

As explained above, my algorithm is a consideration of up to fifty traditional indicators at any one time – each one given its own weight in accordance to its accuracy (win rate). This is how we establish the probability of specific targets hitting (we call them alpha algo targets).

Alpha Algo Targets, Algo Trend-lines, Algo Timing, Quadrants for Intra Snipes

Algo targets are the red circles – they correspond with important times each week in oil reporting land. Tuesday 4:30 PM, Wednesday 10:30 AM and Friday at 1:00 PM. The red dotted diagonal lines are the algo trend-lines. And the vertical dotted (red or green) are marking the important times each week. You will find that the price of crude will hit one of the alpha algo targets about 90% of the time. In the absence of market direction the machines take price to the next algo line and/or target. Understanding how the price of crude reacts to the algos and how they move price from target to target is critical for intra-day and swing trading crude oil and associated instruments.

You will notice that price action of crude will use these algo trend-lines and act as support and resistance, and that price also often violently moves when an alpha algo line is breached either upward or downward.

We cover this in much more detail in the member updates, trading room. A review of my Twitter feed and previous blog posts will help you understand the relation of these indicators. We will start posting video blogs (for my subscribers) on YouTube (in addition to my daily blog posts) for swing traders that work during regular trading hours.

Also… we will cover how to establish algo trend-lines and price targets future forward (as you have seen me do on my Twitter feed for some time now).

Conclusion:

See you in the live trade room! And again, if you struggle to know how to use these indicators as a trader’s edge, it is recommended (if you have earnestly reviewed all of our documentation first) that you obtain private coaching prior to trading a real account with real money – we recommend you use a paper trading account at first.

You can also send specific questions to our email inbox at [email protected] – if you do this be sure to ask a specific question so it can be answered specifically. When the 24 hour oil trading room opens you will have ample opportunity in that 24 hour room to ask questions also.

Watch my EPIC the Oil Algo Twitter feed for intra day notices and your email in box for member only material intra day also.

EPIC the Oil Algo

Subscribe to my Service here:

Standalone Oil Algorithm Newsletter (member charting sent out weekly).

Real-Time Oil Trading Alerts (Private Twitter feed).

Oil Trading Room Bundle (includes weekly newsletter charting and real-time trading alerts on Twitter).

Commercial / Institutional Multi User License (for professional trading groups).

One-on-One Trade Coaching (Via Skype or in person).

Connect:

Register to free email list for trade set-ups, webinars, special events: https://compoundtrading.com/contact/

Website: https://compoundtrading.com

Blog: https://compoundtrading.com/blog/

Free chat room: https://discord.gg/2HRTk6n

Subscribe: https://compoundtrading.com/overview-…

Twitter: https://twitter.com/CompoundTrading

Lead Trader: https://twitter.com/curtmelonopoly

Tradingview: https://www.tradingview.com/u/curtmel…

Facebook: https://www.facebook.com/compoundtrad…

StockTwits: https://stocktwits.com/compoundtrading

Email: https://[email protected]

Curtis Melonopoly (@curtmelonopoly) is rated Top 250 Stock exchanges authority, covering also Mathematical finance and Economy of the United States

Tweets by EPICtheAlgo


Article topics: EPIC, Oil, Algorithm, Trading, Alerts, Crude, $USOIL, $WTI, $USO, $UCO, $CL_F, $UWT, $DWT, Chart


Read More
Crude Oil Algorithm Trading Report (EPIC) w/ Gen 2 Machine Trade Integration Sun Sept 2 FX: $USOIL $WTI $CL_F $USO #Oil #Trading #Algorithm

Crude Oil Algorithm Trading Report (EPIC) w/ Gen 2 Machine Trade Integration Sun Sept 2 FX: $USOIL $WTI $CL_F $USO #Oil #Trading #Algorithm

September 2, 2018January 12, 2019 Epic the AlgoCrude Oil Trading Algorithm (EPIC)$CL_F, $UCO, $USO, $USOIL, $UWT, $WTI, Alerts, Algorithm, Chart, Crude, DWT, EPIC, Oil, Trading

Crude Oil Trading Algorithm Chart Report (EPIC) Sunday September 2, 2018.

FX: $USOIL $WTI $USO $CL_F $UWT $DWT $UCO $SCO $ERX $ERY $GUSH $DRIP

Welcome to the oil trading algorithm report. My name is EPIC the Oil Algorithm and I am one of seven primary Algorithmic Chart Models in development at Compound Trading Group (there are over one hundred in total in development at various stages for various markets).

NOTICES:

New members to our oil algorithm charting model are encouraged to on-board in a way that equips you as an oil trader for consistent profit.

Visit my public Twitter feed EPIC Oil Algorithm Twitter (@EPICtheAlgo) and review tweets over the last few months, visit our blog and review the recent crude oil trading algorithm blog posts, our You Tube channel “how my oil algorithm works”, “how to use my charting”, weekly EIA oil report videos and our website explains how the oil algorithm was developed.

Invaluable are the crude oil trade alerts (available with or without the trading room / weekly report bundle) and the private member crude oil trading chat room on Discord (included in the bundle). The live alerts are important if you are not at your trading screens 24 hours a day and the chat room allows for interactive lead trader oil trade set-ups as each oil trade approaches.

Reviewing important points of reference and engaging the subscription resources will increase your probability of success considerably. This report also includes links to some recent example “how-to” videos.

Oil Trade Coaching – We strongly suggest users of this algorithmic crude oil trading strategy opt for some level of private one-on-one coaching with our lead trader. Our lead trader is currently maintaining a crude oil trading alert win-rate of over 90% (as of Sept 2, 2018 – time-stamped, live alert, recorded).

On our website standard one-on-one online coaching packages are made available (coaching via Skype) or you can request a customized package (reflecting the time you wish to invest in learning). To request a custom package suited to your needs email [email protected] or click here for standard private trade coaching packages. Other options for coaching include online webinars, trade coaching bootcamps and private on location (in person) coaching sessions. 

Oil Trading Room – How to Use the Oil Algorithm

Oil Trading Room – How to Trade Intra-day with my Algorithmic Oil Charting

Oil Trading Alerts. Live Lead Trader Video Trading w EPIC Oil Algorithm

Recent articles from our blog about how to trade crude oil with our oil trading algorithm:

Oil Trade Alerts: How We Knew Where Oil Sell-Off Bottom Was in Advance. Crude Oil Trading Strategy.

Crude Oil Trading Face-Off Results “Pro Trader” (Man) vs. EPIC Oil Algorithm (Machine Trading Tech).

Oil Trading Alerts Live Video w EPIC Oil Algorithm #EIA Report.

“The Nut Hand” Today’s Huge Oil Trade Win. Exactly How It Was Done. How I Knew & How You Can Too.

MULTI-USERS: Institutional / commercial platform now available.

SOFTWARE: My algorithmic charting is now also in the coding phase for our trader’s dashboard program. Please review my algorithm development process, about my oil algorithm story on our website www.compoundtrading.com and my oil algo charting posts on my Twitter feed and/or this blog.

HOW MY ALGORITHM WORKS: I am an oil algorithm model in development. My math is based on traditional indicators (up to fifty at any given time each weighted on win ratio merit – all not shown on chart at any given time) – such as simple math calculations relating to price and volume, Fibonacci, simple pivots, moving averages, Gann, Schiff and various other charting, geometric and mathematical factors. I do not yet have AI integration – only math as it relates to traditional indicators with the primary goal being probabilities. I am not a high frequency robot type algorithm – I am presented on (and used on) a traditional trading chart as one would normally use as a probability indicator.

The goal is to provide oil traders with a signals edge when triggering entries and exits on trades with instruments that rely on the price of crude oil – first with the reporting format as below, then with machine trading functions and an integrated intelligent assisted traders platform that will provide the user with various settings of automation and personal trade execution.

In the weekly report below you will find simplified levels represented on conventional and algorithmic charting for intra-day (day-trading crude oil), swing trading and investing. You will also find the introduction of our Generation 2 machine trading models.

This work (and associated trading) should be considered one decision at a time, “if this happens then this or this are my targets”… price – trigger – trade and so on.oil related financial instruments.

Forward questions to [email protected], private message our lead trader on Twitter or in the private Discord oil trading room.

For further information this link explains how our algorithmic charting is done, this YouTube video explains in summary how my algorithm works https://www.youtube.com/watch?v=LUNyxFoXJp8 this link for more information about our algorithmic stock charting models and what makes them different than most.

EVERY CALL WE MAKE, EVERY PUBLIC INTERACTION, REPRESENTATION OF TRADE SIGNAL (ON EVERY VENUE) IS VIDEO RECORDED, ON SOCIAL MEDIA OR ON BLOG / WEBSITE TIME-STAMPED FOR PERMANENT RECORD AND TRANSPARENCY. PLEASE ALSO REFER TO OUR PUBLIC DISCLOSURE https://compoundtrading.com/disclosure-disclaimer/.

Oil Algorithm Observations:

Below is a link for the live algorithmic chart of EPIC the Crude Oil Trading Algorithm (Generation 1, Version 5 including black box modeling). The charting is a real-time trading chart represented on FX $USOIL $WTI published Sept 2, 2018.

A Generation 1, Version 6 model (with and without machine trading chart overlays) is currently being tested and is expected to replace Generation 1 models in the near term. The model below is expected to be the last revision of the Generation 1 models as the Generation 2 Models are now released and in use (see below Generation 2, Version 1 with Black Box).

Click on share button (bottom right beside flag) and when that screen opens click on “make it mine” to view real-time, make edits etc:

https://www.tradingview.com/chart/USOIL/X1cqCzTY-Crude-Oil-Trading-Algorithm-Gen1-V5-EPIC-Current-crude-oil-t/

Crude Oil Trading Algorithm. Gen1.V5 (EPIC). Current crude oil trade. Sept 2 704 PM FX $USOIL $WTI $USO $UWT $DWT $CL_F #Crude #OiL #Algorithm #OOTT

Crude, oil, trading, algorithm
Crude Oil Trading Algorithm. Gen1.V5 (EPIC). Current crude oil trade. Sept 2 704 PM FX $USOIL $WTI $USO $UWT $DWT $CL_F #Crude #OiL #Algorithm #OOTT

Sept 2, 2018

Generation 1 Model Oil Trading Signals

The first most predictable trade are the resistance and support cluster areas formed by long term chart trend lines (see charts that have trend-lines represented in red as made available below).

The second most predictable trade (wide trading range primary resistance and support that become predictable buy and sell triggers). Current algorithmic model wide trading range resistance (grey arrow – grey horizontal line) at approximately 72.54 in the current trading range. Current algorithmic model wide trading range support (grey arrow – grey horizontal line) at approximately 68.93 in the current trading range – these areas are general range support and resistance areas (our algorithm uses a .15 – .20 cent buffer on either side for these trades). Trading between the resistance / support horizontal grey lines is extremely profitable risk – reward if one is disciplined to the patience required and follows the trend of trade.

The lower trading range is 61.71 to 65.31. The upper trading range 68.93 to 72.54.

Third most predictable trade (support and resistance of uptrend or down trend channels). On the chart an upward trending trade channel is presented and a downward option (channel support and resistance / trading range is represented as diagonal dotted orange lines and purple arrows – as made available, assist in displaying directional trade decision areas).

Fourth most predictable trade (support and resistance of 30 min quadrants). The diagonal lines make up quadrants (in this instance on a 30 min chart) and are represented as orange diagonal lines that make up geometric diamond shapes. These lines also assist in intra-day trade.

Fifth most predictable trade (support and resistance of most applicable Fibonacci) the Fib support and resistance lines are the horizontal lines in various colors with the exception of purple and yellow (see below). These horizontal lines become support and resistance for intra-day trade.

Sixth most predictable trade (support and resistance of historical support and resistance) Natural / historical support and resistance lines shown in purple or yellow – they represent historical support and resistance. The strongest of the historical support and resistance lines are shown in yellow horizontal and are typically accompanied by a yellow arrow marker.

Seventh most predictable trade signal we use are the time and price targets (red circles). When trade is in a significant uptrend or downtrend the targets become very precise and move up the indicator priority list quick.

Tues, Wed and Fri targets are most predictable in extended multi week uptrends or downtrends. In recent time, trade could be described as range-bound under key resistance on weekly chart.

The Eighth most predictable trade is intra-day. You will notice on some of the charting geometric shapes in green on some of my charting (at times). They are charted live in the trading room and at times the lead trader will highlight these areas intra with white outlines (typically geometric shapes such as diamonds or triangles).

Intra-day Trading Bias

Intra day bias is indecisive as trade is in the “cradle” area of the quadrant. A decision has to be made for trade to continue in the up channel on the charting or turn to the down channel scenario.

Wide Trading Range – Buy and Sell Triggers for Swing Trading Crude Oil:

Swing trading bias / forward guidance as of Sept 2, 2018 8:06 PM EST for the near term (two week swing trade) is bullish per the previous report;

“above 65.00 (trading 68.56) if price can break upside of 50 MA and hold it and/or tests 65.30 area support on algorithmic model and holds. Price bounced off 200 MA daily chart support with MACD currently turned up. Probability is upward pressure on shorts.”

Trade the ranges noted above between the thick grey lines (grey arrows) for the most predictable swing trades between 58.13 to 61.72, 61.72 to 65.32, 65.32 to 68.92, 68.93 to 72.54 and 72.54 to 76.15. This is a highly profitable risk-reward way to trade oil if you can be patient to trigger at only the break of the wide range charting areas and are disciplined to cut a losing trade that does not prove in your anticipated trend.

Or trade the range between the channel diagonal lines at support and resistance in up or down channel (orange dotted diagonals).

Significantly more advanced trading rules will be introduced over the coming weeks with the newer Generation 2 models per below in this report.

Crude Oil Trading Algorithm. Gen1.V5 (EPIC). Uptrending channel scenario. Sept 2 809 PM FX $USOIL $WTI $USO $UWT $DWT $CL_F #Crude #Oil #Algorithm #OOTT

At the time of this report oil trade has to make a decision for up channel or down channel. Because of where trade is it is possible that it trends up channel at a parallel channel one channel lower as notes on the charting below with yellow arrows. If the lower up channel scenario transpires in trade then the red targets in the upper up channel would be void and simply moved to the up channel below.

Crude, oil, algorithm, up trend, channel
Crude Oil Trading Algorithm. Gen1.V5 (EPIC). Uptrending channel scenario. Sept 2 809 PM FX $USOIL $WTI $USO $UWT $DWT $CL_F #Crude #Oil #Algorithm #OOTT

The same dual scenarios (as above) are also possible for the lower trading channel at this juncture within intra-day trade. 

Crude Oil Trading Algorithm. Gen1.V5 (EPIC). Uptrending channel scenarios. Sept 2 814 PM FX $USOIL $WTI $USO $UWT $DWT $CL_F #Crude #Oil #Algorithm #OOTT

Crude, oil, trading, algorithm, down, channel
Crude Oil Trading Algorithm. Gen1.V5 (EPIC). Uptrending channel scenarios. Sept 2 814 PM FX $USOIL $WTI $USO $UWT $DWT $CL_F #Crude #Oil #Algorithm #OOTT

Generation 2 Model Oil Trading SignalsCrude Oil Trading Algorithm. Gen2.V1 (EPIC). Machine trading intra-day. Sept 2 1004 PM FX $USOIL $WTI $USO $UWT $DWT $CL_F #Crude #Oil #Algorithm #OOTT

You will find the symmetry in the oil machine trading chart overlay to not always be consistent with the Generation 1 models. We are currently testing market data feed information to assess noted divergence. 

https://www.tradingview.com/chart/USOIL/Rrxnkzx7-Crude-Oil-Trading-Algorithm-Gen2-V1-EPIC-Machine-trading-int/

Crude, oil, trading, algorithm, daytrading, machine, model
Crude Oil Trading Algorithm. Gen2.V1 (EPIC). Machine trading intra-day. Sept 2 1004 PM FX $USOIL $WTI $USO $UWT $DWT $CL_F #Crude #Oil #Algorithm #OOTT

Generation 1 Day-trading Oil 1 Minute Chart Signals

During a squeeze trade spikes upward through the highlighted area and then rests and works its way through the next area and spikes through the next highlighted area. This does not occur in regular trade. More on this chart in our special reporting for oil trading over the coming days.

Crude Oil Day-Trading Chart Signals. 1 minute time frame. Sept 2 1028 PM PM FX $USOIL $WTI $USO $UWT $DWT $CL_F #OIL #Chart

https://www.tradingview.com/chart/USOIL/IvwJJoHl-Crude-Oil-Day-Trading-Chart-Signals-1-minute-time-frame-Sept-2/

crude, oil, daytrading, chart, signals
Crude Oil Day-Trading Chart Signals. 1 minute time frame. Sept 2 1028 PM PM FX $USOIL $WTI $USO $UWT $DWT $CL_F #OIL #Chart

Crude Oil Swing Trade Charting.

Monthly Oil Chart:

Crude Oil Monthly Chart. Oil still trading generally between 200 MA and 100 MA on monthly chart. Spet 2 1037 PM FX $USOIL $WTI $USO $UWT $DWT $CL_F #OIL #chart

A few months back I had advised that this was the most likely scenario.

https://www.tradingview.com/chart/USOIL/CJ7iv9iI-Crude-Oil-Monthly-Chart-Oil-still-trading-generally-between-200/

crude, oil, monthly, chart
Crude Oil Monthly Chart. Oil still trading generally between 200 MA and 100 MA on monthly chart. Spet 2 1037 PM FX $USOIL $WTI $USO $UWT $DWT $CL_F #OIL #chart

Crude Oil Monthly Chart. Oil trading under main pivot at 69.50 area, trading 68.64 intrad. Aug 26 1125 PM FX $USOIL $WTI $USO $UWT $DWT $CL_F #OIL #chart

The pivot area has proven not as important as the 100 MA resistance on the monthly chart in recent trade, but it has been resistance.

https://www.tradingview.com/chart/USOIL/9T8no9UA-Crude-Oil-Monthly-Chart-Oil-trading-under-main-pivot-at-69-50-a/

crude, oil, chart, pivot, resistance
Crude Oil Monthly Chart. Oil trading under main pivot at 69.50 area, trading 68.64 intrad. Aug 26 1125 PM FX $USOIL $WTI $USO $UWT $DWT $CL_F #OIL #chart

Weekly Crude Oil Chart:

Below are three weekly chart scenarios.

Crude Oil Algorithm Simple Weekly Gen 1 Model has price at 72.11 Sept 10. Sept 2 1052 PM FX $USOIL $WTI $USO $UWT $DWT $CL_F #OIL #Algorithm #OOTT

https://www.tradingview.com/chart/USOIL/MLUSjRgB-Crude-Oil-Algorithm-Simple-Weekly-Gen-1-Model-has-price-at-72-11/

Weekly, oil, trading, algorithm
Crude Oil Algorithm Simple Weekly Gen 1 Model has price at 72.11 Sept 10. Sept 2 1052 PM FX $USOIL $WTI $USO $UWT $DWT $CL_F #OIL #Algorithm #OOTT

Sept 10 crude oil price target scenarios. Sept 2 1048 PM $USOI $WTI $CL_F Weekly #chart #oil

https://www.tradingview.com/chart/USOIL/qJPd2GCF-Sept-10-crude-oil-price-target-scenarios-Sept-2-1048-PM-USOI/

weekly, oil, price, targets
https://www.tradingview.com/chart/USOIL/qJPd2GCF-Sept-10-crude-oil-price-target-scenarios-Sept-2-1048-PM-USOI/

Crude Oil Weekly Chart Scenario III Sept 2 1043 PM FX $USOIL $WTI $USO $UWT $DWT $CL_F #OIL #Algorithm #OOTT

https://www.tradingview.com/chart/USOIL/EzqJ1NvT-Crude-Oil-Weekly-Chart-Scenario-III-Sept-2-1043-PM-FX-USOIL-WT/

Crude, oil, weekly, chart, scenario
Crude Oil Weekly Chart Scenario III Sept 2 1043 PM FX $USOIL $WTI $USO $UWT $DWT $CL_F #OIL #Algorithm #OOTT

May 21 – A feature post was published this week to review time cycles, retrace possibilities on the other side of time cycles on the weekly charts. Below is the post link:

Feature Post: 12 of Last 13 Oil Chart Time-Cycles Have Trend Reversal. $USOIL $WTI $CL_F $USO $UCO $UWT $DWT #OIL #OOTT

Daily Oil Chart:

Oil Daily Chart. MACD still crossed up with price thru 50 MA and resting on it now. Sept 2 1108 PM FX $USOIL $WTI $USO $UWT $DWT $CL_F #OIL #chart

https://www.tradingview.com/chart/USOIL/AzCs602D-Oil-Daily-Chart-MACD-still-crossed-up-with-price-thru-50-MA-and/

Oil, daily, chart, MACD, 50 MA
Oil Daily Chart. MACD still crossed up with price thru 50 MA and resting on it now. Sept 2 1108 PM FX $USOIL $WTI $USO $UWT $DWT $CL_F #OIL #chart

Diagonal Trend Lines:

Diagonal trend-lines are critical inflection points (currently represented in red below on our conventional charting).

Please review many of my recent posts so you can learn about how important these diagonal trend-lines are. If one is breached you can look to pull-back to next diagonal trend line about 90% of the time. Also pay attention to how thick the lines are – the thicker the line the more important because they represent extensions from previous time / price cycles.

Remember you can come in to the chat room to message the trader and REMEMBER I have posted a live chart link in this post so if you can’t see the lines well on this chart above you can go to the live chart link and watch for member live algo chart links through-out the day in your email inbox!

The diagonal trend-lines are marked on chart below:

Sept 2: Previous remains signal;

Oil Chart (Weekly). Oil trend lines on weekly time-frame. Aug 12 951 PM FX $USOIL $WTI $USO $UWT $DWT $CL_F #OIL

Significant probability oil hits 79.50 ish Dec 3, 2018 ish. But over that area unlikely unless there is a geo political event. Over 79.50 the shorts would get wrecked. Low 50s most probable by 2022. Early Dec 2018 is likely the highs. $USOIL $WTI $CL_F $USO #OOTT

https://www.tradingview.com/chart/USOIL/ouLad9xj-Crude-oil-weekly-trendline-chart-suggests-79-50-area-Dec-3-2018/

oil, trend lines, chart
Oil Chart (Weekly). Oil trend lines on weekly time-frame. Aug 12 951 PM FX $USOIL $WTI $USO $UWT $DWT $CL_F #OIL

Oil Chart (Weekly). Oil trend lines on weekly time-frame. Aug 7 605 AM FX $USOIL $WTI $USO $UWT $DWT $CL_F #OIL

https://www.tradingview.com/chart/USOIL/bS8T4ism-Oil-Chart-Weekly-Oil-trend-lines-on-weekly-time-frame-Aug-7/

Oil, trend line, chart
Oil Chart (Weekly). Oil trend lines on weekly time-frame. Aug 7 605 AM FX $USOIL $WTI $USO $UWT $DWT $CL_F #OIL

Previous posts for perspective;

Oil has now cleared every trendline resistance provided on conventional charting I’ve posted last year. $USOIL $WTI $CL_F #OOTT #OIL $USO $UWT $DWT 233 PM Jan 1

Oil, trendline, resistance, chart
Oil has now cleared every trendline resistance provided on conventional charting I’ve posted last year. $USOIL $WTI $CL_F #OOTT #OIL $USO $UWT $DWT 233 PM Jan 1
$USOIL, $WTI, Chart, Trendlines
Simple lines show expose clusters of resistance. Crude algo intra work sheet 201 AM Apr 10 FX $USOIL $WTIC #OIL $CL_F CL $USO $UCO $SCO $UWT $DWT #OOTT

Notice when the daily chart is opened, the simple lines extend to current day trade.

Daily chart view. Simple lines show expose clusters of resistance. Crude algo intra work sheet 213 AM Apr 10 FX $USOIL $WTIC #OIL $CL_F CL $USO $UCO $SCO $UWT $DWT #OOTT

Daily, $USOIL $WTI, Chart, Trendlines
Daily chart view. Simple lines show expose clusters of resistance. Crude algo intra work sheet 213 AM Apr 10 FX $USOIL $WTIC #OIL $CL_F CL $USO $UCO $SCO $UWT $DWT #OOTT

Fibonacci Levels:

Watch the lines for support and resistance. Careful using them as traditional retracement levels with crude because the algo lines etc are more dominant / predictable. But the Fib lines are excellent indicators for intra-day trade support and resistance.

The Fibonacci lines are marked on main chart above.

Horizontal Trend-Lines (purple):

Horizontal trend-lines are not as important as the other indicators reviewed above, however, they do serve as important resistance and support intra-day for tight trading and they are important if thick (in other words they come from previous time / price cycles). WE STARTED TO REPRESENT THE REALLY IMPORTANT LINES IN YELLOW FYI FOR EASE. Refer to chart for current applicable horizontal trend-lines.

Horizontal trend-lines are marked on charts above.

Oil Time / Price Cycles:

Watch your email and / or my Twitter feed for time price cycles they may start to terminate.

Time / price cycles are the single most important indicator and my record calling them is near 100% – since inception seven months ago. The reason they are so important is that a trader does not want to be holding a crude oil instrument at termination of a time cycle if not absolutely sure if price will go up or down. A trade may choose to enter a large position in advance of a time price cycle termination IF THERE IS A HIGH PROBABILITY OF A DIRECTION IN PRICE and if the market is trading at a really important pivot area. In other words, if the market is trading at the bottom of the upward trending channel at a support (yellow lines) and we knew there was a significant probability of a time cycle about to terminate a trader may enter with a long position. The price really spikes or drops significantly when these important time cycles terminate.

The problem with time / price cycle terminations is they change from minute to minute (depending on where price is on the chart) so you have to be in the trade room to get the alert. Our lead traders will do everything they can in future to send these on SMS but we have to be careful because it can be difficult with so much going on in the room. The reason they (time cycles) change is because they are actually represented by or are geometric shapes in the chart – I know it sounds odd but I have (as I mentioned) hit these calls just shy of 100%. The oil political people know the same algorithmic modeling principles and they ALWAYS TIME THEIR BIG ANNOUNCEMENTS AROUND THE TIME PRICE CYCLE TERMINATIONS.

So if you can picture a triangle on the chart – and price is trading in the triangle – and price is going to come to the edge of the triangle and there is a significant support or resistance or an algo line terminating there too or a target (those type of indications)… then we know there is a high probability of a time and price change. In other words, it is where there are clusters of algorithm points that cross and when price is going to cross over that cluster is where they are. And these are represented on all the different time frames – the larger the time frame – the larger the time price cycle termination – the larger the spike or downdraft. This is where we establish our intra-day quadrants from for sniping trades (which we will put in to the room soon because it looks like the geo political rhetoric is over for a while making them more predictable). Difficult to explain in short. So we will do our best to SMS alert these in future.

Also, the real large or important time / price cycle terminations we know far in advance and they can be put in these newsletters.

If you review my Epic the Oil Algo Twitter feed, my blog posts and my story on our website you will get a feel for how accurate these calls are.

Alpha Algo Trading Trend-Lines (Primary – Red dotted lines. Secondary – White dotted lines):

To determine which algo line is most alpha (or probable) intra day, it is the nearest line to price action. This can also help you determine the trend of trade. If the algo line is trending up the price will follow it up until price is tested at an algorithm indicator (the main tests are diagonal trendlines, horizontal trendlines, time / price cycles etc – as I have shared with you). This is why it is important to watch all the lines because they are all support and resistance. To keep it simple trade the range (yellow lines) as I’ve mentioned but keep an eye on these indicators.

Current Alpha Algo Targets (Red circles):

Your closest target that crude is trending toward is always the most probable.Then, your second most probable is the one that is up or down trend depending on whether general price is in an upward or downtrend for the most recent week or so and what your other indicators look like (such as the MA’s I explained above).

The other way to determine which targets are in play is actually quite simple, you will notice that crude trades between the channel lines up and down and up and down and there are various support and resistance along the way. If it hits a target at the top of the channel you can bet most times (unless the next day like today) that the next target hit will be at the bottom of the channel.

Wait for the price to trend toward a target and take your position and watch as price gets closer and closer to the target. Remember, that the machines trade from decision to decision – or in other words from support to next resistance or resistance to next support or when the times come each week on Tuesday Wednesday and Friday they will trend toward the target that market price action determines they go to.

Our lead trader will explain more in the room and do not hesitate to ask our lead trader in the room by private message or on twitter to explain intra day decisions.

Recent Live Crude Oil Trade Alerts (samples):

Aug 27, 2018 – The oil trading alert samples will be updated after the upcoming special reports are released over the next few days. 

Aug 12 2018 – Recent trades are found in this recent report:

Crude Oil Trading Face-Off Results “Pro Trader” (Man) vs. EPIC Oil Algorithm (Machine Trading Tech)

Click on feature post for recent crude oil trading alerts blog post; Oil Trading Alerts Live Video w EPIC Oil Algorithm #EIA Report #Oil #Trading #Algorithm #Alerts $USOIL $WTI $CL_F

Oil trade alert to start the week 68.61 long, 68.85 closed. Win rate high 90% – ask for a tour. Time stamped, recorded, live alerts. 

https://twitter.com/EPICtheAlgo/status/1026287786113081344

Oil trade alert to start the week 68.61 long, 68.85 closed. 

oil, trading, alert
Oil trade alert to start the week 68.61 long, 68.85 closed. EPIC Oil Algorithm $USOIL $WTI $CL_F #OilTradeAlerts $UWT $DWT

Oil trade alert to start the week 68.61 long, 68.85 closed (Part 2). 

Crude, oil, trade alert, PT2
Oil trade alert to start the week 68.61 long, 68.85 closed (Part 2). EPIC Oil Algorithm $USOIL $WTI $CL_F #OilTradeAlerts $UWT $DWT

Machine trading 🙂 

Machine trading 🙂 $USOIL $WTI $CL_F #OIL #Algorithmic #trading #alerts pic.twitter.com/Hja5Tbgmob

— Melonopoly (@curtmelonopoly) August 3, 2018

A scalp to start the day. Multi-month winning streak continues. Ask for a tour of the feed if you need proof. 

A scalp to start the day. Multi-month winning streak continues. Ask for a tour of the feed if you need proof. EPIC Oil Algorithm FX $USOIL $WTI #CL $USO $UWT $DWT #OOTT #Oil #trading #algorithm pic.twitter.com/JTHCMp58Cv

— Melonopoly (@curtmelonopoly) July 27, 2018

100% personal alerted oil trade win rate documented, recorded, alerted real time to feed continues for months (we did have one loss alert by a tech a few weeks back). 

100% personal alerted oil trade win rate documented, recorded, alerted real time to feed continues for months (we did have one loss alert by a tech a few weeks back). EPIC the Oil Algorithm FX $USOIL $WTI $USO $UWT $DWT #OIl #OOTT #Trading @EPICtheAlgo pic.twitter.com/pKL1iKE5T1

— Melonopoly (@curtmelonopoly) July 25, 2018

Live oil trade alert. Long 69.06 US OIL WTI 1 5th sizing EPIC Oil Algorithm.

oil, trade, alerts, WTI
Live oil trade alert. Long 69.06 US OIL WTI 1 5th sizing EPIC Oil Algorithm $USOIL $WTI #OIL #OOTT $UWT $DWT $USO

Live oil trade alert. Trim 50 percent 69.30. EPIC Oil Algorithm.

oil, trading, alerts, crude
Live oil trade alert. Trim 50 percent 69.30. EPIC Oil Algorithm $USOIL $WTI #OIL #OOTT $UWT $DWT $USO #trading #alerts

Live oil trade alert. Long 68.93 add 50 percent. EPIC Oil Algorithm. 

oil, trading, alert, long
Live oil trade alert. Long 68.93 add 50 percent. EPIC Oil Algorithm $USOIL $WTI #OIL #OOTT $UWT $DWT $USO #trading #alerts

Live oil trade alert. Trim other 50 percent 69.26 50 percent.

Live, oil, trade, alert, trim
Live oil trade alert. Trim other 50 percent 69.26 50 percent. EPIC Oil Algorithm $USOIL $WTI #OIL #OOTT $UWT $DWT $USO #trading #alerts

Overnight oil trade: short 72.79 add 72.71 cover 72.27s-72.35s. Not cleanest trade but HUGE win. 100% win rate continues (for months). Guidance detail in oil trading room (to expect heat). Live alerts, time stamped, recorded.

https://twitter.com/EPICtheAlgo/status/1015202909041102849

Overnight oil trade short 72.79 add 72.71 cover 72.27s to 72.35s. Not cleanest trade but HUGE win. 100% win rate continues 

Oil, trade, alert, short
Overnight oil trade short 72.79 add 72.71 cover 72.27s to 72.35s. Not cleanest trade but HUGE win. 100% win rate continues $USOIL $WTI $USO #OIL #Trading #Alerts

Member guidance in oil chat room this morning “i’ll be selling spikes in to resistance until it doesn’t work – the larger more obvious i’ll alert against downtrend upper channel orange dotted etc” 

https://twitter.com/EPICtheAlgo/status/1014943645974323204

Member guidance this morning i’ll be selling spikes in to resistance until it doesn’t work 

Oil, chat, trading, room, guidance
Member guidance this morning i’ll be selling spikes in to resistance until it doesn’t work $USOIL $WTI $USO $UWT $DWT EPIC Oil Algorithm #oil #trading #alerts

Scalp day. 100 percent win rate for months continues. Time stamped, live alerted, recorded. 

https://twitter.com/EPICtheAlgo/status/1014938308961595393

100 percent win rate for months continues. Time stamped, live alerted, recorded. 

oil, trade, alerts, winning, rate, ,best
100 percent win rate for months continues. Time stamped, live alerted, recorded. $USOIL $WTI $USO $UWT $DWT EPIC Oil Algorithm #oil #trading #alerts

Oil trading chat room member guidance and intra day daytrading charting example ‘70.02 would be the swing retrace. So the thesis is sound but you may have pain before potential drop”.

oil, trading, chat, room, guidance
70.02 would be the swing retrace. So the thesis is sound but you may have pain before potential drop.

Oil trading chat room member guidance and intra day daytrading charting example “Target is in 70.70 area so I will likely give this lots of room swing if I have to. We’ll see”.

oil, trade, alert, price, targets
Target is in 70.70 area so I will likely give this lots of room swing if I have to. We’ll see. FX $USOIL $WTI #OilTrading

Oil trading chat room member guidance and intra day daytrading charting example “Machines defending the retrace intra day”.

oil, machine, trading, WTI
Machines defending the retrace intra day FX $USOIL $WTI #OIL #Algorithm

Trims / close longs 71.39 to 71.71 oil trade alert. 

https://twitter.com/EPICtheAlgo/status/1011981290051129346

Long 71.21 oil trade alert with the one add. 

https://twitter.com/EPICtheAlgo/status/1011980052198719488

Today’s #EIA oil trade with Oil Algorithm (EPIC) Live alert entries (green) exits (red).

https://twitter.com/EPICtheAlgo/status/1011977209442177026

Screen shot member oil chat room first oil trade alert of day – Long 71.21 hoping we squeeze in to EIA

EIA, oil, trading, chat, room
Screen shot member oil chat room first oil trade alert of day – Long 71.21 hoping we squeeze in to EIA

One minute algorithmic on the fly chart trade came off after initial long side oil trade alert- see green arrow. 

oil, trade, alert, chart, trades
One minute algorithmic on the fly chart trade came off after initial long side oil trade alert- see green arrow. #oiltradealert #oil

Screen shot of alert to trim half at 71.39 place stop 71.26 on remaining half and resistance guidance. 

oil, trade, alert, trim, position
Screen shot of alert to trim half at 71.39 place stop 71.26 on remaining half and resistance guidance. #oil #trading #chat

Oil chat room screen shot of next trade alert to trim long at 71.52 25 percent and hold 25 percent.

oil, trading, alert, chat, room
Oil chat room screen shot of next trade alert to trim long at 71.52 25 percent and hold 25 percent.

Final crude oil trade alert to close final 12.5 percent at 71.74 and hold 0 percent at chart resistance.

oil, crude, oil, trading, alert
Final crude oil trade alert to close final 12.5 percent at 71.74 and hold 0 percent at chart resistance.

And then the post EIA 1030 Wed trade alert with trading plan price targets were posted – usually wait 2nd 5 min candle

oil, trade, alerts, EIA, report
And then the post EIA 1030 Wed trade alert with trading plan price targets were posted – usually wait 2nd 5 min candle

And then this happened, oil shot up right through the price targets from the alert.

oi, trade, alert, price, targets, reached
And then this happened, oil shot up right through the price targets from the alert.

Winning streak continues. 100% live oil trade alert win rate for many weeks now. Time stamped real time. 

https://twitter.com/EPICtheAlgo/status/1010004212950843392

EPIC Oil Algorithm trade alert wins continue for many weeks now. Time stamped real time. 

oil, trade, alerts, winning, streak
EPIC Oil Algorithm trade alert wins continue for many weeks now. Time stamped real time. FX $USOIL $WTI $CL_F $USO #OIL #OOTT #Oiltradealerts #algorithm

Boom “3rd target hit. Trade thesis complete for #EIA. Next levels to follow. 

Boom "3rd target hit. Trade thesis complete for #EIA. Next levels to follow. Oil Algorithm (EPIC). June 20 1148 AM FX $USOIL $WTI $USO $UWT $DWT $CL_F #OIL #Algorithm #OOTT " pic.twitter.com/WAl4N9n2yH

— Melonopoly (@curtmelonopoly) June 20, 2018

First 3 targets intra if long side trade alert holds. Trim in add above or on pull back and turns up.

oil, trading, plan, chart, price, targets
First 3 targets intra if long side trade alert holds. Trim in add above or on pull back and turns up. Oil Algorithm (EPIC). June 20 1046 AM FX $USOIL $WTI $USO $UWT $DWT $CL_F #OIL #Algorithm #OOTT

Trade is using our 50% retrace on daytrade coding level intra as pivot.

oil, trade, alert, member, guidance, charting
Trade is using our 50% retrace on daytrade coding level intra as pivot Oil Algorithm (EPIC). June 20 1058 AM FX $USOIL $WTI $USO $UWT $DWT $CL_F #OIL #Algorithm #OOTT

Close up of intra day trading battle.

oil, trading, plan, chart, alert
Close up of intra day trading battle #daytrading Oil Algorithm (EPIC). June 20 1105 AM FX $USOIL $WTI $USO $UWT $DWT $CL_F #OIL #Algorithm #OOTT

1st of 3 targets hit. Curt didn’t get it but coding team did.

oil, algorithm, trading, alert
1st of 3 targets hit. Curt didn’t get it but coding team did. Oil Algorithm (EPIC). June 20 1121 AM FX $USOIL $WTI $USO $UWT $DWT $CL_F #OIL #Algorithm #OOTT

Up over 1st target longs want to trim in to 2nd target level.

live, oil, trade, in progress
Up over 1st target longs want to trim in to 2nd target level. Oil Algorithm (EPIC). June 20 1141 AM FX $USOIL $WTI $USO $UWT $DWT $CL_F #OIL #Algorithm #OOTT

3rd target hit. Trade thesis complete for #EIA. Next levels to follow.

oil, trade, alerts, targets, complete
3rd target hit. Trade thesis complete for #EIA. Next levels to follow. Oil Algorithm (EPIC). June 20 1148 AM FX $USOIL $WTI $USO $UWT $DWT $CL_F #OIL #Algorithm #OOTT

Daytrading support and resistance fractals (white arrows key).

daytrade, oil, alert, guidance, chart
Daytrading support and resistance fractals (white arrows key) Oil Algorithm (EPIC). June 20 1209 PM FX $USOIL $WTI $USO $UWT $DWT $CL_F #OIL #Algorithm #OOTT

Recent Oil Algorithm Price Target Hits:

Wed 1030 EIA report lower price target a perfect hit published on weekend report. Oil Algorithm (EPIC). FX $USOIL $WTI $USO $UWT $DWT $CL_F #OIL #Algorithm #OOTThttps://twitter.com/EPICtheAlgo/status/1024665109338222592

Wed 1030 EIA report lower price target a perfect hit published on weekend report.

Oil, algorithm, price, target, hit, EIA
Wed 1030 EIA report lower price target a perfect hit published on weekend report. Oil Algorithm (EPIC). FX $USOIL $WTI $USO $UWT $DWT $CL_F #OIL #Algorithm #OOTT

Tues 430 lower price target a perfect hit, as published on weekend report. Oil Algorithm (EPIC). FX $USOIL $WTI $USO $UWT $DWT $CL_F #OIL #Algorithm #OOTT

https://twitter.com/EPICtheAlgo/status/1024447086102827011

Tues 430 lower price target a perfect hit published on weekend report. Oil Algorithm (EPIC). FX $USOIL $WTI $USO $UWT $DWT $CL_F #OIL #Algorithm #OOTT

Oil, algorithm, price, target, hit
Tues 430 lower price target a perfect hit published on weekend report. Oil Algorithm (EPIC). FX $USOIL $WTI $USO $UWT $DWT $CL_F #OIL #Algorithm #OOTT

Oil Intra-Day Algo Trading Quadrants (white dotted lines):

Trading quadrants are simply support and resistance lines that can assist your intra-day trading – they are not alpha or primary support and resistance by any measure. Price action does however typically move more assertively when leaving a trading quadrant.

Indicator Methods:

As explained above, my algorithm is a consideration of up to fifty traditional indicators at any one time – each one given its own weight in accordance to its accuracy (win rate). This is how we establish the probability of specific targets hitting (we call them alpha algo targets).

Alpha Algo Targets, Algo Trend-lines, Algo Timing, Quadrants for Intra Snipes

Algo targets are the red circles – they correspond with important times each week in oil reporting land. Tuesday 4:30 PM, Wednesday 10:30 AM and Friday at 1:00 PM. The red dotted diagonal lines are the algo trend-lines. And the vertical dotted (red or green) are marking the important times each week. You will find that the price of crude will hit one of the alpha algo targets about 90% of the time. In the absence of market direction the machines take price to the next algo line and/or target. Understanding how the price of crude reacts to the algos and how they move price from target to target is critical for intra-day and swing trading crude oil and associated instruments.

You will notice that price action of crude will use these algo trend-lines and act as support and resistance, and that price also often violently moves when an alpha algo line is breached either upward or downward.

We cover this in much more detail in the member updates, trading room. A review of my Twitter feed and previous blog posts will help you understand the relation of these indicators. We will start posting video blogs (for my subscribers) on YouTube (in addition to my daily blog posts) for swing traders that work during regular trading hours.

Also… we will cover how to establish algo trend-lines and price targets future forward (as you have seen me do on my Twitter feed for some time now).

Conclusion:

See you in the live trade room! And again, if you struggle to know how to use these indicators as a trader’s edge, it is recommended (if you have earnestly reviewed all of our documentation first) that you obtain private coaching prior to trading a real account with real money – we recommend you use a paper trading account at first.

You can also send specific questions to our email inbox at [email protected] – if you do this be sure to ask a specific question so it can be answered specifically. When the 24 hour oil trading room opens you will have ample opportunity in that 24 hour room to ask questions also.

Watch my EPIC the Oil Algo Twitter feed for intra day notices and your email in box for member only material intra day also.

EPIC the Oil Algo

Subscribe to my Service here:

Standalone Oil Algorithm Newsletter (member charting sent out weekly).

Real-Time Oil Trading Alerts (Private Twitter feed).

Oil Trading Room Bundle (includes weekly newsletter charting and real-time trading alerts on Twitter).

Commercial / Institutional Multi User License (for professional trading groups).

One-on-One Trade Coaching (Via Skype or in person).

Connect:

Register to free email list for trade set-ups, webinars, special events: https://compoundtrading.com/contact/

Website: https://compoundtrading.com

Blog: https://compoundtrading.com/blog/

Free chat room: https://discord.gg/2HRTk6n

Subscribe: https://compoundtrading.com/overview-…

Twitter: https://twitter.com/CompoundTrading

Lead Trader: https://twitter.com/curtmelonopoly

Tradingview: https://www.tradingview.com/u/curtmel…

Facebook: https://www.facebook.com/compoundtrad…

StockTwits: https://stocktwits.com/compoundtrading

Email: https://[email protected]

Curtis Melonopoly (@curtmelonopoly) is rated Top 250 Stock exchanges authority, covering also Mathematical finance and Economy of the United States

Tweets by EPICtheAlgo


Article topics: EPIC, Oil, Algorithm, Trading, Alerts, Crude, $USOIL, $WTI, $USO, $UCO, $CL_F, $UWT, $DWT, Chart


Read More
Oil Algorithm Trading Report (EPIC) Sun Aug 26 FX: $USOIL $WTI $CL_F $USO #Oil #Trading #Algorithm

Oil Algorithm Trading Report (EPIC) Sun Aug 26 FX: $USOIL $WTI $CL_F $USO #Oil #Trading #Algorithm

August 27, 2018December 30, 2018 Epic the AlgoCrude Oil Trading Algorithm (EPIC)$CL_F, $UCO, $USO, $USOIL, $UWT, $WTI, Alerts, Algorithm, Chart, Crude, DWT, EPIC, Oil, Trading

Crude Oil Trading Algorithm Chart Report (EPIC) Sunday Aug 26, 2018.

FX: $USOIL $WTI $USO $CL_F $UWT $DWT $UCO $SCO $ERX $ERY $GUSH $DRIP

Welcome to the oil trading algorithm report. My name is EPIC the Oil Algorithm and I am one of seven primary Algorithmic Chart Models in development at Compound Trading Group (there are near 300 in total in development at various stages for various markets).

NOTICES:

New members to our oil algorithm charting model are encouraged to on-board in a way that equips you as an oil trader for profit.

Visit my Twitter feed EPIC Oil Algorithm Twitter (@EPICtheAlgo) and review tweets over the last few months, visit our blog and review the recent oil algorithm blog posts, our You Tube channel “how my oil algorithm works”, “how to use my charting”, weekly EIA oil report videos and our website (it explains how the oil algorithm was developed). Reviewing those important points of reference will increase your probability of success considerably. This report includes links to some recent example “how-to” videos.

Oil Trade Coaching – Users of this algorithmic oil charting model may opt for private one-on-one coaching with our lead trader and / or an experienced trader that has worked under our lead trader. On our website standard one-on-one online coaching packages are made available (coaching via Skype) or you can request a customized package (reflecting the time you wish to invest in learning). To request a custom package suited to your needs email [email protected] or click here for standard private trade coaching packages. Other options for coaching include online webinars and private on location (in person) coaching sessions. 

Oil Trading – How to Use the Oil Algorithm

Oil Trading – How to Trade Intra-day with my Algorithmic Charting

Oil Trading Alerts. Live Lead Trader Video Trading w EPIC Oil Algorithm

Recent articles from our blog about how to trade crude oil with our oil trading algorithm:

Oil Trade Alerts: How We Knew Where Oil Sell-Off Bottom Was in Advance. Crude Oil Trading Strategy.

Crude Oil Trading Face-Off Results “Pro Trader” (Man) vs. EPIC Oil Algorithm (Machine Trading Tech).

Oil Trading Alerts Live Video w EPIC Oil Algorithm #EIA Report.

“The Nut Hand” Today’s Huge Oil Trade Win. Exactly How It Was Done. How I Knew & How You Can Too.

MULTI-USERS: Institutional / commercial platform now available.

SOFTWARE: My algorithmic charting is planned to go to developer coding phase for our trader’s dashboard program. Please review my algorithm development process, about my oil algorithm story on our website www.compoundtrading.com and my oil algo charting posts on my Twitter feed and/or this blog.

HOW MY ALGORITHM WORKS: I am an oil algorithm model in development. My math is based on traditional indicators (up to fifty at any given time each weighted on win ratio merit – all not shown on chart at any given time) – such as simple math calculations relating to price and volume, Fibonacci, simple pivots, moving averages, Gann, Schiff and various other charting, geometric and mathematical factors. I do not yet have AI integration – only math as it relates to traditional indicators with the primary goal being probabilities. I am not a high frequency robot type algorithm – I am presented on (and used on) a traditional trading chart as one would normally use as a probability indicator. The goal is to provide our trader’s with an edge when triggering entries and exits on trades with instruments that rely on the price of crude oil.

Below you will find simplified levels represented on a traditional chart (both intra-day and as a swing trader or investor). This work (and associated trade) should be considered one decision at a time, “if this happens then this or this are my targets”… price – trigger – trade and so on. Questions to; [email protected], message our lead trader on Twitter, or message a lead trader in the private Discord oil trade room server.

Visit this link for more information about my oil algorithm development, this link explains how our algorithmic charting is done, this YouTube video explains in summary how my algorithm works https://www.youtube.com/watch?v=LUNyxFoXJp8 this link for more information about our algorithmic stock charting models and what makes them different than most.

EVERY CALL WE MAKE, EVERY PUBLIC INTERACTION, REPRESENTATION OF TRADE SIGNAL (ON EVERY VENUE) IS VIDEO RECORDED, ON SOCIAL MEDIA OR ON BLOG / WEBSITE TIME-STAMPED FOR PERMANENT RECORD AND TRANSPARENCY. PLEASE ALSO REFER TO OUR PUBLIC DISCLOSURE https://compoundtrading.com/disclosure-disclaimer/.

Oil Algorithm Observations:

Below is a link for the live chart version of EPIC the Oil Algorithm. The charting is a real-time trading chart represented on FX $USOIL $WTI published Aug 26, 2018.

Click on share button (bottom right beside flag) and when that screen opens click on “make it mine” to view real-time, make edits etc:

https://www.tradingview.com/chart/USOIL/JgtmjoFT-Oil-Algorithm-EPIC-Current-oil-trade-Aug-26-926-PM-FX-USOIL/

Oil, algorithm, crude, trading, chart
Oil Algorithm (EPIC). Current oil trade. Aug 26 926 PM FX $USOIL $WTI $USO $UWT $DWT $CL_F #Crude #OIL #Algorithm #OOTT

Aug 26, 2018

New: The new trade signals are the machine trading lower / tighter day-trading time frames (overlay charting versions we are beginning to share).

The first most predictable trade are the resistance and support cluster areas formed by long term chart trend lines (see charts that have trend-lines represented in red as made available below).

The second most predictable trade (wide trading range primary resistance and support that become predictable buy and sell triggers). Current algorithmic model wide trading range resistance (grey arrow – grey horizontal line) at approximately 68.92 in the current trading range. Current algorithmic model wide trading range support (grey arrow – grey horizontal line) at approximately 65.32 in the current trading range – these areas are general range support and resistance areas (our algorithm uses a .15 – .20 cent buffer on either side for these trades). Trading between the resistance / support horizontal grey lines is extremely profitable risk – reward if one is disciplined to the patience required and follows the trend of trade.

The lower trading range is 61.71 to 65.31. The upper trading range 68.93 to 72.54.

Third most predictable trade (support and resistance of uptrend or down trend channels). On the chart an upward trending trade channel is presented and a downward option (channel support and resistance / trading range is represented as diagonal dotted orange lines and purple arrows – as made available, assist in displaying directional trade decision areas).

Fourth most predictable trade (support and resistance of 30 min quadrants). The diagonal lines make up quadrants (in this instance on a 30 min chart) and are represented as orange diagonal lines that make up geometric diamond shapes. These lines also assist in intra-day trade.

Fifth most predictable trade (support and resistance of most applicable Fibonacci) the Fib support and resistance lines are the horizontal lines in various colors with the exception of purple and yellow (see below). These horizontal lines become support and resistance for intra-day trade.

Sixth most predictable trade (support and resistance of historical support and resistance) Natural / historical support and resistance lines shown in purple or yellow – they represent historical support and resistance. The strongest of the historical support and resistance lines are shown in yellow horizontal and are typically accompanied by a yellow arrow marker.

Seventh most predictable trade signal we use are the time and price targets (red circles). When trade is in a significant uptrend or downtrend the targets become very precise and move up the indicator priority list quick.

Tues, Wed and Fri targets are most predictable in extended multi week uptrends or downtrends. In recent time, trade could be described as range-bound under key resistance on weekly chart.

The Eighth most predictable trade is intra-day. You will notice on some of the charting geometric shapes in green on some of my charting (at times). They are charted live in the trading room and at times the lead trader will highlight these areas intra with white outlines (typically geometric shapes such as diamonds or triangles).

Intra-day Trading Bias

Intra day bias is short based on current range resistance (grey horizontal) at mid quad and just above price but MACD is up on daily so we expect continued upward price pressure to shorts. The bull side thesis intra-day is that price is at lower part of the quad and if it holds this lower quad support in to mid to late Monday it will be extremely bullish for the week (on probability).

Wide Trading Range – Buy and Sell Triggers for Swing Trading Crude Oil:

Swing trading bias / forward guidance as of Aug 26, 2019 9:44 PM EST for the near term (two week swing trade) is bullish above 65.00 (trading 68.56) if price can break upside of 50 MA and hold it and/or tests 65.30 area support on algorithmic model and holds. Price bounced off 200 MA daily chart support with MACD currently turned up. Probability is upward pressure on shorts.

Trade the ranges noted above between the thick grey lines (grey arrows) for the most predictable swing trades between 58.13 to 61.72, 61.72 to 65.32, 65.32 to 68.92, 68.93 to 72.54 and 72.54 to 76.15. This is a highly profitable risk-reward way to trade oil if you can be patient to trigger at only the break of the wide range charting areas and are disciplined to cut a losing trade that does not prove in your anticipated trend.

Or trade the range between the channel diagonal lines at support and resistance in up or down channel (orange dotted diagonals).

Oil Trading Algorithm (EPIC). Up trend channel crude oil trade. Aug 26 1059 PM FX $USOIL $WTI $USO $UWT $DWT $CL_F #OIL #Algorithm #OOTT

Crude, oil, trade, algorithm, up, channel
Oil Trading Algorithm (EPIC). Up trend channel crude oil trade. Aug 26 1059 PM FX $USOIL $WTI $USO $UWT $DWT $CL_F #OIL #Algorithm #OOTT

Oil Trading Algorithm (EPIC). Down trend channel crude oil trade. Aug 26 1101 PM FX $USOIL $WTI $USO $UWT $DWT $CL_F #Crude #Oil #Algorithm #OOTT

crude, oil, trading, algorithm, down, channel
Oil Trading Algorithm (EPIC). Down trend channel crude oil trade. Aug 26 1101 PM FX $USOIL $WTI $USO $UWT $DWT $CL_F #Crude #Oil #Algorithm #OOTT

Crude Oil Trading Algorithm Machine Trading Time Frame Charts.

Below are the first of many time-frames that our algorithm software coding team are using to develop our intelligent assisted oil trader platform.

The first is a chart overlay for machine trading in conjunction with the EPIC model. The second is a 1 min conventional chart to use in intra-day timing for various daytrading scenarios.

Please note: It is not advisable to trade these chart overlays until you have had some experience with them. How to trade the machine trading day trade chart videos will is coming. The shorter time frame overlays on the chart below also cause the chart to be considerably “noisy” so please use caution.

Oil Algorithm (EPIC). Machine trading daytrade time-frame. Aug 12 929 PM FX $USOIL $WTI $USO $UWT $DWT $CL_F #OIL #Algorithm #MachineTrading

https://www.tradingview.com/chart/USOIL/uPdA9akJ-Crude-Oil-Algorithm-EPIC-Machine-trading-day-trade-intraday-t/

Crude, oil, trading, algorithm, intraday, time frame, machine
Crude Oil Algorithm (EPIC). Machine trading day-trade intraday time-frame. Aug 26 1118 PM FX $USOIL $WTI $USO $UWT $DWT $CL_F #OIL #Algorithm #MachineTrading

Crude Oil Intra-day chart for daytrading oil on 1 minute time frame. Aug 26 1153 PM FX $USOIL $WTI $USO $UWT $DWT $CL_F #OIL #Chart

During a squeeze trade spikes upward through the highlighted area and then rests and works its way through the next area and spikes through the next highlighted area. This does not occur in regular trade. More on this chart in our special reporting for oil trading over the next few days.

https://www.tradingview.com/chart/USOIL/eGv2FzWa-Crude-Oil-Intra-day-chart-for-daytrading-oil-on-1-minute-time-fr/

Crude, oil, trading, algorithm, charting, daytrading
Crude Oil Intra-day chart for daytrading oil on 1 minute time frame. Aug 26 1153 PM FX $USOIL $WTI $USO $UWT $DWT $CL_F #OIL #Chart

Crude Oil Swing Trade Charting.

Monthly Oil Chart:

Crude Oil Monthly Chart. Oil trading under main pivot at 69.50 area, trading 68.64 intrad. Aug 26 1125 PM FX $USOIL $WTI $USO $UWT $DWT $CL_F #OIL #chart

The pivot area has proven not as important as the 100 MA resistance on the monthly chart in recent trade, but it has been resistance.

https://www.tradingview.com/chart/USOIL/9T8no9UA-Crude-Oil-Monthly-Chart-Oil-trading-under-main-pivot-at-69-50-a/

crude, oil, chart, pivot, resistance
Crude Oil Monthly Chart. Oil trading under main pivot at 69.50 area, trading 68.64 intrad. Aug 26 1125 PM FX $USOIL $WTI $USO $UWT $DWT $CL_F #OIL #chart

Oil Monthly Chart. Price above 200 MA below pivot MACD trend up, Stoch RSI down. Aug 12 936 PM FX $USOIL $WTI $USO $UWT $DWT $CL_F #OIL #chart

Monthly, oil, chart
Oil Monthly Chart. Price above 200 MA below pivot MACD trend up, Stoch RSI down. Aug 12 936 PM FX $USOIL $WTI $USO $UWT $DWT $CL_F #OIL #chart

Weekly Crude Oil Chart:

Crude Oil Algorithm Simple Weekly Gen 1 Model has price at 72.11 Sept 10 if 20 MA is breached and 69.50s at minimum. Aug 26 1136 PM FX $USOIL $WTI $USO $UWT $DWT $CL_F #OIL #Algorithm #OOTT

https://www.tradingview.com/chart/USOIL/TDY2rULK-Crude-Oil-Algorithm-Simple-Weekly-Gen-1-Model-has-price-at-72-11/

Crude, oil, trading, algorithm, chart, weekly
Crude Oil Algorithm Simple Weekly Gen 1 Model has price at 72.11 Sept 10 if 20 MA is breached and 69.50s at minimum. Aug 26 1136 PM FX $USOIL $WTI $USO $UWT $DWT $CL_F #OIL #Algorithm #OOTT

Oil Algorithm Simple Weekly Gen 1 Model. Highlighted trend structure seems bearish on this weekly chart. Aug 12 942 PM FX $USOIL $WTI $USO $UWT $DWT $CL_F #OIL #Algorithm #OOTT

https://www.tradingview.com/chart/USOIL/F30KGkeE-Oil-Algorithm-Simple-Weekly-Gen-1-Model-Highlighted-trend-struc/

Oil, weekly, chart, algorithm, model
Oil Algorithm Simple Weekly Gen 1 Model. Highlighted trend structure seems bearish on this weekly chart. Aug 12 942 PM FX $USOIL $WTI $USO $UWT $DWT $CL_F #OIL #Algorithm #OOTT

May 21 – A feature post was published this week to review time cycles, retrace possibilities on the other side of time cycles on the weekly charts. Below is the post link:

Feature Post: 12 of Last 13 Oil Chart Time-Cycles Have Trend Reversal. $USOIL $WTI $CL_F $USO $UCO $UWT $DWT #OIL #OOTT

Daily Oil Chart:

Oil Daily Chart. MACD cross up bullish testing underside of 50 MA. Aug 26 1030 PM FX $USOIL $WTI $USO $UWT $DWT $CL_F #OIL #chart

https://www.tradingview.com/chart/USOIL/qCfZKY4j-Oil-Daily-Chart-MACD-cross-up-bullish-testing-underside-of-50-M/

Crude, oil, daily, chart
Oil Daily Chart. MACD cross up bullish testing underside of 50 MA. Aug 26 1030 PM FX $USOIL $WTI $USO $UWT $DWT $CL_F #OIL #chart

Oil Daily Chart. MACD cross up failed, trade under 50 MA. Bearish trend continues. Aug 12 947 PM FX $USOIL $WTI $USO $UWT $DWT $CL_F #OIL #chart

https://www.tradingview.com/chart/USOIL/NFTJvJNw-Oil-Daily-Chart-MACD-cross-up-failed-under-50-MA-Bearish/

oil, daily, chart, 50MA, MACD
Oil Daily Chart. MACD cross up failed, trade under 50 MA. Bearish trend continues. Aug 12 947 PM FX $USOIL $WTI $USO $UWT $DWT $CL_F #OIL #chart

Diagonal Trend Lines:

Diagonal trend-lines are critical inflection points (currently represented in red below on our conventional charting).

Please review many of my recent posts so you can learn about how important these diagonal trend-lines are. If one is breached you can look to pull-back to next diagonal trend line about 90% of the time. Also pay attention to how thick the lines are – the thicker the line the more important because they represent extensions from previous time / price cycles.

Remember you can come in to the chat room to message the trader and REMEMBER I have posted a live chart link in this post so if you can’t see the lines well on this chart above you can go to the live chart link and watch for member live algo chart links through-out the day in your email inbox!

The diagonal trend-lines are marked on chart below:

Oil Chart (Weekly). Oil trend lines on weekly time-frame. Aug 12 951 PM FX $USOIL $WTI $USO $UWT $DWT $CL_F #OIL

Significant probability oil hits 79.50 ish Dec 3, 2018 ish. But over that area unlikely unless there is a geo political event. Over 79.50 the shorts would get wrecked. Low 50s most probable by 2022. Early Dec 2018 is likely the highs. $USOIL $WTI $CL_F $USO #OOTT

https://www.tradingview.com/chart/USOIL/ouLad9xj-Crude-oil-weekly-trendline-chart-suggests-79-50-area-Dec-3-2018/

oil, trend lines, chart
Oil Chart (Weekly). Oil trend lines on weekly time-frame. Aug 12 951 PM FX $USOIL $WTI $USO $UWT $DWT $CL_F #OIL

Oil Chart (Weekly). Oil trend lines on weekly time-frame. Aug 7 605 AM FX $USOIL $WTI $USO $UWT $DWT $CL_F #OIL

https://www.tradingview.com/chart/USOIL/bS8T4ism-Oil-Chart-Weekly-Oil-trend-lines-on-weekly-time-frame-Aug-7/

Oil, trend line, chart
Oil Chart (Weekly). Oil trend lines on weekly time-frame. Aug 7 605 AM FX $USOIL $WTI $USO $UWT $DWT $CL_F #OIL

Previous posts for perspective;

Oil has now cleared every trendline resistance provided on conventional charting I’ve posted last year. $USOIL $WTI $CL_F #OOTT #OIL $USO $UWT $DWT 233 PM Jan 1

Oil, trendline, resistance, chart
Oil has now cleared every trendline resistance provided on conventional charting I’ve posted last year. $USOIL $WTI $CL_F #OOTT #OIL $USO $UWT $DWT 233 PM Jan 1
$USOIL, $WTI, Chart, Trendlines
Simple lines show expose clusters of resistance. Crude algo intra work sheet 201 AM Apr 10 FX $USOIL $WTIC #OIL $CL_F CL $USO $UCO $SCO $UWT $DWT #OOTT

Notice when the daily chart is opened, the simple lines extend to current day trade.

Daily chart view. Simple lines show expose clusters of resistance. Crude algo intra work sheet 213 AM Apr 10 FX $USOIL $WTIC #OIL $CL_F CL $USO $UCO $SCO $UWT $DWT #OOTT

Daily, $USOIL $WTI, Chart, Trendlines
Daily chart view. Simple lines show expose clusters of resistance. Crude algo intra work sheet 213 AM Apr 10 FX $USOIL $WTIC #OIL $CL_F CL $USO $UCO $SCO $UWT $DWT #OOTT

Fibonacci Levels:

Watch the lines for support and resistance. Careful using them as traditional retracement levels with crude because the algo lines etc are more dominant / predictable. But the Fib lines are excellent indicators for intra-day trade support and resistance.

The Fibonacci lines are marked on main chart above.

Horizontal Trend-Lines (purple):

Horizontal trend-lines are not as important as the other indicators reviewed above, however, they do serve as important resistance and support intra-day for tight trading and they are important if thick (in other words they come from previous time / price cycles). WE STARTED TO REPRESENT THE REALLY IMPORTANT LINES IN YELLOW FYI FOR EASE. Refer to chart for current applicable horizontal trend-lines.

Horizontal trend-lines are marked on charts above.

Oil Time / Price Cycles:

Watch your email and / or my Twitter feed for time price cycles they may start to terminate.

Time / price cycles are the single most important indicator and my record calling them is near 100% – since inception seven months ago. The reason they are so important is that a trader does not want to be holding a crude oil instrument at termination of a time cycle if not absolutely sure if price will go up or down. A trade may choose to enter a large position in advance of a time price cycle termination IF THERE IS A HIGH PROBABILITY OF A DIRECTION IN PRICE and if the market is trading at a really important pivot area. In other words, if the market is trading at the bottom of the upward trending channel at a support (yellow lines) and we knew there was a significant probability of a time cycle about to terminate a trader may enter with a long position. The price really spikes or drops significantly when these important time cycles terminate.

The problem with time / price cycle terminations is they change from minute to minute (depending on where price is on the chart) so you have to be in the trade room to get the alert. Our lead traders will do everything they can in future to send these on SMS but we have to be careful because it can be difficult with so much going on in the room. The reason they (time cycles) change is because they are actually represented by or are geometric shapes in the chart – I know it sounds odd but I have (as I mentioned) hit these calls just shy of 100%. The oil political people know the same algorithmic modeling principles and they ALWAYS TIME THEIR BIG ANNOUNCEMENTS AROUND THE TIME PRICE CYCLE TERMINATIONS.

So if you can picture a triangle on the chart – and price is trading in the triangle – and price is going to come to the edge of the triangle and there is a significant support or resistance or an algo line terminating there too or a target (those type of indications)… then we know there is a high probability of a time and price change. In other words, it is where there are clusters of algorithm points that cross and when price is going to cross over that cluster is where they are. And these are represented on all the different time frames – the larger the time frame – the larger the time price cycle termination – the larger the spike or downdraft. This is where we establish our intra-day quadrants from for sniping trades (which we will put in to the room soon because it looks like the geo political rhetoric is over for a while making them more predictable). Difficult to explain in short. So we will do our best to SMS alert these in future.

Also, the real large or important time / price cycle terminations we know far in advance and they can be put in these newsletters.

If you review my Epic the Oil Algo Twitter feed, my blog posts and my story on our website you will get a feel for how accurate these calls are.

Alpha Algo Trading Trend-Lines (Primary – Red dotted lines. Secondary – White dotted lines):

To determine which algo line is most alpha (or probable) intra day, it is the nearest line to price action. This can also help you determine the trend of trade. If the algo line is trending up the price will follow it up until price is tested at an algorithm indicator (the main tests are diagonal trendlines, horizontal trendlines, time / price cycles etc – as I have shared with you). This is why it is important to watch all the lines because they are all support and resistance. To keep it simple trade the range (yellow lines) as I’ve mentioned but keep an eye on these indicators.

Current Alpha Algo Targets (Red circles):

Your closest target that crude is trending toward is always the most probable.Then, your second most probable is the one that is up or down trend depending on whether general price is in an upward or downtrend for the most recent week or so and what your other indicators look like (such as the MA’s I explained above).

The other way to determine which targets are in play is actually quite simple, you will notice that crude trades between the channel lines up and down and up and down and there are various support and resistance along the way. If it hits a target at the top of the channel you can bet most times (unless the next day like today) that the next target hit will be at the bottom of the channel.

Wait for the price to trend toward a target and take your position and watch as price gets closer and closer to the target. Remember, that the machines trade from decision to decision – or in other words from support to next resistance or resistance to next support or when the times come each week on Tuesday Wednesday and Friday they will trend toward the target that market price action determines they go to.

Our lead trader will explain more in the room and do not hesitate to ask our lead trader in the room by private message or on twitter to explain intra day decisions.

Recent Live Crude Oil Trade Alerts (samples):

Aug 27, 2018 – The oil trading alert samples will be updated after the upcoming special reports are released over the next few days. 

Aug 12 2018 – Recent trades are found in this recent report:

Crude Oil Trading Face-Off Results “Pro Trader” (Man) vs. EPIC Oil Algorithm (Machine Trading Tech)

Click on feature post for recent crude oil trading alerts blog post; Oil Trading Alerts Live Video w EPIC Oil Algorithm #EIA Report #Oil #Trading #Algorithm #Alerts $USOIL $WTI $CL_F

Oil trade alert to start the week 68.61 long, 68.85 closed. Win rate high 90% – ask for a tour. Time stamped, recorded, live alerts. 

https://twitter.com/EPICtheAlgo/status/1026287786113081344

Oil trade alert to start the week 68.61 long, 68.85 closed. 

oil, trading, alert
Oil trade alert to start the week 68.61 long, 68.85 closed. EPIC Oil Algorithm $USOIL $WTI $CL_F #OilTradeAlerts $UWT $DWT

Oil trade alert to start the week 68.61 long, 68.85 closed (Part 2). 

Crude, oil, trade alert, PT2
Oil trade alert to start the week 68.61 long, 68.85 closed (Part 2). EPIC Oil Algorithm $USOIL $WTI $CL_F #OilTradeAlerts $UWT $DWT

Machine trading 🙂 

Machine trading 🙂 $USOIL $WTI $CL_F #OIL #Algorithmic #trading #alerts pic.twitter.com/Hja5Tbgmob

— Melonopoly (@curtmelonopoly) August 3, 2018

A scalp to start the day. Multi-month winning streak continues. Ask for a tour of the feed if you need proof. 

A scalp to start the day. Multi-month winning streak continues. Ask for a tour of the feed if you need proof. EPIC Oil Algorithm FX $USOIL $WTI #CL $USO $UWT $DWT #OOTT #Oil #trading #algorithm pic.twitter.com/JTHCMp58Cv

— Melonopoly (@curtmelonopoly) July 27, 2018

100% personal alerted oil trade win rate documented, recorded, alerted real time to feed continues for months (we did have one loss alert by a tech a few weeks back). 

100% personal alerted oil trade win rate documented, recorded, alerted real time to feed continues for months (we did have one loss alert by a tech a few weeks back). EPIC the Oil Algorithm FX $USOIL $WTI $USO $UWT $DWT #OIl #OOTT #Trading @EPICtheAlgo pic.twitter.com/pKL1iKE5T1

— Melonopoly (@curtmelonopoly) July 25, 2018

Live oil trade alert. Long 69.06 US OIL WTI 1 5th sizing EPIC Oil Algorithm.

oil, trade, alerts, WTI
Live oil trade alert. Long 69.06 US OIL WTI 1 5th sizing EPIC Oil Algorithm $USOIL $WTI #OIL #OOTT $UWT $DWT $USO

Live oil trade alert. Trim 50 percent 69.30. EPIC Oil Algorithm.

oil, trading, alerts, crude
Live oil trade alert. Trim 50 percent 69.30. EPIC Oil Algorithm $USOIL $WTI #OIL #OOTT $UWT $DWT $USO #trading #alerts

Live oil trade alert. Long 68.93 add 50 percent. EPIC Oil Algorithm. 

oil, trading, alert, long
Live oil trade alert. Long 68.93 add 50 percent. EPIC Oil Algorithm $USOIL $WTI #OIL #OOTT $UWT $DWT $USO #trading #alerts

Live oil trade alert. Trim other 50 percent 69.26 50 percent.

Live, oil, trade, alert, trim
Live oil trade alert. Trim other 50 percent 69.26 50 percent. EPIC Oil Algorithm $USOIL $WTI #OIL #OOTT $UWT $DWT $USO #trading #alerts

Overnight oil trade: short 72.79 add 72.71 cover 72.27s-72.35s. Not cleanest trade but HUGE win. 100% win rate continues (for months). Guidance detail in oil trading room (to expect heat). Live alerts, time stamped, recorded.

https://twitter.com/EPICtheAlgo/status/1015202909041102849

Overnight oil trade short 72.79 add 72.71 cover 72.27s to 72.35s. Not cleanest trade but HUGE win. 100% win rate continues 

Oil, trade, alert, short
Overnight oil trade short 72.79 add 72.71 cover 72.27s to 72.35s. Not cleanest trade but HUGE win. 100% win rate continues $USOIL $WTI $USO #OIL #Trading #Alerts

Member guidance in oil chat room this morning “i’ll be selling spikes in to resistance until it doesn’t work – the larger more obvious i’ll alert against downtrend upper channel orange dotted etc” 

https://twitter.com/EPICtheAlgo/status/1014943645974323204

Member guidance this morning i’ll be selling spikes in to resistance until it doesn’t work 

Oil, chat, trading, room, guidance
Member guidance this morning i’ll be selling spikes in to resistance until it doesn’t work $USOIL $WTI $USO $UWT $DWT EPIC Oil Algorithm #oil #trading #alerts

Scalp day. 100 percent win rate for months continues. Time stamped, live alerted, recorded. 

https://twitter.com/EPICtheAlgo/status/1014938308961595393

100 percent win rate for months continues. Time stamped, live alerted, recorded. 

oil, trade, alerts, winning, rate, ,best
100 percent win rate for months continues. Time stamped, live alerted, recorded. $USOIL $WTI $USO $UWT $DWT EPIC Oil Algorithm #oil #trading #alerts

Oil trading chat room member guidance and intra day daytrading charting example ‘70.02 would be the swing retrace. So the thesis is sound but you may have pain before potential drop”.

oil, trading, chat, room, guidance
70.02 would be the swing retrace. So the thesis is sound but you may have pain before potential drop.

Oil trading chat room member guidance and intra day daytrading charting example “Target is in 70.70 area so I will likely give this lots of room swing if I have to. We’ll see”.

oil, trade, alert, price, targets
Target is in 70.70 area so I will likely give this lots of room swing if I have to. We’ll see. FX $USOIL $WTI #OilTrading

Oil trading chat room member guidance and intra day daytrading charting example “Machines defending the retrace intra day”.

oil, machine, trading, WTI
Machines defending the retrace intra day FX $USOIL $WTI #OIL #Algorithm

Trims / close longs 71.39 to 71.71 oil trade alert. 

https://twitter.com/EPICtheAlgo/status/1011981290051129346

Long 71.21 oil trade alert with the one add. 

https://twitter.com/EPICtheAlgo/status/1011980052198719488

Today’s #EIA oil trade with Oil Algorithm (EPIC) Live alert entries (green) exits (red).

https://twitter.com/EPICtheAlgo/status/1011977209442177026

Screen shot member oil chat room first oil trade alert of day – Long 71.21 hoping we squeeze in to EIA

EIA, oil, trading, chat, room
Screen shot member oil chat room first oil trade alert of day – Long 71.21 hoping we squeeze in to EIA

One minute algorithmic on the fly chart trade came off after initial long side oil trade alert- see green arrow. 

oil, trade, alert, chart, trades
One minute algorithmic on the fly chart trade came off after initial long side oil trade alert- see green arrow. #oiltradealert #oil

Screen shot of alert to trim half at 71.39 place stop 71.26 on remaining half and resistance guidance. 

oil, trade, alert, trim, position
Screen shot of alert to trim half at 71.39 place stop 71.26 on remaining half and resistance guidance. #oil #trading #chat

Oil chat room screen shot of next trade alert to trim long at 71.52 25 percent and hold 25 percent.

oil, trading, alert, chat, room
Oil chat room screen shot of next trade alert to trim long at 71.52 25 percent and hold 25 percent.

Final crude oil trade alert to close final 12.5 percent at 71.74 and hold 0 percent at chart resistance.

oil, crude, oil, trading, alert
Final crude oil trade alert to close final 12.5 percent at 71.74 and hold 0 percent at chart resistance.

And then the post EIA 1030 Wed trade alert with trading plan price targets were posted – usually wait 2nd 5 min candle

oil, trade, alerts, EIA, report
And then the post EIA 1030 Wed trade alert with trading plan price targets were posted – usually wait 2nd 5 min candle

And then this happened, oil shot up right through the price targets from the alert.

oi, trade, alert, price, targets, reached
And then this happened, oil shot up right through the price targets from the alert.

Winning streak continues. 100% live oil trade alert win rate for many weeks now. Time stamped real time. 

https://twitter.com/EPICtheAlgo/status/1010004212950843392

EPIC Oil Algorithm trade alert wins continue for many weeks now. Time stamped real time. 

oil, trade, alerts, winning, streak
EPIC Oil Algorithm trade alert wins continue for many weeks now. Time stamped real time. FX $USOIL $WTI $CL_F $USO #OIL #OOTT #Oiltradealerts #algorithm

Boom “3rd target hit. Trade thesis complete for #EIA. Next levels to follow. 

Boom "3rd target hit. Trade thesis complete for #EIA. Next levels to follow. Oil Algorithm (EPIC). June 20 1148 AM FX $USOIL $WTI $USO $UWT $DWT $CL_F #OIL #Algorithm #OOTT " pic.twitter.com/WAl4N9n2yH

— Melonopoly (@curtmelonopoly) June 20, 2018

First 3 targets intra if long side trade alert holds. Trim in add above or on pull back and turns up.

oil, trading, plan, chart, price, targets
First 3 targets intra if long side trade alert holds. Trim in add above or on pull back and turns up. Oil Algorithm (EPIC). June 20 1046 AM FX $USOIL $WTI $USO $UWT $DWT $CL_F #OIL #Algorithm #OOTT

Trade is using our 50% retrace on daytrade coding level intra as pivot.

oil, trade, alert, member, guidance, charting
Trade is using our 50% retrace on daytrade coding level intra as pivot Oil Algorithm (EPIC). June 20 1058 AM FX $USOIL $WTI $USO $UWT $DWT $CL_F #OIL #Algorithm #OOTT

Close up of intra day trading battle.

oil, trading, plan, chart, alert
Close up of intra day trading battle #daytrading Oil Algorithm (EPIC). June 20 1105 AM FX $USOIL $WTI $USO $UWT $DWT $CL_F #OIL #Algorithm #OOTT

1st of 3 targets hit. Curt didn’t get it but coding team did.

oil, algorithm, trading, alert
1st of 3 targets hit. Curt didn’t get it but coding team did. Oil Algorithm (EPIC). June 20 1121 AM FX $USOIL $WTI $USO $UWT $DWT $CL_F #OIL #Algorithm #OOTT

Up over 1st target longs want to trim in to 2nd target level.

live, oil, trade, in progress
Up over 1st target longs want to trim in to 2nd target level. Oil Algorithm (EPIC). June 20 1141 AM FX $USOIL $WTI $USO $UWT $DWT $CL_F #OIL #Algorithm #OOTT

3rd target hit. Trade thesis complete for #EIA. Next levels to follow.

oil, trade, alerts, targets, complete
3rd target hit. Trade thesis complete for #EIA. Next levels to follow. Oil Algorithm (EPIC). June 20 1148 AM FX $USOIL $WTI $USO $UWT $DWT $CL_F #OIL #Algorithm #OOTT

Daytrading support and resistance fractals (white arrows key).

daytrade, oil, alert, guidance, chart
Daytrading support and resistance fractals (white arrows key) Oil Algorithm (EPIC). June 20 1209 PM FX $USOIL $WTI $USO $UWT $DWT $CL_F #OIL #Algorithm #OOTT

Recent Oil Algorithm Price Target Hits:

Wed 1030 EIA report lower price target a perfect hit published on weekend report. Oil Algorithm (EPIC). FX $USOIL $WTI $USO $UWT $DWT $CL_F #OIL #Algorithm #OOTThttps://twitter.com/EPICtheAlgo/status/1024665109338222592

Wed 1030 EIA report lower price target a perfect hit published on weekend report.

Oil, algorithm, price, target, hit, EIA
Wed 1030 EIA report lower price target a perfect hit published on weekend report. Oil Algorithm (EPIC). FX $USOIL $WTI $USO $UWT $DWT $CL_F #OIL #Algorithm #OOTT

Tues 430 lower price target a perfect hit, as published on weekend report. Oil Algorithm (EPIC). FX $USOIL $WTI $USO $UWT $DWT $CL_F #OIL #Algorithm #OOTT

https://twitter.com/EPICtheAlgo/status/1024447086102827011

Tues 430 lower price target a perfect hit published on weekend report. Oil Algorithm (EPIC). FX $USOIL $WTI $USO $UWT $DWT $CL_F #OIL #Algorithm #OOTT

Oil, algorithm, price, target, hit
Tues 430 lower price target a perfect hit published on weekend report. Oil Algorithm (EPIC). FX $USOIL $WTI $USO $UWT $DWT $CL_F #OIL #Algorithm #OOTT

Oil Intra-Day Algo Trading Quadrants (white dotted lines):

Trading quadrants are simply support and resistance lines that can assist your intra-day trading – they are not alpha or primary support and resistance by any measure. Price action does however typically move more assertively when leaving a trading quadrant.

Indicator Methods:

As explained above, my algorithm is a consideration of up to fifty traditional indicators at any one time – each one given its own weight in accordance to its accuracy (win rate). This is how we establish the probability of specific targets hitting (we call them alpha algo targets).

Alpha Algo Targets, Algo Trend-lines, Algo Timing, Quadrants for Intra Snipes

Algo targets are the red circles – they correspond with important times each week in oil reporting land. Tuesday 4:30 PM, Wednesday 10:30 AM and Friday at 1:00 PM. The red dotted diagonal lines are the algo trend-lines. And the vertical dotted (red or green) are marking the important times each week. You will find that the price of crude will hit one of the alpha algo targets about 90% of the time. In the absence of market direction the machines take price to the next algo line and/or target. Understanding how the price of crude reacts to the algos and how they move price from target to target is critical for intra-day and swing trading crude oil and associated instruments.

You will notice that price action of crude will use these algo trend-lines and act as support and resistance, and that price also often violently moves when an alpha algo line is breached either upward or downward.

We cover this in much more detail in the member updates, trading room. A review of my Twitter feed and previous blog posts will help you understand the relation of these indicators. We will start posting video blogs (for my subscribers) on YouTube (in addition to my daily blog posts) for swing traders that work during regular trading hours.

Also… we will cover how to establish algo trend-lines and price targets future forward (as you have seen me do on my Twitter feed for some time now).

Conclusion:

See you in the live trade room! And again, if you struggle to know how to use these indicators as a trader’s edge, it is recommended (if you have earnestly reviewed all of our documentation first) that you obtain private coaching prior to trading a real account with real money – we recommend you use a paper trading account at first.

You can also send specific questions to our email inbox at [email protected] – if you do this be sure to ask a specific question so it can be answered specifically. When the 24 hour oil trading room opens you will have ample opportunity in that 24 hour room to ask questions also.

Watch my EPIC the Oil Algo Twitter feed for intra day notices and your email in box for member only material intra day also.

EPIC the Oil Algo

Subscribe to my Service here:

Standalone Oil Algorithm Newsletter (member charting sent out weekly).

Real-Time Oil Trading Alerts (Private Twitter feed).

Oil Trading Room Bundle (includes weekly newsletter charting and real-time trading alerts on Twitter).

Commercial / Institutional Multi User License (for professional trading groups).

One-on-One Trade Coaching (Via Skype or in person).

Temporary Discount Offers (New members only):

30% Off Oil Newsletter: Use Promo Coupon Code “epic30” When Subscribing to our Weekly Oil Newsletter Here: https://compoundtrading.com/product/standalone-epic-newsletter/ (cancel anytime, for new members only to trial the service).

30% Off Oil Alerts: Use Promo Coupon Code “oilalerts30” for Real-Time Oil Trade Alerts via Private Twitter Feed @OilAlerts_CT Here: https://compoundtrading.com/product/live-oil-trading-alerts/?attribute_plan=One+Month (cancel anytime, for new members only to trial the service).

Click here to find all information and pricing on Oil Newsletter, Trading Chat Room, Oil Alerts and more.

Connect:

Register to free email list for trade set-ups, webinars, special events: https://compoundtrading.com/contact/

Website: https://compoundtrading.com

Blog: https://compoundtrading.com/blog/

Free chat room: https://discord.gg/2HRTk6n

Subscribe: https://compoundtrading.com/overview-…

Twitter: https://twitter.com/CompoundTrading

Lead Trader: https://twitter.com/curtmelonopoly

Tradingview: https://www.tradingview.com/u/curtmel…

Facebook: https://www.facebook.com/compoundtrad…

StockTwits: https://stocktwits.com/compoundtrading

Email: https://[email protected]

Curtis Melonopoly (@curtmelonopoly) is rated Top 250 Stock exchanges authority, covering also Mathematical finance and Economy of the United States

Tweets by EPICtheAlgo


Article topics: EPIC, Oil, Algorithm, Trading, Alerts, Crude, $USOIL, $WTI, $USO, $UCO, $CL_F, $UWT, $DWT, Chart


Read More
Oil Algorithm Trading Report (EPIC) Sun Aug 12 FX: $USOIL $WTI $CL_F $USO #Oil #Trading #Algorithm

Oil Algorithm Trading Report (EPIC) Sun Aug 12 FX: $USOIL $WTI $CL_F $USO #Oil #Trading #Algorithm

August 12, 2018December 23, 2018 Epic the AlgoCrude Oil Trading Algorithm (EPIC)$CL_F, $UCO, $USO, $USOIL, $UWT, $WTI, Alerts, Algorithm, Chart, Crude, DWT, EPIC, Oil, Trading

Crude Oil Trading Algorithm Chart Report (EPIC) Sunday Aug 12, 2018.

FX: $USOIL $WTI $USO $CL_F $UWT $DWT $UCO $SCO $ERX $ERY $GUSH $DRIP

Welcome to the oil trading algorithm report. My name is EPIC the Oil Algorithm and I am one of seven primary Algorithmic Chart Models in development at Compound Trading Group (there are near 300 in total in development at various stages for all markets).

NOTICES:

New members to our oil algorithm charting model are encouraged to on-board in a way that equips you as an oil trader for profit.

Visit my Twitter feed EPIC Oil Algorithm Twitter (@EPICtheAlgo) and review tweets over the last few months, visit our blog and review the recent oil algorithm blog posts, our You Tube channel “how my oil algorithm works”, “how to use my charting”, weekly EIA oil report videos and our website (it explains how the oil algorithm was developed). Reviewing those important points of reference will increase your probability of success considerably. This report includes links to some recent example “how-to” videos.

Oil Trade Coaching – Users of this algorithmic oil charting model may opt for private one-on-one coaching with our lead trader and / or an experienced trader that has worked under our lead trader. On our website standard one-on-one online coaching packages are made available (coaching via Skype) or you can request a customized package (reflecting the time you wish to invest in learning). To request a custom package suited to your needs email [email protected] or click here for standard private trade coaching packages. Other options for coaching include online webinars and private on location (in person) coaching sessions. 

Oil Trading – How to Use the Oil Algorithm

Oil Trading – How to Trade Intra-day with my Algorithmic Charting

Oil Trading Alerts. Live Lead Trader Video Trading w EPIC Oil Algorithm

Recent articles from our blog about how to trade crude oil with our oil trading algorithm; 

Crude Oil Trading Face-Off Results “Pro Trader” (Man) vs. EPIC Oil Algorithm (Machine Trading Tech).

“The Nut Hand” Today’s Huge Oil Trade Win. Exactly How It Was Done. How I Knew & How You Can Too.

MULTI-USERS: Institutional / commercial platform now available.

SOFTWARE: My algorithmic charting is planned to go to developer coding phase for our trader’s dashboard program. Please review my algorithm development process, about my oil algorithm story on our website www.compoundtrading.com and my oil algo charting posts on my Twitter feed and/or this blog.

HOW MY ALGORITHM WORKS: I am an oil algorithm model in development. My math is based on traditional indicators (up to fifty at any given time each weighted on win ratio merit – all not shown on chart at any given time) – such as simple math calculations relating to price and volume, Fibonacci, simple pivots, moving averages, Gann, Schiff and various other charting, geometric and mathematical factors. I do not yet have AI integration – only math as it relates to traditional indicators with the primary goal being probabilities. I am not a high frequency robot type algorithm – I am presented on (and used on) a traditional trading chart as one would normally use as a probability indicator. The goal is to provide our trader’s with an edge when triggering entries and exits on trades with instruments that rely on the price of crude oil.

Below you will find simplified levels represented on a traditional chart (both intra-day and as a swing trader or investor). This work (and associated trade) should be considered one decision at a time, “if this happens then this or this are my targets”… price – trigger – trade and so on. Questions to; [email protected], message our lead trader on Twitter, or message a lead trader in the private Discord oil trade room server.

Visit this link for more information about my oil algorithm development, this link explains how our algorithmic charting is done, this YouTube video explains in summary how my algorithm works https://www.youtube.com/watch?v=LUNyxFoXJp8 this link for more information about our algorithmic stock charting models and what makes them different than most.

EVERY CALL WE MAKE, EVERY PUBLIC INTERACTION, REPRESENTATION OF TRADE SIGNAL (ON EVERY VENUE) IS VIDEO RECORDED, ON SOCIAL MEDIA OR ON BLOG / WEBSITE TIME-STAMPED FOR PERMANENT RECORD AND TRANSPARENCY. PLEASE ALSO REFER TO OUR PUBLIC DISCLOSURE https://compoundtrading.com/disclosure-disclaimer/.

Oil Algorithm Observations:

Below is a link for the live chart version of EPIC the Oil Algorithm. The charting is a real-time trading chart represented on FX $USOIL $WTI published Aug 12, 2018.

Click on share button (bottom right beside flag) and when that screen opens click on “make it mine” to view real-time, make edits etc:

Oil Algorithm (EPIC). Current trade. Aug 12 909 PM FX $USOIL $WTI $USO $UWT $DWT $CL_F #OIL #Algorithm #OOTT

https://www.tradingview.com/chart/USOIL/ObflfZwf-Oil-Algorithm-EPIC-Current-trade-Aug-12-909-PM-FX-USOIL-WT/

EPIC, Oil, Algorithm, trading, current
Oil Algorithm (EPIC). Current trade. Aug 12 909 PM FX $USOIL $WTI $USO $UWT $DWT $CL_F #OIL #Algorithm #OOTT

Aug 12, 2018

New: The new trade signals are the machine trading lower / tighter day-trading time frames (overlay charting versions we are beginning to share).

The first most predictable trade are the resistance and support cluster areas formed by long term chart trend lines (see charts that have trend-lines represented in red as made available below).

The second most predictable trade (wide trading range primary resistance and support that become predictable buy and sell triggers). Current algorithmic model wide trading range resistance (grey arrow – grey horizontal line) at approximately 68.92 in the current trading range. Current algorithmic model wide trading range support (grey arrow – grey horizontal line) at approximately 65.32 in the current trading range – these areas are general range support and resistance areas (our algorithm uses a .15 – .20 cent buffer on either side for these trades). Trading between the resistance / support horizontal grey lines is extremely profitable risk – reward if one is disciplined to the patience required and follows the trend of trade.

The lower trading range is 61.71 to 65.31. The upper trading range 68.93 to 72.54.

Trading Bias / Forward Guidance: As with previous report, range bound. Slightly bearish to range support at 65.32 for the week.

Current (as of Aug 12, 2018) MACD is down on the daily oil chart.

Third most predictable trade (support and resistance of uptrend or down trend channels). On the chart an upward trending trade channel is presented and a downward option (channel support and resistance / trading range is represented as diagonal dotted orange lines and purple arrows – as made available, assist in displaying directional trade decision areas).

Fourth most predictable trade (support and resistance of 30 min quadrants). The diagonal lines make up quadrants (in this instance on a 30 min chart) and are represented as orange diagonal lines that make up geometric diamond shapes. These lines also assist in intra-day trade.

Fifth most predictable trade (support and resistance of most applicable Fibonacci) the Fib support and resistance lines are the horizontal lines in various colors with the exception of purple and yellow (see below). These horizontal lines become support and resistance for intra-day trade.

Sixth most predictable trade (support and resistance of historical support and resistance) Natural / historical support and resistance lines shown in purple or yellow – they represent historical support and resistance. The strongest of the historical support and resistance lines are shown in yellow horizontal and are typically accompanied by a yellow arrow marker.

Seventh most predictable trade signal we use are the time and price targets (red circles). When trade is in a significant uptrend or downtrend the targets become very precise and move up the indicator priority list quick.

Tues, Wed and Fri targets are most predictable in extended multi week uptrends or downtrends. In recent time, trade could be described as range-bound in recent downtrend.

The Eighth most predictable trade is intra-day. You will notice on some of the charting geometric shapes in green on some of my charting (at times). They are charted live in the trading room and at times the lead trader will highlight these areas intra with white outlines (typically geometric shapes such as diamonds or triangles).

Intra-day Trading Bias

Intra day bias is short – based on wide range resistance at top of quad.

Wide Trading Range – Buy and Sell Triggers for Swing Trading Crude Oil:

Trade the ranges noted above between the thick grey lines (grey arrows) for the most predictable swing trades between 58.13 to 61.72, 61.72 to 65.32, 65.32 to 68.92, 68.93 to 72.54 and 72.54 to 76.15. This is a highly profitable risk-reward way to trade oil if you can be patient to trigger at only the break of the wide range charting areas and are disciplined to cut a losing trade that does not prove in your anticipated trend.

Or trade the range between the channel diagonal lines at support and resistance in up or down channel (orange dotted diagonals).

Oil Algorithm (EPIC). Up trend channel chart. Aug 12 920 PM FX $USOIL $WTI $USO $UWT $DWT $CL_F #OIL #Algorithm #OOTT

Oil, up, channel, algorithm, trading
Oil Algorithm (EPIC). Up trend channel chart. Aug 12 920 PM FX $USOIL $WTI $USO $UWT $DWT $CL_F #OIL #Algorithm #OOTT

Oil Algorithm (EPIC). Down trend channel chart. Aug 12 922 PM FX $USOIL $WTI $USO $UWT $DWT $CL_F #OIL #Algorithm #OOTT

oil, trading, algorithm, down, channel
Oil Algorithm (EPIC). Down trend channel chart. Aug 12 922 PM FX $USOIL $WTI $USO $UWT $DWT $CL_F #OIL #Algorithm #OOTT

Oil Machine Trading Algorithm Charting Overlay.

Below is the first of many time-frames we will be sharing with our members that our algorithm software coding team is using to develop our intelligent assisted oil trader platform.

Please note: It is not advisable to trade these chart overlays until you have had some experience with them. How to trade the machine trading day trade chart videos will be forthcoming. The shorter time fram overlays on the chart below also cause the chart to be considerably more “noisy” so please use caution.

Oil Algorithm (EPIC). Machine trading daytrade time-frame. Aug 12 929 PM FX $USOIL $WTI $USO $UWT $DWT $CL_F #OIL #Algorithm #MachineTrading

https://www.tradingview.com/chart/USOIL/aq5CPdfw-Oil-Algorithm-EPIC-Machine-trading-daytrade-time-frame-Aug-1/

machine, trading, oil, algorithm
Oil Algorithm (EPIC). Machine trading daytrade time-frame. Aug 12 929 PM FX $USOIL $WTI $USO $UWT $DWT $CL_F #OIL #Algorithm #MachineTrading

Oil Swing Trade Charting.

Monthly Oil Chart:

Oil Monthly Chart. Price above 200 MA below pivot MACD trend up, Stoch RSI down. Aug 12 936 PM FX $USOIL $WTI $USO $UWT $DWT $CL_F #OIL #chart

Monthly, oil, chart
Oil Monthly Chart. Price above 200 MA below pivot MACD trend up, Stoch RSI down. Aug 12 936 PM FX $USOIL $WTI $USO $UWT $DWT $CL_F #OIL #chart

Oil Monthly Chart. Price above 200 MA at pivot under 100 MA MACD trending up. Aug 7 523 AM FX $USOIL $WTI $USO $UWT $DWT $CL_F #OIL #chart

Monthly, oil, chart, pivot
Oil Monthly Chart. Price above 200 MA at pivot under 200 MA MACD trending up. Aug 7 523 AM FX $USOIL $WTI $USO $UWT $DWT $CL_F #OIL #chart

Weekly Oil Chart:

Oil Algorithm Simple Weekly Gen 1 Model. Highlighted trend structure seems bearish on this weekly chart. Aug 12 942 PM FX $USOIL $WTI $USO $UWT $DWT $CL_F #OIL #Algorithm #OOTT

https://www.tradingview.com/chart/USOIL/F30KGkeE-Oil-Algorithm-Simple-Weekly-Gen-1-Model-Highlighted-trend-struc/

Oil, weekly, chart, algorithm, model
Oil Algorithm Simple Weekly Gen 1 Model. Highlighted trend structure seems bearish on this weekly chart. Aug 12 942 PM FX $USOIL $WTI $USO $UWT $DWT $CL_F #OIL #Algorithm #OOTT

Oil Algorithm Simple Weekly Gen 1 Model. Oil Continues bullish structure on weekly chart. Aug 7 536 AM FX $USOIL $WTI $USO $UWT $DWT $CL_F #OIL #Algorithm #OOTT

https://www.tradingview.com/chart/USOIL/FMjUJic9-Oil-Algorithm-Simple-Weekly-Gen-1-Model-Oil-Continues-bullish-s/

Oil, algorithm, weekly, trading, chart
Oil Algorithm Simple Weekly Gen 1 Model. Oil Continues bullish structure on weekly chart. Aug 7 536 AM FX $USOIL $WTI $USO $UWT $DWT $CL_F #OIL #Algorithm #OOTT

May 21 – A feature post was published this week to review time cycles, retrace possibilities on the other side of time cycles on the weekly charts. Below is the post link:

Feature Post: 12 of Last 13 Oil Chart Time-Cycles Have Trend Reversal. $USOIL $WTI $CL_F $USO $UCO $UWT $DWT #OIL #OOTT

Daily Oil Chart:

Oil Daily Chart. MACD cross up failed, trade under 50 MA. Bearish trend continues. Aug 12 947 PM FX $USOIL $WTI $USO $UWT $DWT $CL_F #OIL #chart

https://www.tradingview.com/chart/USOIL/NFTJvJNw-Oil-Daily-Chart-MACD-cross-up-failed-under-50-MA-Bearish/

oil, daily, chart, 50MA, MACD
Oil Daily Chart. MACD cross up failed, trade under 50 MA. Bearish trend continues. Aug 12 947 PM FX $USOIL $WTI $USO $UWT $DWT $CL_F #OIL #chart

Oil Monthly Chart. Oil has a bounce at 50 MA with MACD pinch possible cross up . Aug 7 551 AM FX $USOIL $WTI $USO $UWT $DWT $CL_F #OIL #chart

https://www.tradingview.com/chart/USOIL/O13OzkXH-Oil-Monthly-Chart-Oil-has-a-bouonce-at-50-MA-with-MACD-pinch/

oil, chart, daily, MACD, 50 MA
Oil Monthly Chart. Oil has a bounce at 50 MA with MACD pinch possible cross up . Aug 7 551 AM FX $USOIL $WTI $USO $UWT $DWT $CL_F #OIL #chart

Diagonal Trend Lines:

Diagonal trend-lines are critical inflection points (currently represented in red below on our conventional charting).

Please review many of my recent posts so you can learn about how important these diagonal trend-lines are. If one is breached you can look to pull-back to next diagonal trend line about 90% of the time. Also pay attention to how thick the lines are – the thicker the line the more important because they represent extensions from previous time / price cycles.

Remember you can come in to the chat room to message the trader and REMEMBER I have posted a live chart link in this post so if you can’t see the lines well on this chart above you can go to the live chart link and watch for member live algo chart links through-out the day in your email inbox!

The diagonal trend-lines are marked on chart below:

Oil Chart (Weekly). Oil trend lines on weekly time-frame. Aug 12 951 PM FX $USOIL $WTI $USO $UWT $DWT $CL_F #OIL

oil, trend lines, chart
Oil Chart (Weekly). Oil trend lines on weekly time-frame. Aug 12 951 PM FX $USOIL $WTI $USO $UWT $DWT $CL_F #OIL

Oil Chart (Weekly). Oil trend lines on weekly time-frame. Aug 7 605 AM FX $USOIL $WTI $USO $UWT $DWT $CL_F #OIL

https://www.tradingview.com/chart/USOIL/bS8T4ism-Oil-Chart-Weekly-Oil-trend-lines-on-weekly-time-frame-Aug-7/

Oil, trend line, chart
Oil Chart (Weekly). Oil trend lines on weekly time-frame. Aug 7 605 AM FX $USOIL $WTI $USO $UWT $DWT $CL_F #OIL

Previous posts for perspective;

Oil has now cleared every trendline resistance provided on conventional charting I’ve posted last year. $USOIL $WTI $CL_F #OOTT #OIL $USO $UWT $DWT 233 PM Jan 1

Oil, trendline, resistance, chart
Oil has now cleared every trendline resistance provided on conventional charting I’ve posted last year. $USOIL $WTI $CL_F #OOTT #OIL $USO $UWT $DWT 233 PM Jan 1
$USOIL, $WTI, Chart, Trendlines
Simple lines show expose clusters of resistance. Crude algo intra work sheet 201 AM Apr 10 FX $USOIL $WTIC #OIL $CL_F CL $USO $UCO $SCO $UWT $DWT #OOTT

Notice when the daily chart is opened, the simple lines extend to current day trade.

Daily chart view. Simple lines show expose clusters of resistance. Crude algo intra work sheet 213 AM Apr 10 FX $USOIL $WTIC #OIL $CL_F CL $USO $UCO $SCO $UWT $DWT #OOTT

Daily, $USOIL $WTI, Chart, Trendlines
Daily chart view. Simple lines show expose clusters of resistance. Crude algo intra work sheet 213 AM Apr 10 FX $USOIL $WTIC #OIL $CL_F CL $USO $UCO $SCO $UWT $DWT #OOTT

Fibonacci Levels:

Watch the lines for support and resistance. Careful using them as traditional retracement levels with crude because the algo lines etc are more dominant / predictable. But the Fib lines are excellent indicators for intra-day trade support and resistance.

The Fibonacci lines are marked on main chart above.

Horizontal Trend-Lines (purple):

Horizontal trend-lines are not as important as the other indicators reviewed above, however, they do serve as important resistance and support intra-day for tight trading and they are important if thick (in other words they come from previous time / price cycles). WE STARTED TO REPRESENT THE REALLY IMPORTANT LINES IN YELLOW FYI FOR EASE. Refer to chart for current applicable horizontal trend-lines.

Horizontal trend-lines are marked on charts above.

Oil Time / Price Cycles:

Watch your email and / or my Twitter feed for time price cycles they may start to terminate.

Time / price cycles are the single most important indicator and my record calling them is near 100% – since inception seven months ago. The reason they are so important is that a trader does not want to be holding a crude oil instrument at termination of a time cycle if not absolutely sure if price will go up or down. A trade may choose to enter a large position in advance of a time price cycle termination IF THERE IS A HIGH PROBABILITY OF A DIRECTION IN PRICE and if the market is trading at a really important pivot area. In other words, if the market is trading at the bottom of the upward trending channel at a support (yellow lines) and we knew there was a significant probability of a time cycle about to terminate a trader may enter with a long position. The price really spikes or drops significantly when these important time cycles terminate.

The problem with time / price cycle terminations is they change from minute to minute (depending on where price is on the chart) so you have to be in the trade room to get the alert. Our lead traders will do everything they can in future to send these on SMS but we have to be careful because it can be difficult with so much going on in the room. The reason they (time cycles) change is because they are actually represented by or are geometric shapes in the chart – I know it sounds odd but I have (as I mentioned) hit these calls just shy of 100%. The oil political people know the same algorithmic modeling principles and they ALWAYS TIME THEIR BIG ANNOUNCEMENTS AROUND THE TIME PRICE CYCLE TERMINATIONS.

So if you can picture a triangle on the chart – and price is trading in the triangle – and price is going to come to the edge of the triangle and there is a significant support or resistance or an algo line terminating there too or a target (those type of indications)… then we know there is a high probability of a time and price change. In other words, it is where there are clusters of algorithm points that cross and when price is going to cross over that cluster is where they are. And these are represented on all the different time frames – the larger the time frame – the larger the time price cycle termination – the larger the spike or downdraft. This is where we establish our intra-day quadrants from for sniping trades (which we will put in to the room soon because it looks like the geo political rhetoric is over for a while making them more predictable). Difficult to explain in short. So we will do our best to SMS alert these in future.

Also, the real large or important time / price cycle terminations we know far in advance and they can be put in these newsletters.

If you review my Epic the Oil Algo Twitter feed, my blog posts and my story on our website you will get a feel for how accurate these calls are.

Alpha Algo Trading Trend-Lines (Primary – Red dotted lines. Secondary – White dotted lines):

To determine which algo line is most alpha (or probable) intra day, it is the nearest line to price action. This can also help you determine the trend of trade. If the algo line is trending up the price will follow it up until price is tested at an algorithm indicator (the main tests are diagonal trendlines, horizontal trendlines, time / price cycles etc – as I have shared with you). This is why it is important to watch all the lines because they are all support and resistance. To keep it simple trade the range (yellow lines) as I’ve mentioned but keep an eye on these indicators.

Current Alpha Algo Targets (Red circles):

Your closest target that crude is trending toward is always the most probable.Then, your second most probable is the one that is up or down trend depending on whether general price is in an upward or downtrend for the most recent week or so and what your other indicators look like (such as the MA’s I explained above).

The other way to determine which targets are in play is actually quite simple, you will notice that crude trades between the channel lines up and down and up and down and there are various support and resistance along the way. If it hits a target at the top of the channel you can bet most times (unless the next day like today) that the next target hit will be at the bottom of the channel.

Wait for the price to trend toward a target and take your position and watch as price gets closer and closer to the target. Remember, that the machines trade from decision to decision – or in other words from support to next resistance or resistance to next support or when the times come each week on Tuesday Wednesday and Friday they will trend toward the target that market price action determines they go to.

Our lead trader will explain more in the room and do not hesitate to ask our lead trader in the room by private message or on twitter to explain intra day decisions.

Recent Live Crude Oil Trade Alerts (samples):

The most recent trades are found in this recent report:

Crude Oil Trading Face-Off Results “Pro Trader” (Man) vs. EPIC Oil Algorithm (Machine Trading Tech)

Click on feature post for recent crude oil trading alerts blog post; Oil Trading Alerts Live Video w EPIC Oil Algorithm #EIA Report #Oil #Trading #Algorithm #Alerts $USOIL $WTI $CL_F

Oil trade alert to start the week 68.61 long, 68.85 closed. Win rate high 90% – ask for a tour. Time stamped, recorded, live alerts. 

https://twitter.com/EPICtheAlgo/status/1026287786113081344

Oil trade alert to start the week 68.61 long, 68.85 closed. 

oil, trading, alert
Oil trade alert to start the week 68.61 long, 68.85 closed. EPIC Oil Algorithm $USOIL $WTI $CL_F #OilTradeAlerts $UWT $DWT

Oil trade alert to start the week 68.61 long, 68.85 closed (Part 2). 

Crude, oil, trade alert, PT2
Oil trade alert to start the week 68.61 long, 68.85 closed (Part 2). EPIC Oil Algorithm $USOIL $WTI $CL_F #OilTradeAlerts $UWT $DWT

Machine trading 🙂 

Machine trading 🙂 $USOIL $WTI $CL_F #OIL #Algorithmic #trading #alerts pic.twitter.com/Hja5Tbgmob

— Melonopoly (@curtmelonopoly) August 3, 2018

A scalp to start the day. Multi-month winning streak continues. Ask for a tour of the feed if you need proof. 

A scalp to start the day. Multi-month winning streak continues. Ask for a tour of the feed if you need proof. EPIC Oil Algorithm FX $USOIL $WTI #CL $USO $UWT $DWT #OOTT #Oil #trading #algorithm pic.twitter.com/JTHCMp58Cv

— Melonopoly (@curtmelonopoly) July 27, 2018

100% personal alerted oil trade win rate documented, recorded, alerted real time to feed continues for months (we did have one loss alert by a tech a few weeks back). 

100% personal alerted oil trade win rate documented, recorded, alerted real time to feed continues for months (we did have one loss alert by a tech a few weeks back). EPIC the Oil Algorithm FX $USOIL $WTI $USO $UWT $DWT #OIl #OOTT #Trading @EPICtheAlgo pic.twitter.com/pKL1iKE5T1

— Melonopoly (@curtmelonopoly) July 25, 2018

Live oil trade alert. Long 69.06 US OIL WTI 1 5th sizing EPIC Oil Algorithm.

oil, trade, alerts, WTI
Live oil trade alert. Long 69.06 US OIL WTI 1 5th sizing EPIC Oil Algorithm $USOIL $WTI #OIL #OOTT $UWT $DWT $USO

Live oil trade alert. Trim 50 percent 69.30. EPIC Oil Algorithm.

oil, trading, alerts, crude
Live oil trade alert. Trim 50 percent 69.30. EPIC Oil Algorithm $USOIL $WTI #OIL #OOTT $UWT $DWT $USO #trading #alerts

Live oil trade alert. Long 68.93 add 50 percent. EPIC Oil Algorithm. 

oil, trading, alert, long
Live oil trade alert. Long 68.93 add 50 percent. EPIC Oil Algorithm $USOIL $WTI #OIL #OOTT $UWT $DWT $USO #trading #alerts

Live oil trade alert. Trim other 50 percent 69.26 50 percent.

Live, oil, trade, alert, trim
Live oil trade alert. Trim other 50 percent 69.26 50 percent. EPIC Oil Algorithm $USOIL $WTI #OIL #OOTT $UWT $DWT $USO #trading #alerts

Overnight oil trade: short 72.79 add 72.71 cover 72.27s-72.35s. Not cleanest trade but HUGE win. 100% win rate continues (for months). Guidance detail in oil trading room (to expect heat). Live alerts, time stamped, recorded.

https://twitter.com/EPICtheAlgo/status/1015202909041102849

Overnight oil trade short 72.79 add 72.71 cover 72.27s to 72.35s. Not cleanest trade but HUGE win. 100% win rate continues 

Oil, trade, alert, short
Overnight oil trade short 72.79 add 72.71 cover 72.27s to 72.35s. Not cleanest trade but HUGE win. 100% win rate continues $USOIL $WTI $USO #OIL #Trading #Alerts

Member guidance in oil chat room this morning “i’ll be selling spikes in to resistance until it doesn’t work – the larger more obvious i’ll alert against downtrend upper channel orange dotted etc” 

https://twitter.com/EPICtheAlgo/status/1014943645974323204

Member guidance this morning i’ll be selling spikes in to resistance until it doesn’t work 

Oil, chat, trading, room, guidance
Member guidance this morning i’ll be selling spikes in to resistance until it doesn’t work $USOIL $WTI $USO $UWT $DWT EPIC Oil Algorithm #oil #trading #alerts

Scalp day. 100 percent win rate for months continues. Time stamped, live alerted, recorded. 

https://twitter.com/EPICtheAlgo/status/1014938308961595393

100 percent win rate for months continues. Time stamped, live alerted, recorded. 

oil, trade, alerts, winning, rate, ,best
100 percent win rate for months continues. Time stamped, live alerted, recorded. $USOIL $WTI $USO $UWT $DWT EPIC Oil Algorithm #oil #trading #alerts

Oil trading chat room member guidance and intra day daytrading charting example ‘70.02 would be the swing retrace. So the thesis is sound but you may have pain before potential drop”.

oil, trading, chat, room, guidance
70.02 would be the swing retrace. So the thesis is sound but you may have pain before potential drop.

Oil trading chat room member guidance and intra day daytrading charting example “Target is in 70.70 area so I will likely give this lots of room swing if I have to. We’ll see”.

oil, trade, alert, price, targets
Target is in 70.70 area so I will likely give this lots of room swing if I have to. We’ll see. FX $USOIL $WTI #OilTrading

Oil trading chat room member guidance and intra day daytrading charting example “Machines defending the retrace intra day”.

oil, machine, trading, WTI
Machines defending the retrace intra day FX $USOIL $WTI #OIL #Algorithm

Trims / close longs 71.39 to 71.71 oil trade alert. 

https://twitter.com/EPICtheAlgo/status/1011981290051129346

Long 71.21 oil trade alert with the one add. 

https://twitter.com/EPICtheAlgo/status/1011980052198719488

Today’s #EIA oil trade with Oil Algorithm (EPIC) Live alert entries (green) exits (red).

https://twitter.com/EPICtheAlgo/status/1011977209442177026

Screen shot member oil chat room first oil trade alert of day – Long 71.21 hoping we squeeze in to EIA

EIA, oil, trading, chat, room
Screen shot member oil chat room first oil trade alert of day – Long 71.21 hoping we squeeze in to EIA

One minute algorithmic on the fly chart trade came off after initial long side oil trade alert- see green arrow. 

oil, trade, alert, chart, trades
One minute algorithmic on the fly chart trade came off after initial long side oil trade alert- see green arrow. #oiltradealert #oil

Screen shot of alert to trim half at 71.39 place stop 71.26 on remaining half and resistance guidance. 

oil, trade, alert, trim, position
Screen shot of alert to trim half at 71.39 place stop 71.26 on remaining half and resistance guidance. #oil #trading #chat

Oil chat room screen shot of next trade alert to trim long at 71.52 25 percent and hold 25 percent.

oil, trading, alert, chat, room
Oil chat room screen shot of next trade alert to trim long at 71.52 25 percent and hold 25 percent.

Final crude oil trade alert to close final 12.5 percent at 71.74 and hold 0 percent at chart resistance.

oil, crude, oil, trading, alert
Final crude oil trade alert to close final 12.5 percent at 71.74 and hold 0 percent at chart resistance.

And then the post EIA 1030 Wed trade alert with trading plan price targets were posted – usually wait 2nd 5 min candle

oil, trade, alerts, EIA, report
And then the post EIA 1030 Wed trade alert with trading plan price targets were posted – usually wait 2nd 5 min candle

And then this happened, oil shot up right through the price targets from the alert.

oi, trade, alert, price, targets, reached
And then this happened, oil shot up right through the price targets from the alert.

Winning streak continues. 100% live oil trade alert win rate for many weeks now. Time stamped real time. 

https://twitter.com/EPICtheAlgo/status/1010004212950843392

EPIC Oil Algorithm trade alert wins continue for many weeks now. Time stamped real time. 

oil, trade, alerts, winning, streak
EPIC Oil Algorithm trade alert wins continue for many weeks now. Time stamped real time. FX $USOIL $WTI $CL_F $USO #OIL #OOTT #Oiltradealerts #algorithm

Boom “3rd target hit. Trade thesis complete for #EIA. Next levels to follow. 

Boom "3rd target hit. Trade thesis complete for #EIA. Next levels to follow. Oil Algorithm (EPIC). June 20 1148 AM FX $USOIL $WTI $USO $UWT $DWT $CL_F #OIL #Algorithm #OOTT " pic.twitter.com/WAl4N9n2yH

— Melonopoly (@curtmelonopoly) June 20, 2018

First 3 targets intra if long side trade alert holds. Trim in add above or on pull back and turns up.

oil, trading, plan, chart, price, targets
First 3 targets intra if long side trade alert holds. Trim in add above or on pull back and turns up. Oil Algorithm (EPIC). June 20 1046 AM FX $USOIL $WTI $USO $UWT $DWT $CL_F #OIL #Algorithm #OOTT

Trade is using our 50% retrace on daytrade coding level intra as pivot.

oil, trade, alert, member, guidance, charting
Trade is using our 50% retrace on daytrade coding level intra as pivot Oil Algorithm (EPIC). June 20 1058 AM FX $USOIL $WTI $USO $UWT $DWT $CL_F #OIL #Algorithm #OOTT

Close up of intra day trading battle.

oil, trading, plan, chart, alert
Close up of intra day trading battle #daytrading Oil Algorithm (EPIC). June 20 1105 AM FX $USOIL $WTI $USO $UWT $DWT $CL_F #OIL #Algorithm #OOTT

1st of 3 targets hit. Curt didn’t get it but coding team did.

oil, algorithm, trading, alert
1st of 3 targets hit. Curt didn’t get it but coding team did. Oil Algorithm (EPIC). June 20 1121 AM FX $USOIL $WTI $USO $UWT $DWT $CL_F #OIL #Algorithm #OOTT

Up over 1st target longs want to trim in to 2nd target level.

live, oil, trade, in progress
Up over 1st target longs want to trim in to 2nd target level. Oil Algorithm (EPIC). June 20 1141 AM FX $USOIL $WTI $USO $UWT $DWT $CL_F #OIL #Algorithm #OOTT

3rd target hit. Trade thesis complete for #EIA. Next levels to follow.

oil, trade, alerts, targets, complete
3rd target hit. Trade thesis complete for #EIA. Next levels to follow. Oil Algorithm (EPIC). June 20 1148 AM FX $USOIL $WTI $USO $UWT $DWT $CL_F #OIL #Algorithm #OOTT

Daytrading support and resistance fractals (white arrows key).

daytrade, oil, alert, guidance, chart
Daytrading support and resistance fractals (white arrows key) Oil Algorithm (EPIC). June 20 1209 PM FX $USOIL $WTI $USO $UWT $DWT $CL_F #OIL #Algorithm #OOTT

Recent Oil Algorithm Price Target Hits:

Wed 1030 EIA report lower price target a perfect hit published on weekend report. Oil Algorithm (EPIC). FX $USOIL $WTI $USO $UWT $DWT $CL_F #OIL #Algorithm #OOTThttps://twitter.com/EPICtheAlgo/status/1024665109338222592

Wed 1030 EIA report lower price target a perfect hit published on weekend report.

Oil, algorithm, price, target, hit, EIA
Wed 1030 EIA report lower price target a perfect hit published on weekend report. Oil Algorithm (EPIC). FX $USOIL $WTI $USO $UWT $DWT $CL_F #OIL #Algorithm #OOTT

Tues 430 lower price target a perfect hit, as published on weekend report. Oil Algorithm (EPIC). FX $USOIL $WTI $USO $UWT $DWT $CL_F #OIL #Algorithm #OOTT

https://twitter.com/EPICtheAlgo/status/1024447086102827011

Tues 430 lower price target a perfect hit published on weekend report. Oil Algorithm (EPIC). FX $USOIL $WTI $USO $UWT $DWT $CL_F #OIL #Algorithm #OOTT

Oil, algorithm, price, target, hit
Tues 430 lower price target a perfect hit published on weekend report. Oil Algorithm (EPIC). FX $USOIL $WTI $USO $UWT $DWT $CL_F #OIL #Algorithm #OOTT

Oil Intra-Day Algo Trading Quadrants (white dotted lines):

Trading quadrants are simply support and resistance lines that can assist your intra-day trading – they are not alpha or primary support and resistance by any measure. Price action does however typically move more assertively when leaving a trading quadrant.

Indicator Methods:

As explained above, my algorithm is a consideration of up to fifty traditional indicators at any one time – each one given its own weight in accordance to its accuracy (win rate). This is how we establish the probability of specific targets hitting (we call them alpha algo targets).

Alpha Algo Targets, Algo Trend-lines, Algo Timing, Quadrants for Intra Snipes

Algo targets are the red circles – they correspond with important times each week in oil reporting land. Tuesday 4:30 PM, Wednesday 10:30 AM and Friday at 1:00 PM. The red dotted diagonal lines are the algo trend-lines. And the vertical dotted (red or green) are marking the important times each week. You will find that the price of crude will hit one of the alpha algo targets about 90% of the time. In the absence of market direction the machines take price to the next algo line and/or target. Understanding how the price of crude reacts to the algos and how they move price from target to target is critical for intra-day and swing trading crude oil and associated instruments.

You will notice that price action of crude will use these algo trend-lines and act as support and resistance, and that price also often violently moves when an alpha algo line is breached either upward or downward.

We cover this in much more detail in the member updates, trading room. A review of my Twitter feed and previous blog posts will help you understand the relation of these indicators. We will start posting video blogs (for my subscribers) on YouTube (in addition to my daily blog posts) for swing traders that work during regular trading hours.

Also… we will cover how to establish algo trend-lines and price targets future forward (as you have seen me do on my Twitter feed for some time now).

Conclusion:

See you in the live trade room! And again, if you struggle to know how to use these indicators as a trader’s edge, it is recommended (if you have earnestly reviewed all of our documentation first) that you obtain private coaching prior to trading a real account with real money – we recommend you use a paper trading account at first.

You can also send specific questions to our email inbox at [email protected] – if you do this be sure to ask a specific question so it can be answered specifically. When the 24 hour oil trading room opens you will have ample opportunity in that 24 hour room to ask questions also.

Watch my EPIC the Oil Algo Twitter feed for intra day notices and your email in box for member only material intra day also.

EPIC the Oil Algo

Subscribe to my Service here:

Standalone Oil Algorithm Newsletter (member charting sent out weekly).

Real-Time Oil Trading Alerts (Private Twitter feed).

Oil Trading Room Bundle (includes weekly newsletter charting and real-time trading alerts on Twitter).

Commercial / Institutional Multi User License (for professional trading groups).

One-on-One Trade Coaching (Via Skype or in person).

Temporary Discount Offers (New members only):

30% Off Oil Newsletter: Use Promo Coupon Code “epic30” When Subscribing to our Weekly Oil Newsletter Here: https://compoundtrading.com/product/standalone-epic-newsletter/ (cancel anytime, for new members only to trial the service).

30% Off Oil Alerts: Use Promo Coupon Code “oilalerts30” for Real-Time Oil Trade Alerts via Private Twitter Feed @OilAlerts_CT Here: https://compoundtrading.com/product/live-oil-trading-alerts/?attribute_plan=One+Month (cancel anytime, for new members only to trial the service).

Click here to find all information and pricing on Oil Newsletter, Trading Chat Room, Oil Alerts and more.

Connect:

Register to free email list for trade set-ups, webinars, special events: https://compoundtrading.com/contact/

Website: https://compoundtrading.com

Blog: https://compoundtrading.com/blog/

Free chat room: https://discord.gg/2HRTk6n

Subscribe: https://compoundtrading.com/overview-…

Twitter: https://twitter.com/CompoundTrading

Lead Trader: https://twitter.com/curtmelonopoly

Tradingview: https://www.tradingview.com/u/curtmel…

Facebook: https://www.facebook.com/compoundtrad…

StockTwits: https://stocktwits.com/compoundtrading

Email: https://[email protected]

Curtis Melonopoly (@curtmelonopoly) is rated Top 250 Stock exchanges authority, covering also Mathematical finance and Economy of the United States

Tweets by EPICtheAlgo


Article topics: EPIC, Oil, Algorithm, Trading, Alerts, Crude, $USOIL, $WTI, $USO, $UCO, $CL_F, $UWT, $DWT, Chart

Read More

Posts navigation

Older posts
Newer posts
Proudly powered by WordPress | Theme: sharksdesign by reviewexchanger.
 

Loading Comments...