Crude Oil Algorithm Trading Chart Report (EPIC) w/ Machine Trading Monday November 26, 2018.
FX: $USOIL $WTI $USO $CL_F $UWT $DWT $UCO $SCO $ERX $ERY $GUSH $DRIP
Welcome to the oil trading algorithm report. My name is EPIC the Oil Algorithm and I am one of seven primary Algorithmic Chart Models in development at Compound Trading Group (there are over one hundred in total in development at various stages in various markets).
NOTICES:
New members to our oil algorithm charting models, oil trade alerts and oil trading room are encouraged to on-board in a way that equips you as an oil trader for consistent profit.
Visit my public Twitter feed EPIC Oil Algorithm Twitter (@EPICtheAlgo) and review tweets over the last few months, visit our blog and review the recent crude oil trading algorithm blog posts, You Tube channel “how my oil algorithm works”, “how to use my charting”, weekly EIA oil report videos and our website explains how the oil algorithm was developed.
Invaluable are the crude oil trade alerts (available with or without the trading room / weekly report bundle) and the private member crude oil trading chat room on Discord (included in the bundle). The live alerts are important if you are not at your trading screens 24 hours a day and the chat room allows for interactive lead trader oil trade set-ups as each oil trade approaches. All bundle members can access the live oil trading room when active also.
Reviewing important points of reference and engaging the subscription resources will increase your probability of success considerably. This report also includes links to some recent example “how-to” videos.
Oil Trade Coaching – We strongly suggest users of this algorithmic crude oil trading strategy opt for some level of private one-on-one coaching with our lead trader. Our lead trader is maintaining a crude oil trading alert win-rate of over 90% (as of Sept 2, 2018 (time-stamped, live alert, recorded).
On our website one-on-one online coaching packages are available (coaching via Skype) or you can request a custom package reflecting the time you wish to invest in learning. To request a custom package suited to your needs email info@compoundtrading.com or click here for standard private trade coaching packages. Other options for coaching include online webinars, trade coaching bootcamps and private on location (in person) coaching sessions.
Oil Trading Room – How to Use the Oil Algorithm
Oil Trading Room – How to Trade Intra-day with my Algorithmic Oil Charting
Oil Trading Alerts. Live Lead Trader Video Trading w EPIC Oil Algorithm
Recent articles / videos from our blog about how to trade crude oil with our oil trading algorithm:
Crude Oil Trading Strategy | Technical Analysis & Guidance.
Crude Oil Trading Strategy: Career Trade Set-Up. Technical Analysis Trading Room w/ Video
Crude Oil Algorithmic Trading: A Simple Strategy That Wins – Real Life Example.
Daytrading Crude Oil: Buy Sell Signals Strategy for Intra-day Sell Off Reversal.
Crude Oil Trading Strategies: This Is It. How To Trade Crude Oil’s Next Move.
Protected: Crude Oil Trading Strategy – How I Will be Trading Oil in to Time Cycles.
Protected: Oil Trading Room – Oil Trading Signals with Lead Trader (plus video).
For the more articles / videos available visit our Crude Oil Trading Academy : Learn to Trade Oil page here.
MULTI-USERS: Institutional / commercial platform now available on our shop page.
SOFTWARE: My algorithmic charting is now also in the coding phase for our trader’s dashboard program. Please review my algorithm development process, about my oil algorithm story on our website www.compoundtrading.com and my oil algo charting posts on Twitter feed and/or this blog.
HOW MY ALGORITHM WORKS: I am an oil algorithmic model in development. My math is based on traditional indicators (up to fifty at any given time each weighted on win ratio merit – all not shown on chart at any given time) – such as simple math calculations relating to price and volume, Fibonacci, simple pivots, moving averages, Gann, Schiff and various other charting, geometric and mathematical factors. I do not yet have AI integration – only math as it relates to traditional indicators with the primary goal being probabilities. I am presented on (and used on) conventional trade charting as one would normally use.
The goal is to provide oil traders with signals for an edge when triggering entries and exits on trades with instruments that rely on the price of crude oil – first with the reporting format as below, then with machine trading functions and an integrated intelligent assisted traders platform that will provide the user with various settings of automation and personal trade execution.
In the weekly report below you will find simplified levels represented on conventional and algorithmic charting for intra-day (day-trading crude oil), swing trading and investing.
This work (and associated trading) should be considered one decision at a time, “if this happens then this or this are my targets”… price – trigger – trade and so on with oil related financial instruments.
Forward questions to info@compoundtrading.com, private message our lead trader on Twitter or in the private Discord oil trading room.
For further information this link explains how our algorithmic charting is done, this YouTube video explains in summary how my algorithm works https://www.youtube.com/watch?v=LUNyxFoXJp8 this link for more information about our algorithmic stock charting models and what makes them different than most.
EVERY CALL WE MAKE, EVERY PUBLIC INTERACTION, REPRESENTATION OF TRADE SIGNAL (ON EVERY VENUE) IS VIDEO RECORDED, ON SOCIAL MEDIA OR ON BLOG / WEBSITE TIME-STAMPED FOR PERMANENT RECORD AND TRANSPARENCY. PLEASE ALSO REFER TO OUR PUBLIC DISCLOSURE https://compoundtrading.com/disclosure-disclaimer/.
Oil Algorithm Observations:
Below is a link for the live algorithmic chart of EPIC the Crude Oil Trading Algorithm (Generation 1, Version 5 including black box modeling). The charting is a real-time trading chart represented on FX USOIL WTI published November 6, 2018.
Click on share button (bottom right beside flag) and when that screen opens click on “make it mine” to view real-time, make edits etc:
Crude Oil Trading Algorithm. Gen1.V5 (EPIC). Intra-day crude oil trade. Nov 26 352 AM FX USOIL WTI $USO $CL_F #Crude #Oil #Trading #Algorithm

November 26, 2018
Generation 1 Model Oil Trading Signals
The first most predictable trade are the resistance and support cluster areas formed by long term chart trend lines (see charts that have trend-lines represented in red as made available below near bottom of this report – conventional charting trend-lines).
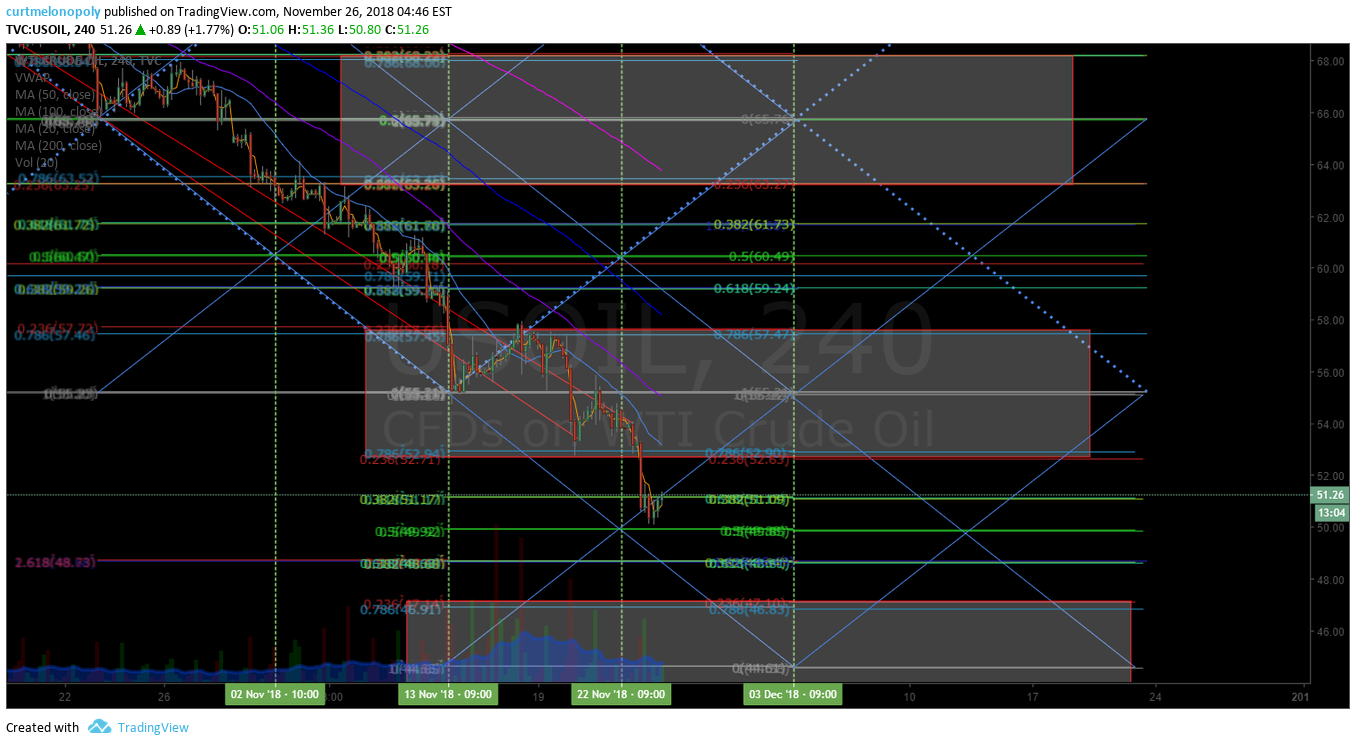
The second most predictable trade (wide trading range primary resistance and support that become predictable buy and sell triggers). Current algorithmic model wide trading range resistance (grey arrow – grey horizontal line) at approximately 54.45 in the current trading range. Current algorithmic model wide trading range support (grey arrow – grey horizontal line) at approximately 50.80 in the current trading range – these areas are general range support and resistance areas (our algorithm uses a .15 – .20 cent buffer on either side for these trades – if that is exceeded then trading price is likely to use the line as a pivot until a directional trending trade is established).
Trading between the resistance / support horizontal grey lines is extremely profitable risk – reward if one is disciplined to the patience required and follows the trend of trade.
More recently (as of September 2018) our back-testing has shown that the support and resistance areas noted are used in trade as a decision pivot – in other words, the price tends to pivot around these decision points on the chart and coil over a period of time and then spring out of the coil in an upward or downward trend.
The lower trading range is 47.14 – 50.79 and upper trading range 54.46 – 58.07.
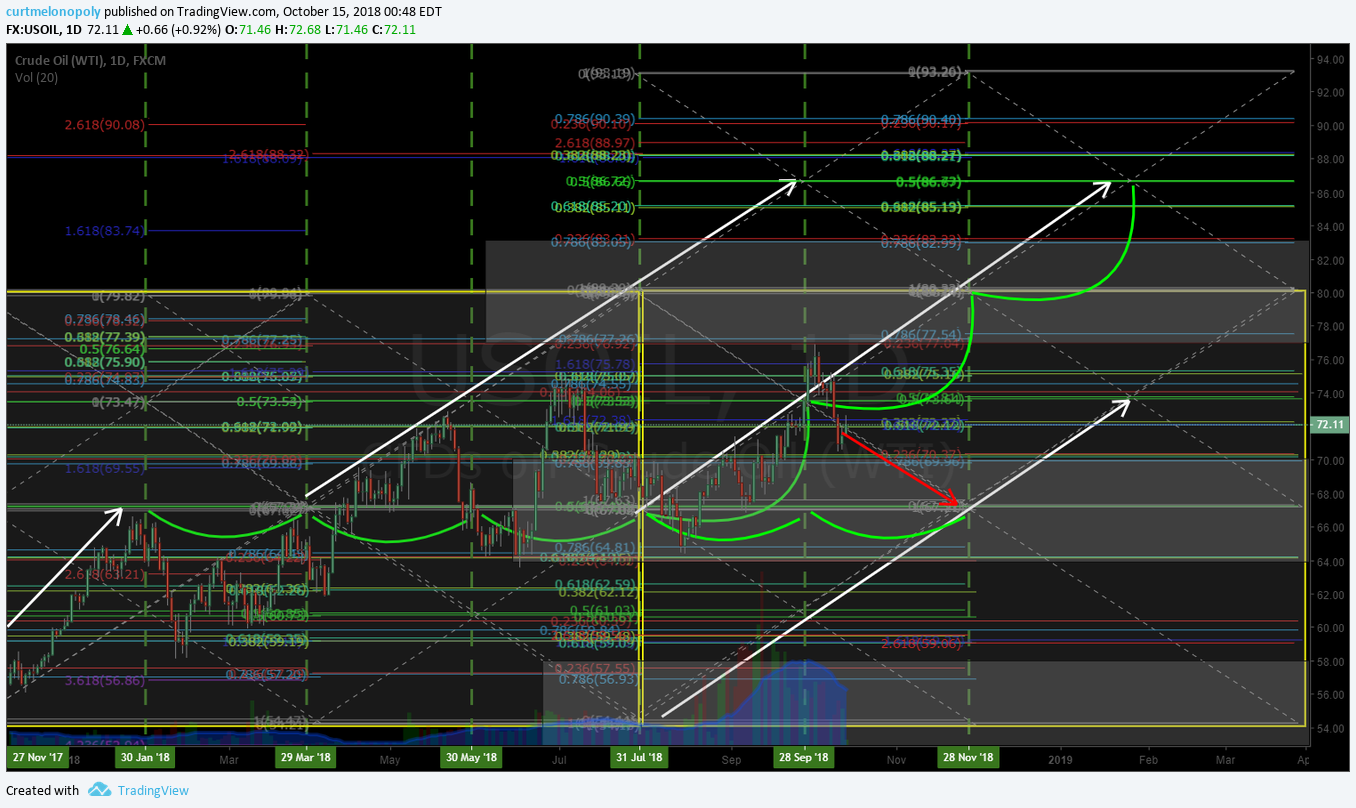
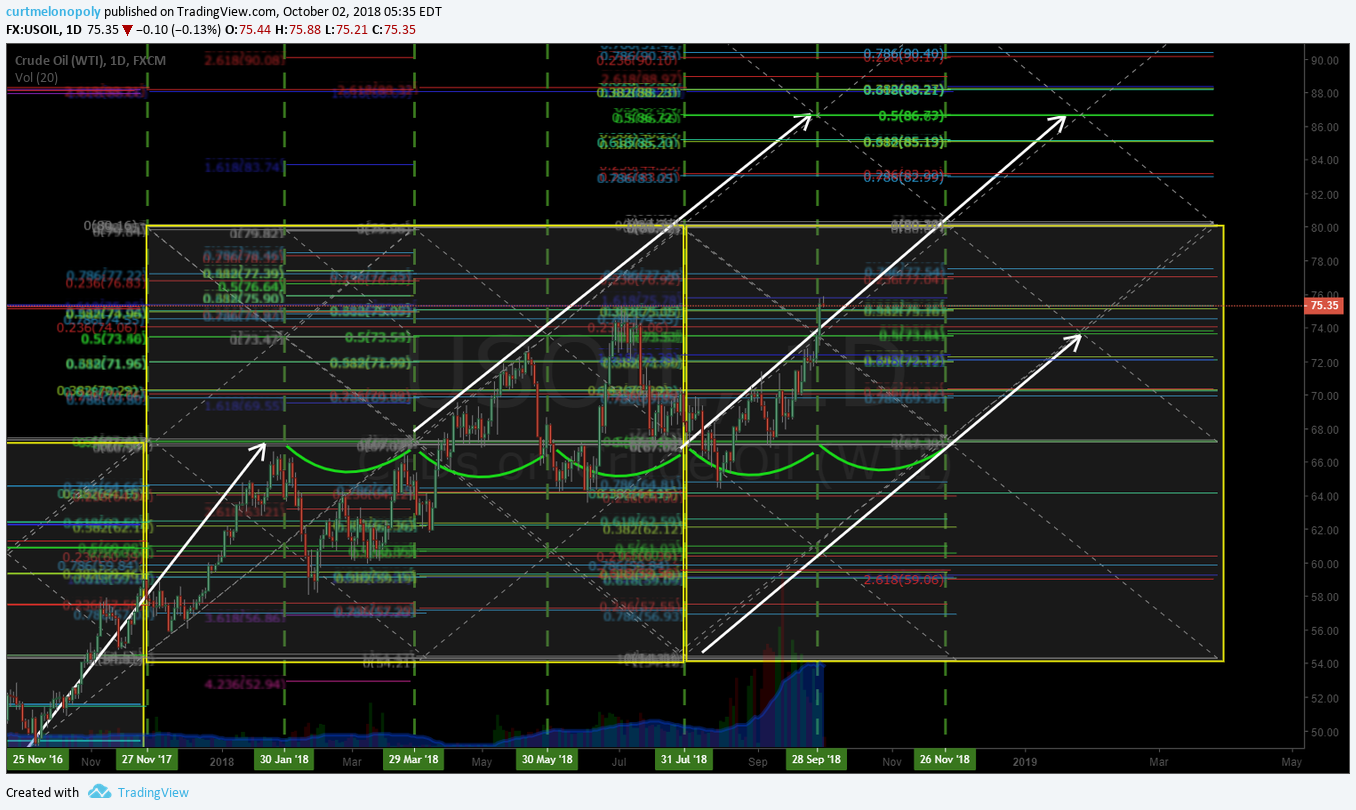
Third most predictable trade (support and resistance of uptrend or down trend channels). On the chart an upward trending trade channel is presented and a downward option (channel support and resistance / trading range is represented as diagonal dotted orange lines and purple arrows – as made available, assist in displaying directional trade decision areas).
Fourth most predictable trade (support and resistance of 30 min quadrants). The diagonal lines make up quadrants (in this instance on a 30 min chart) and are represented as orange diagonal lines that make up geometric diamond shapes. These lines also assist in intra-day trade.
Fifth most predictable trade (support and resistance of most applicable Fibonacci) the Fib support and resistance lines are the horizontal lines in various colors with the exception of purple and yellow (see below). These horizontal lines become support and resistance for intra-day trade.
Sixth most predictable trade (support and resistance of historical support and resistance) Natural / historical support and resistance lines shown in purple or yellow – they represent historical support and resistance. The strongest of the historical support and resistance lines are shown in yellow horizontal and are typically accompanied by a yellow arrow marker.
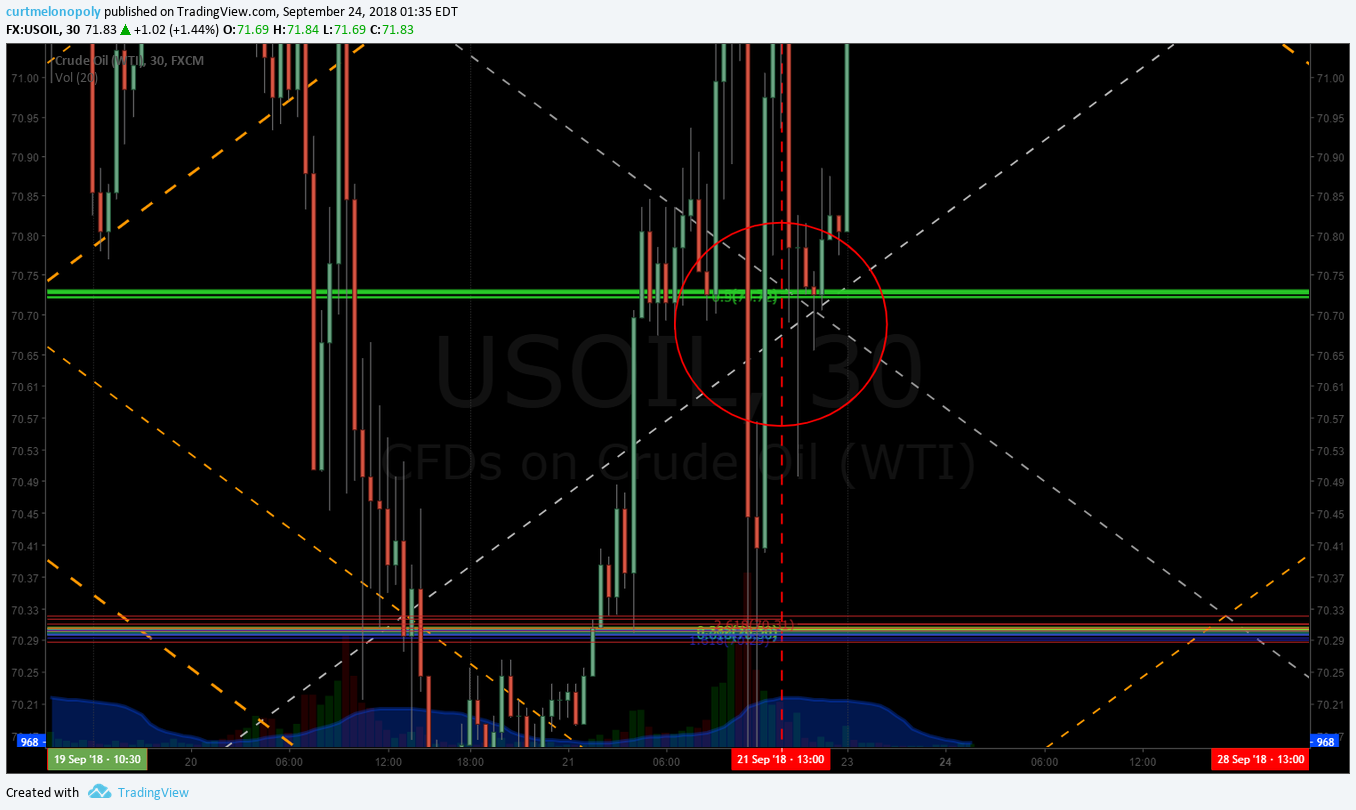
Seventh most predictable trade signal we use are the time and price targets (red circles). When trade is in a significant uptrend or downtrend the targets become very precise and move up the indicator priority list quick.
Tues, Wed and Fri targets are most predictable in extended multi week up-trends or down-trends.
The Eighth most predictable trade is intra-day. You will notice on some of the charting geometric shapes in green on some of my charting (at times). They are charted live in the trading room and at times the lead trader will highlight these areas intra with white outlines (typically geometric shapes such as diamonds or triangles).
Intra-day Trading Bias
Intra day bias is down side trade as the MACD is turned down on the daily chart and this indicator is usually a leading indicator for oil trade on this time-frame. However, after the recent sell-off oil trade has held this range and could be at a near term bottom. Yet to be determined.
Wide Trading Range – Buy and Sell Triggers for Swing Trading Crude Oil:
Swing trading bias / forward guidance as of Nov 19 4:17 AM EST for the near term is indecisive.
Trade the ranges noted above between the thick grey lines (grey arrows) for the most predictable swing trades between 47.14 – 50.79, 50.80 – 54.44, 54.45 – 58.06, 58.07 to 61.69, 61.70 to 65.31, 65.32 to 68.92, 68.93 to 72.54, 72.55 to 76.14 and 76.15 to 79.74. This is a highly profitable risk-reward way to trade oil if you can be patient to trigger at only the break of the wide range charting areas and are disciplined to cut a losing trade that does not prove in your anticipated trend.
Or trade the range between the channel diagonal lines at support and resistance in up or down channel (orange dotted diagonals).
Significantly more advanced trading rules will be introduced over the coming weeks with the newer Machine Trading Generation 2 models per below in this report.
Crude Oil Trading Algorithm. Gen1.V5 (EPIC). Down channel crude oil trade. Nov 26 459 AM FX USOIL WTI $USO $CL_F #Crude #Oil #Trading #Algorithm

Crude Oil Trading Algorithm. Gen1.V5 (EPIC). Up channel crude oil trade. Nov 26 458 AM FX USOIL WTI $USO $CL_F #Crude #Oil #Trading #Algorithm

Gen 1 and Gen 2 Algorithmic Oil Trading Machine Driven Model Development.
Per recent report example:
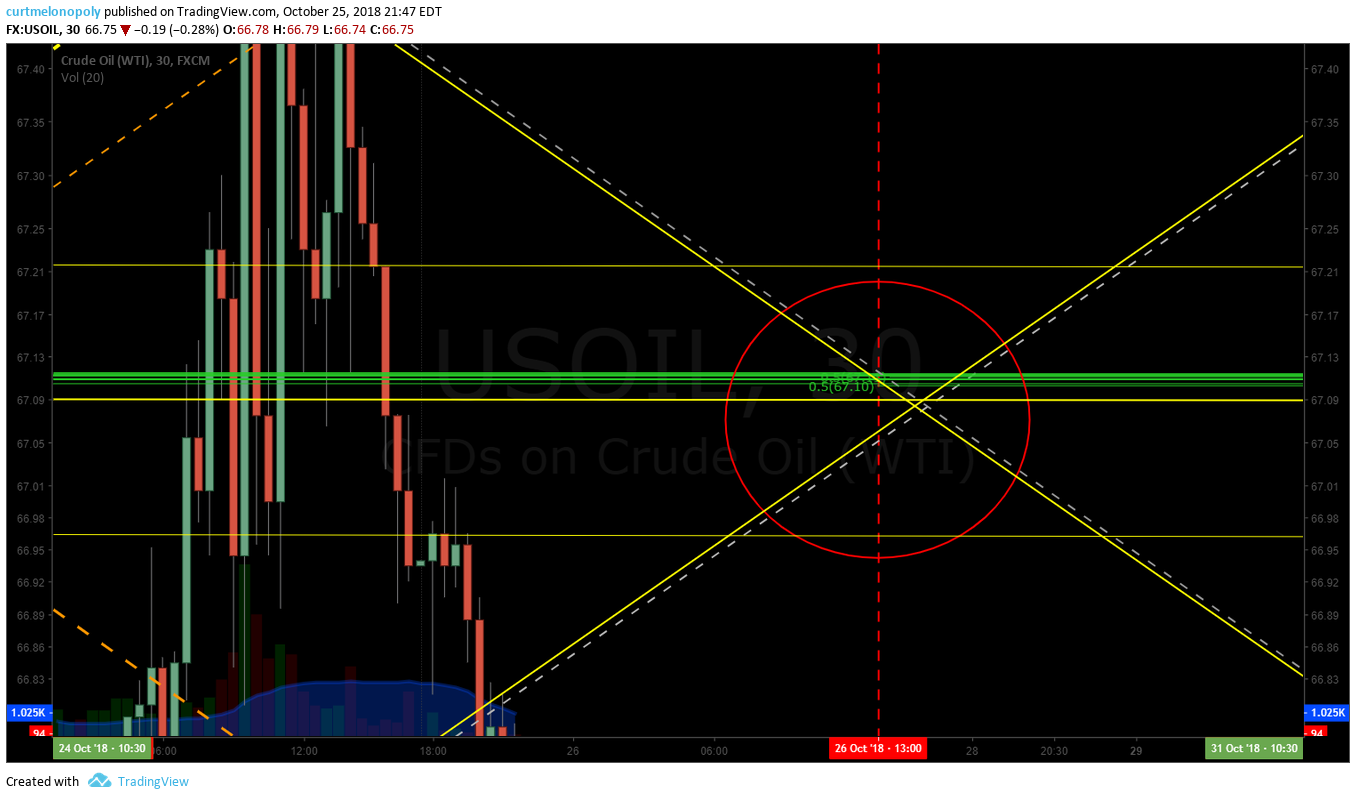
Crude Oil Trading Algorithm. Gen1.V5 (EPIC). Hidden pivot locations. Oct 25 831 PM FX $USOIL $WTI $USO $CL_F #Crude #Oil #Trading #Algorithm

Per recent example;
Crude Oil Trading Algorithm. Gen2.V2 (EPIC). Machine trading intra-day. Sept 17 552 AM FX $USOIL $WTI $USO $UWT $DWT $CL_F #Crude #Oil #Algorithm #OOTT
This is an alternate machine trading model currently in development.

Per recent example;
Crude Oil Trading Algorithm. Gen2.V1 (EPIC). Machine trading intra-day. Sept 11 1246 AM FX $USOIL $WTI $USO $UWT $DWT $CL_F #Crude #Oil #Algorithm #OOTT

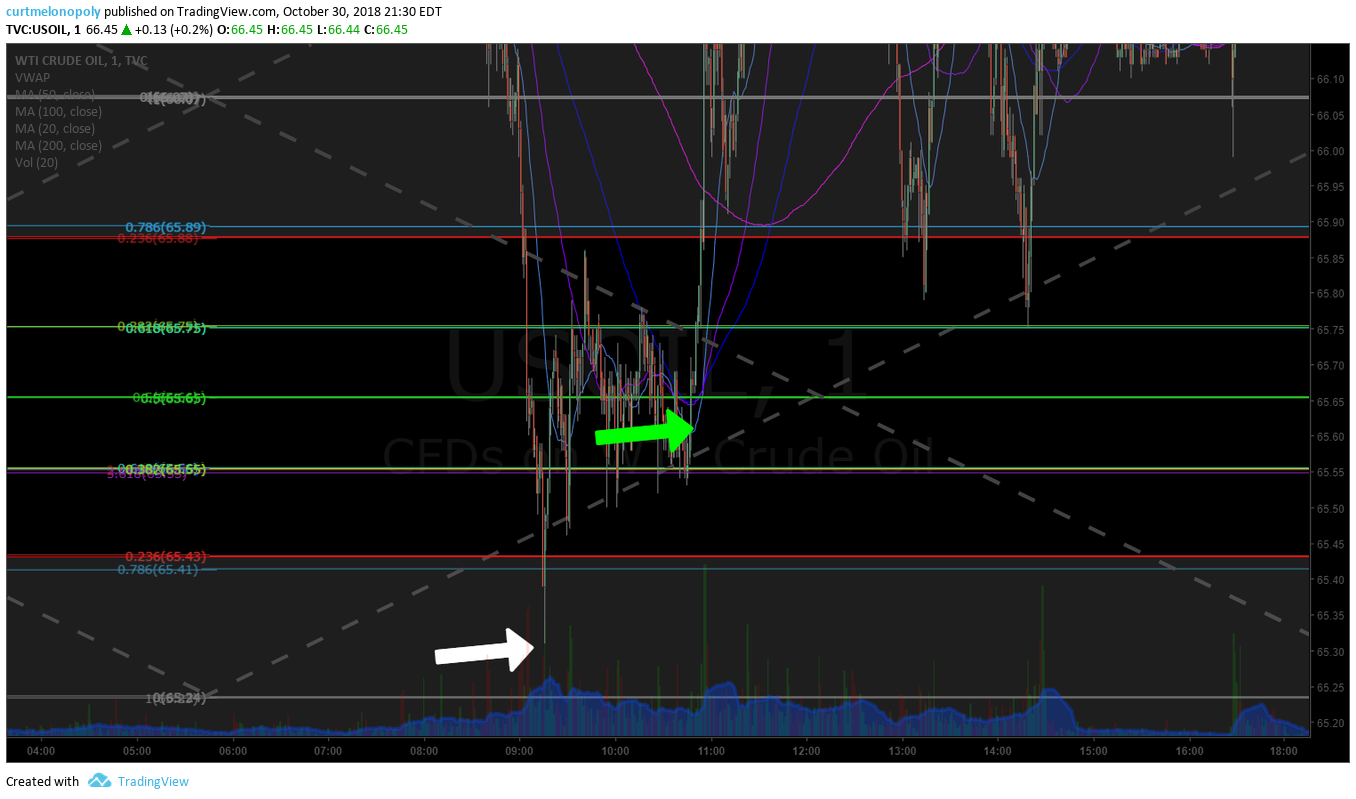
Generation 1 Day-Trading Crude Oil 1 Minute Chart Signals
Per recent example:
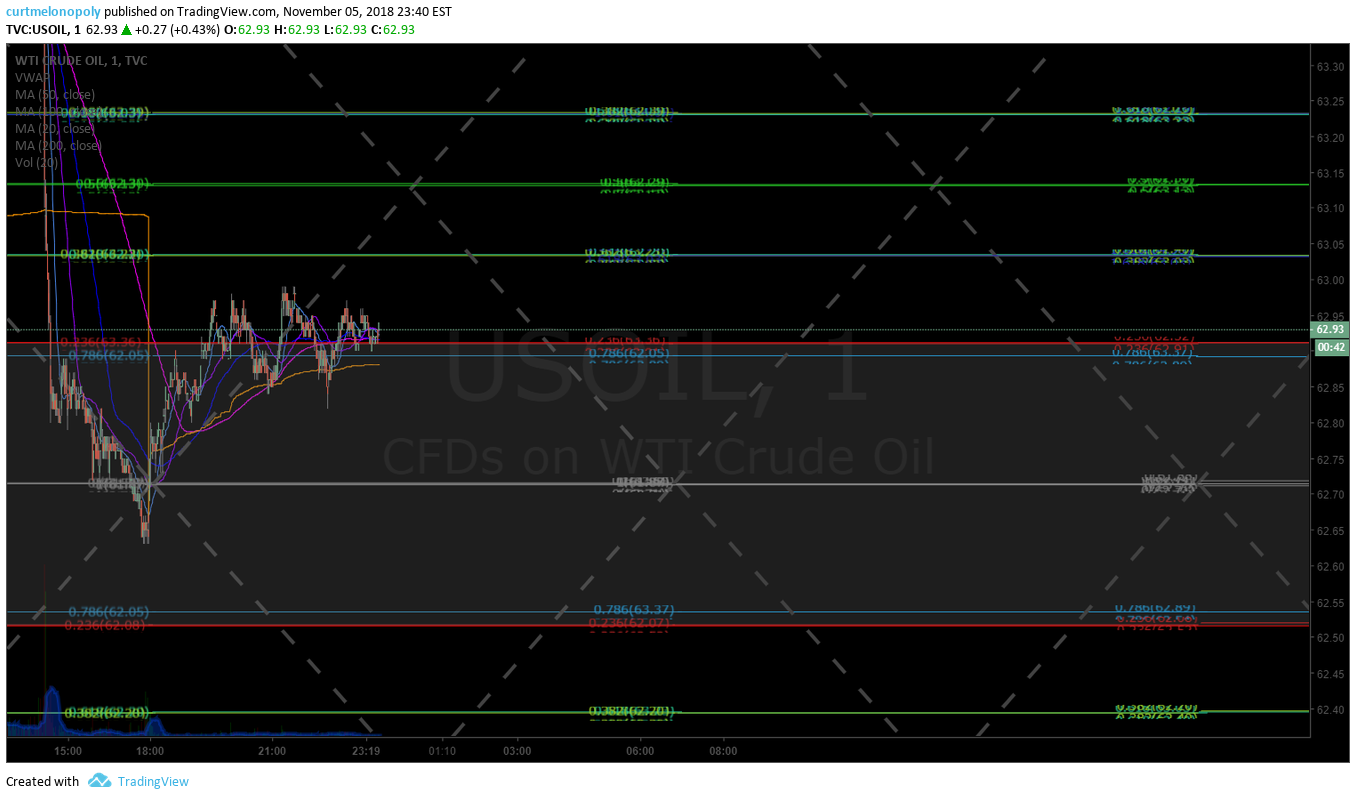
Crude Oil Day-Trading Chart Signals. 1 minute time.

Crude Oil Swing Trade Charting.
Monthly Oil Chart:
See recent link post below for current charting:
Crude Oil Monthly Chart. Trade lost 200 MA, MACD turning down, Stoch RSI turn down. Nov 6 1254 AM

Weekly Crude Oil Charts:
Crude Oil. Weekly trend-line chart, Nov 26 420 AM FX USOIL WTI $CL_F $USO #OIL #trading

Per recent;
Crude Oil. Weekly chart wedge chart. Nov 6 1252 AM

Daily Oil Charts:
Crude Oil Daily Chart MACD still turned down possibly near bottom. Nov 26 429 AM FX USOIL WTI $USO $CL_F #OIL #chart

Per recent example:
Crude Oil Daily Symmetry Chart. Nov 6 104 AM

240 Minute Crude Oil Charts:
Crude Oil. 240 Min trading spigot concept chart for trims and adds, Nov 26 438 AM FX USOIL WTI $USO $CL_F #OIL #trading

Crude Oil 240 Min Simple Algorithmic Chart Model Nov 26 447 AM FX USOIL WTI $USO $CL_F #OIL #trading

30 Minute Crude Oil Chart:
Per recent;
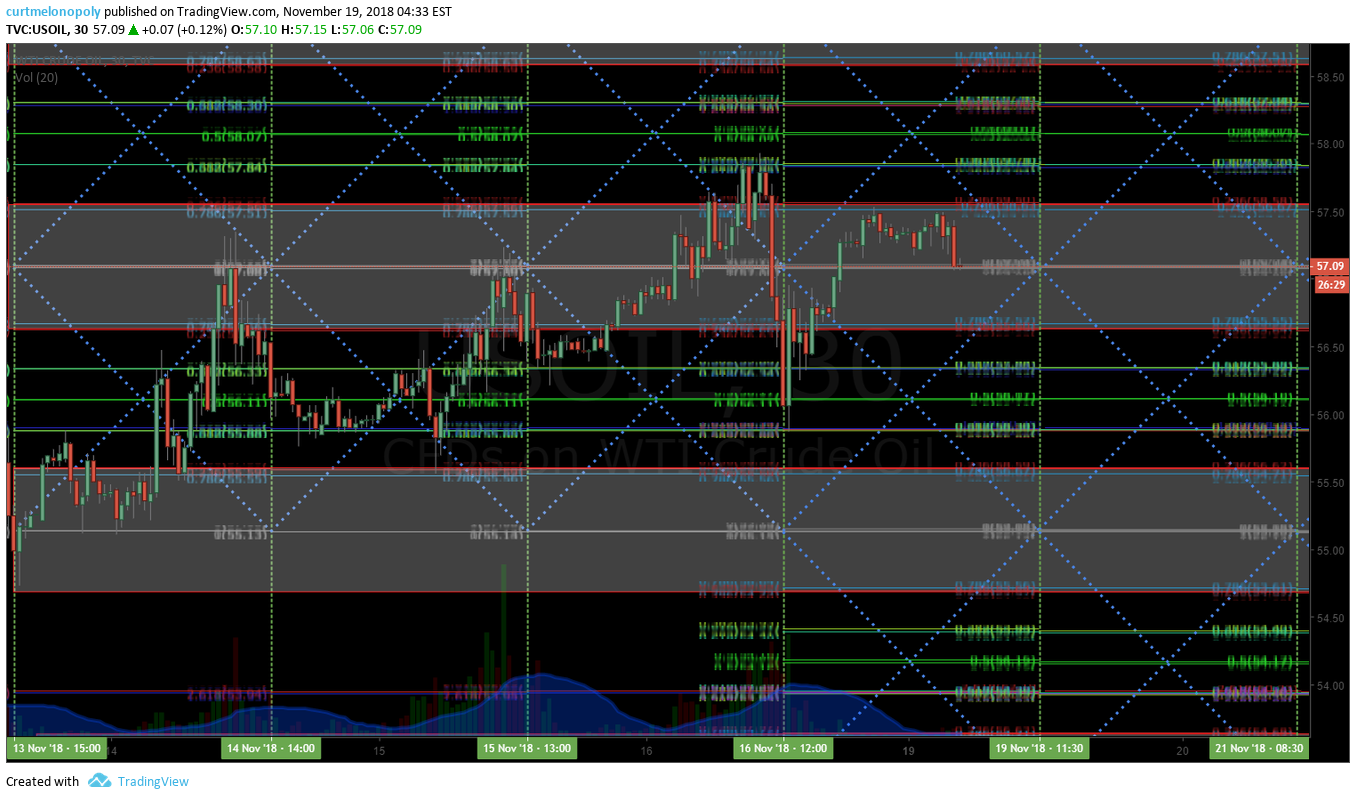
Crude Oil 30 Min Simple Algorithmic Chart Model Nov 19 434 AM FX USOIL WTI $USO $CL_F #OIL #trading

Diagonal Trend Lines:
Diagonal trend-lines are critical inflection points (currently represented in red below on our conventional charting).
Please review many of my recent posts so you can learn about how important these diagonal trend-lines are. If one is breached you can look to pull-back to next diagonal trend line about 90% of the time. Also pay attention to how thick the lines are – the thicker the line the more important because they represent extensions from previous time / price cycles.
Remember you can come in to the chat room to message the trader and REMEMBER I have posted a live chart link in this post so if you can’t see the lines well on this chart above you can go to the live chart link and watch for member live algo chart links through-out the day in your email inbox!
Fibonacci Levels:
Watch the lines for support and resistance. Careful using them as traditional retracement levels with crude because the algo lines etc are more dominant / predictable. But the Fib lines are excellent indicators for intra-day trade support and resistance.
The Fibonacci lines are marked on main chart above.
Horizontal Trend-Lines (purple):
Horizontal trend-lines are not as important as the other indicators reviewed above, however, they do serve as important resistance and support intra-day for tight trading and they are important if thick (in other words they come from previous time / price cycles). WE STARTED TO REPRESENT THE REALLY IMPORTANT LINES IN YELLOW FYI FOR EASE. Refer to chart for current applicable horizontal trend-lines.
Horizontal trend-lines are marked on charts above.
Oil Time / Price Cycles:
Watch your email and / or my Twitter feed for time price cycles they may start to terminate.
Time / price cycles are the single most important indicator and my record calling them is near 100% – since inception seven months ago. The reason they are so important is that a trader does not want to be holding a crude oil instrument at termination of a time cycle if not absolutely sure if price will go up or down. A trade may choose to enter a large position in advance of a time price cycle termination IF THERE IS A HIGH PROBABILITY OF A DIRECTION IN PRICE and if the market is trading at a really important pivot area. In other words, if the market is trading at the bottom of the upward trending channel at a support (yellow lines) and we knew there was a significant probability of a time cycle about to terminate a trader may enter with a long position. The price really spikes or drops significantly when these important time cycles terminate.
The problem with time / price cycle terminations is they change from minute to minute (depending on where price is on the chart) so you have to be in the trade room to get the alert. Our lead traders will do everything they can in future to send these on SMS but we have to be careful because it can be difficult with so much going on in the room. The reason they (time cycles) change is because they are actually represented by or are geometric shapes in the chart – I know it sounds odd but I have (as I mentioned) hit these calls just shy of 100%. The oil political people know the same algorithmic modeling principles and they ALWAYS TIME THEIR BIG ANNOUNCEMENTS AROUND THE TIME PRICE CYCLE TERMINATIONS.
So if you can picture a triangle on the chart – and price is trading in the triangle – and price is going to come to the edge of the triangle and there is a significant support or resistance or an algo line terminating there too or a target (those type of indications)… then we know there is a high probability of a time and price change. In other words, it is where there are clusters of algorithm points that cross and when price is going to cross over that cluster is where they are. And these are represented on all the different time frames – the larger the time frame – the larger the time price cycle termination – the larger the spike or downdraft. This is where we establish our intra-day quadrants from for sniping trades (which we will put in to the room soon because it looks like the geo political rhetoric is over for a while making them more predictable). Difficult to explain in short. So we will do our best to SMS alert these in future.
Also, the real large or important time / price cycle terminations we know far in advance and they can be put in these newsletters.
If you review my Epic the Oil Algo Twitter feed, my blog posts and my story on our website you will get a feel for how accurate these calls are.
Alpha Algo Trading Trend-Lines (Primary – Red dotted lines. Secondary – White dotted lines):
To determine which algo line is most alpha (or probable) intra day, it is the nearest line to price action. This can also help you determine the trend of trade. If the algo line is trending up the price will follow it up until price is tested at an algorithm indicator (the main tests are diagonal trendlines, horizontal trendlines, time / price cycles etc – as I have shared with you). This is why it is important to watch all the lines because they are all support and resistance. To keep it simple trade the range (yellow lines) as I’ve mentioned but keep an eye on these indicators.
Current Alpha Algo Targets (Red circles):
Your closest target that crude is trending toward is always the most probable.Then, your second most probable is the one that is up or down trend depending on whether general price is in an upward or downtrend for the most recent week or so and what your other indicators look like (such as the MA’s I explained above).
The other way to determine which targets are in play is actually quite simple, you will notice that crude trades between the channel lines up and down and up and down and there are various support and resistance along the way. If it hits a target at the top of the channel you can bet most times (unless the next day like today) that the next target hit will be at the bottom of the channel.
Wait for the price to trend toward a target and take your position and watch as price gets closer and closer to the target. Remember, that the machines trade from decision to decision – or in other words from support to next resistance or resistance to next support or when the times come each week on Tuesday Wednesday and Friday they will trend toward the target that market price action determines they go to.
Our lead trader will explain more in the room and do not hesitate to ask our lead trader in the room by private message or on twitter to explain intra day decisions.
Recent Live Crude Oil Trade Alerts (sample signals):
Nov 26 – Recent trade alerts will be updated soon.
Aug 12 2018 – Recent trades are found in this recent report:
Crude Oil Trading Face-Off Results “Pro Trader” (Man) vs. EPIC Oil Algorithm (Machine Trading Tech)
Click on feature post for recent crude oil trading alerts blog post; Oil Trading Alerts Live Video w EPIC Oil Algorithm #EIA Report #Oil #Trading #Algorithm #Alerts $USOIL $WTI $CL_F
Recent Oil Algorithm Price Target Hits:
Nov 26 – Price Target Reporting will be updated soon.
Wed 1030 EIA report lower price target a perfect hit published on weekend report. Oil Algorithm (EPIC). FX $USOIL $WTI $USO $UWT $DWT $CL_F #OIL #Algorithm #OOTT
https://twitter.com/EPICtheAlgo/status/1024665109338222592
Oil Intra-Day Algo Trading Quadrants (white dotted lines):
Trading quadrants are simply support and resistance lines that can assist your intra-day trading – they are not alpha or primary support and resistance by any measure. Price action does however typically move more assertively when leaving a trading quadrant.
Indicator Methods:
As explained above, my algorithm is a consideration of up to fifty traditional indicators at any one time – each one given its own weight in accordance to its accuracy (win rate). This is how we establish the probability of specific targets hitting (we call them alpha algo targets).
Alpha Algo Targets, Algo Trend-lines, Algo Timing, Quadrants for Intra Snipes
Algo targets are the red circles – they correspond with important times each week in oil reporting land. Tuesday 4:30 PM, Wednesday 10:30 AM and Friday at 1:00 PM. The red dotted diagonal lines are the algo trend-lines. And the vertical dotted (red or green) are marking the important times each week. You will find that the price of crude will hit one of the alpha algo targets about 90% of the time. In the absence of market direction the machines take price to the next algo line and/or target. Understanding how the price of crude reacts to the algos and how they move price from target to target is critical for intra-day and swing trading crude oil and associated instruments.
You will notice that price action of crude will use these algo trend-lines and act as support and resistance, and that price also often violently moves when an alpha algo line is breached either upward or downward.
We cover this in much more detail in the member updates, trading room. A review of my Twitter feed and previous blog posts will help you understand the relation of these indicators. We will start posting video blogs (for my subscribers) on YouTube (in addition to my daily blog posts) for swing traders that work during regular trading hours.
Also… we will cover how to establish algo trend-lines and price targets future forward (as you have seen me do on my Twitter feed for some time now).
Conclusion:
See you in the live trade room! And again, if you struggle to know how to use these indicators as a trader’s edge, it is recommended (if you have earnestly reviewed all of our documentation first) that you obtain private coaching prior to trading a real account with real money – we recommend you use a paper trading account at first.
You can also send specific questions to our email inbox at info@compoundtrading.com – if you do this be sure to ask a specific question so it can be answered specifically. When the 24 hour oil trading room opens you will have ample opportunity in that 24 hour room to ask questions also.
Watch my EPIC the Oil Algo Twitter feed for intra day notices and your email in box for member only material intra day also.
EPIC the Oil Algo
Subscribe to Service Here:
Standalone Crude Oil Algorithm Newsletter (member charting sent out weekly).
Real-Time Crude Oil Trading Alerts (Private Twitter feed).
Crude Oil Trading Room Bundle (includes weekly newsletter charting and real-time trading alerts on Twitter).
Commercial / Institutional Multi User License (for professional trading groups).
One-on-One Trade Coaching (Via Skype or in person).
Connect:
Register to free email list for trade set-ups, webinars, special events: https://compoundtrading.com/contact/
Website: https://compoundtrading.com
Blog: https://compoundtrading.com/blog/
Free chat room: https://discord.gg/2HRTk6n
Subscribe: https://compoundtrading.com/overview-…
Twitter: https://twitter.com/CompoundTrading
Lead Trader: https://twitter.com/curtmelonopoly
Tradingview: https://www.tradingview.com/u/curtmel…
Facebook: https://www.facebook.com/compoundtrad…
StockTwits: https://stocktwits.com/compoundtrading
Email: https://info@compoundtrading.com
Curtis Melonopoly (@curtmelonopoly) is rated Top 250 Stock exchanges authority, covering also Mathematical finance and Economy of the United States
Article topics: EPIC, Crude, Oil, Algorithm, Trade, Alerts, Trading Room, Chat, Charts, Signals, $USOIL, $WTI, $USO, $CL_F