
PreMarket Trading Plan Wed July 18: $PRPO, $CBIO, $ERIC, $ADAP, #EIA, OIL, $WTI, GOLD, $GLD, Crypto, $BTC , US Dollar, $DXY more.
Compound Trading Premarket Trading Plan & Watch List Wednesday July 18, 2018.
In this edition: $PRPO, $CBIO, $ERIC, $ADAP, #EIA, OIL, $WTI, GOLD, $GLD, Crypto, $BTC , US Dollar, $DXY and more.
Welcome to the morning Wall Street trading day session at Compound Trading.
Notices:
Notes in red text in this report are more recently important.
Scheduled Events:
- Wed July 18 – Lead trader (and/or other team members) will be active in live trading room today as follows (and only as available as things can change fast in the markets in our operational environment);
- 9:25 Market Open – access limited to live trading room members
- 10:30 AM #EIA Oil Report
- 12:00 Mid Day Trade Review – access limited to liver trading room members
- Any other live trading sessions will be notified by email.
- The above listed times are expected live trading time blocks only. Live voice broadcast will only occur if there is a trade set-up to discuss by the lead trader. Screen sharing will be active through-out each time frame.
- Link: https://compoundtrading1.clickmeeting.com/livetrading
- Password: **** (email for access if you do not have it, password changes will be emailed when changed only)
- For membership access, options here: https://compoundtrading.com/overview-features/
- Any questions send me an email [email protected]
- Daytrading room now re-open to daytrading room members as lead trader alerts via email. For access please email us at [email protected].
- July 28 – 29, Santo Domingo – #IA Intelligent Assisted Platform (private, internship & staff training / development).
- Aug 25 – 26, Santo Domingo – Oil Algorithm (EPIC) Multi-User License Trade Execution & Integration (private invitational, institutional).
- Sept 14 – 16, Cabarete – Trade Coaching Event – Learn How to Trade or Take Your Trading to the Next Level (public, retail).
A Tidbit About our Structured Algorithmic Models
“The thing about our algorithmic structured models is that we get the structure first, and then math can explain how to get there. The math confirms the model but doesn’t provide us with the model. We start at the end result and then confirm it with conventional math.
And yes, in our trading bootcamp we do teach this process. The process of how we get there – all steps except the black box final gen models (gen 5). But yes, generation 1 thru 4 models and the process therein I teach to our attendees and record it for home study thereafter.”
The thing about our algorithmic structured models is that we get the structure first, and then math can explain how to get there. The math confirms the model but doesn't provide us with the model. We start at the end result and then confirm it with conventional math.
— Melonopoly (@curtmelonopoly) July 18, 2018
Today’s Huge Oil Trade Win. Exactly How It Was Done. How I Knew & How You Can Too.
https://twitter.com/CompoundTrading/status/1012166019765370881
May 29 Memo: Important Changes at Compound Trading – Pricing, Trader Services, Trader Procedure, Invoicing.#IA #AI #Algorithms #Coding
Machine Trading Coding Team Mandate: (1) Intelligent Assisted #IA Trading Platform (Code Algorithm Models), (2) Run 24 Hour Crypto Trading Desk, (3) Alert Trade Set-ups to Member Alert Feeds (for all models) and near future (4) Machine Learning. Official announcement to follow.
Premarket Report: On lead trader availability basis only (the premarket reports are not published every market day).
Private Member Discord Server Chat Rooms: BE SURE to get in to each private Discord server specific to your specific subscription type (bundles) – many of the updates as we go forward will be posted in there and detailed trading plans for alerted trades are often discussed by our lead trader in the rooms. This includes the SWING TRADING platform also. IF YOU NEED A LINK / INVITE email us.
https://twitter.com/CompoundTrading/status/880670140454637569
Real-time Trade Alerts:
Real-time Trade Alerts for Oil, Swing Trading, Day Trading, Bitcoin are available to subscribers by following specific alert Twitter feeds. Oil Trading Alerts, Swing Trading Alerts, Day Trading Alerts, Bitcoin Trading Alerts.
Disclaimer / Disclosure:
Subscribers must read disclaimer.
Recent Blog / Video / Social Posts:
#BitcoinTrading 101: A Beginner’s Guide to Getting Started $BTCUSD $XBTUSD $BTC https://compoundtrading.com/bitcointrading-101-beginners-guide-getting-started-btcusd-xbtusd-btc/ …
https://twitter.com/CompoundTrading/status/927397024315662336
How to Use EPIC Oil Algorithm: $USOIL, $WTI, $CL_F, $USO, $UCO, $SCO, $UWT, $DWT, #OIL, #OOTT: http://youtu.be/hawVV31G9bg?a via @YouTube
https://twitter.com/CompoundTrading/status/889148655785177088
How to Use ROSIE Gold Algorithm: #GOLD, $GLD, $XAUUSD, $GDX, $GDXJ, $NUGT, $DUST, $JNUG, $JDST
https://twitter.com/CompoundTrading/status/889147527278333952
Recent Chart / Trade Set-Ups:
See You Tube for other recent video posts. Listed from most recent.
“The Nut Hand” Today’s Huge Oil Trade Win. Exactly How It Was Done. How I Knew & How You Can Too.
How to Swing Trade Like the Pros and Win Most Trades. #swingtrading #freedomtraders
Password: IC Protected: How to Trade Allergan (AGN) Stock Move (Exclusive) $AGN #swingtrading #daytrading #chart
Password: TRADEAAPL Protected: Trading Apple’s Stock Move (Member Exclusive) $AAPL #swingtrading
Password: SWINGDXY, Protected: Trading US Dollar Index (Part 2 – Member Exclusive) $DXY $UUP #USD #SwingTrading #Daytrading
Password: swing Protected: Trade Set-Ups w/ Video #EIA, Oil, $TSLA, $NFLX, $ESPR, $PG, $AAPL, $SPY, $CARA, $EGY, $GERN, $BPT more. #swingtrading
Feature Post with Charting: How to Trade the US Dollar Index Move (Part 1) $DXY $UUP #USD #trading #chart #algorithm https://compoundtrading.com/feature-post-with-charting-how-to-trade-the-us-dollar-index-move-part-1-dxy-uup-usd-trading-chart-algorithm/
Password: SET Protected: Swing Trade Set-Ups (May 15/16 Member Edition) $WTI, #OIL, $BTC, Bitcoin, $AMBA, $AMD, $BLNK, $ITCI,, $SPY, $DIS, $LAC, $BOX, $AAOI more.
Password: AI Protected: How to Trade Pure Storage Earnings in Six Days (Member Edition) $PSTG
Password: WOW Protected: How to Trade Box Earnings Move (Swing Trade Member Exclusive)
Trading Set-ups $FB, $AMBA, $SDTY, $TSLA, $GDX, $SLV, $BTC, $JD, $VIX, $LITE, $CELG, $FSLR more.
Do Not Ignore This Trade Set-Up | $AMBA Swing Trade | 40% ROE 3 Mos (Part 1 of 2)
Password: ELON Protected: How to Trade the Tesla Move | Price Targets | Buy Sell Triggers | Time Cycles $TSLA #swingtrading #daytrading
Password: LONG Protected: Overnight Oil Trade | Trading Plan in Detail | EPIC Oil Algorithm $USOIL $WTI $CL_F #OIL $USO #Alerts
Recent Educational Articles / Videos:
I get a lot of Q’s on How to Trade our models, this vid has 5 min explanation at 1:00 min-6:00 min. https://www.youtube.com/watch?v=QrXbE7lojAg&t=3s … – Fib Trendlines, Trading structure/quads, Price targets, Main support resistance (buy sell triggers), Time cycles, Moving averages, Trading trims/adds.
I get a lot of Q's on How to Trade our models, this vid has 5 min explanation at 1:00 min-6:00 min. https://t.co/oqezvVcn0y … – Fib Trendlines, Trading structure/quads, Price targets, Main support resistance (buy sell triggers), Time cycles, Moving averages, Trading trims/adds.
— Melonopoly (@curtmelonopoly) May 13, 2018
Trading Plan (Buy, Hold, Sell) Watch Lists. Morning Momentum / Gap / News / PR / IPO / SEC Filings / Earnings Stocks on Watch:
28 Stocks Moving In Wednesday’s Pre-Market Session https://benzinga.com/z/12036398 $CBIO $ERIC $ADAP $NOK $UAL $CSX $MS $TXT $WIN $SAH $HCSG $CARA $UNIT
https://twitter.com/CompoundTrading/status/1019559212698005504
11 Stocks To Watch For July 18, 2018 https://benzinga.com/z/12035587 $AA $ABT $AXP $MS $EBAY $UAL $CSX $USB $CARA $IBM $TXN
Market Observation:
Markets as of 7:56 AM: US Dollar $DXY trading 95.36, Oil FX $USOIL ($WTI) trading 67.53, Gold $GLD trading 1222.14, Silver $SLV trading 15.42, $SPY 280.78, Bitcoin $BTC.X $BTCUSD $XBTUSD 7418.00 and $VIX trading 11.9.
Momentum Stocks to Watch: $PRPO $CBIO $ERIC $ADAP
Precipio reports preliminary Q2 and 1H revenues; shares ahead 65% premarket https://seekingalpha.com/news/3370992-precipio-reports-preliminary-q2-1h-revenues-shares-ahead-65-percent-premarket?source=feed_f … #premarket $PRPO
News:
Your Wednesday morning Speed Read:
– Google to be hit with record $5B antitrust penalty by the EU $GOOGL 💸
– Novartis to join Pfizer in halting U.S. drug price hikes $NVS
– Tesla’s Elon Musk apologizes to diver in Thai cave rescue for calling him a “pedo guy” $TSLA
Your Wednesday morning Speed Read:
– Google to be hit with record $5B antitrust penalty by the EU $GOOGL 💸
– Novartis to join Pfizer in halting U.S. drug price hikes $NVS
– Tesla's Elon Musk apologizes to diver in Thai cave rescue for calling him a "pedo guy" $TSLA— Benzinga (@Benzinga) July 18, 2018
$IMMU Immunomedics (IMMU) Reports FDA Acceptance of Biologics License Application for Filing and Granted Priority Review for Sacituzumab Govitecan http://www.streetinsider.com/FDA/Immunomedics+%28IMMU%29+Reports+FDA+Acceptance+of+Biologics+License+Application+for+Filing+and+Granted+Priority+Review+for+Sacituzumab+Govitecan/14409598.html … via @Street_Insider
Recent SEC Filings:
Insider Buys Of The Week: Energen, Esperion Therapeutics And International Flavors https://benzinga.com/z/12020928 $EGN $ESPR $IFF
Recent IPO’s:
New IPO pricing : $RUBY 10.3M shares at $23 and $CRNX 6m shares at $17
$CRNX Crinetics Pharmaceuticals prices IPO at $17 a share
Earnings:
#earnings for the week
$NFLX $BAC $MSFT $GE $BLK $GS $UNH $IBM $JNJ $CLF $JBHT $PGR $ABT $MS $ISRG $AXP $SKX $AA $CSX $URI $PM $CDMO $CMA $DPZ $GWW $NUE $BX $HON $EBAY $ASML $FHN $TSM $SLB $NEOG $MLNX $UAL $PLD $TXT $IBKR $ETFC $CTAS $FDEF $KEY $DHR
http://eps.sh/cal
#earnings for the week$NFLX $BAC $MSFT $GE $BLK $GS $UNH $IBM $JNJ $CLF $JBHT $PGR $ABT $MS $ISRG $AXP $SKX $AA $CSX $URI $PM $CDMO $CMA $DPZ $GWW $NUE $BX $HON $EBAY $ASML $FHN $TSM $SLB $NEOG $MLNX $UAL $PLD $TXT $IBKR $ETFC $CTAS $FDEF $KEY $DHR https://t.co/r57QUKKDXL https://t.co/Gj3ALfmyvN
— Melonopoly (@curtmelonopoly) July 16, 2018
Trade Set-up Alerts, Charts & Reports. Recent / Current Holds, Open and Closed Trades:
Please refer to the date on the top of each chart (they are often carried forward).
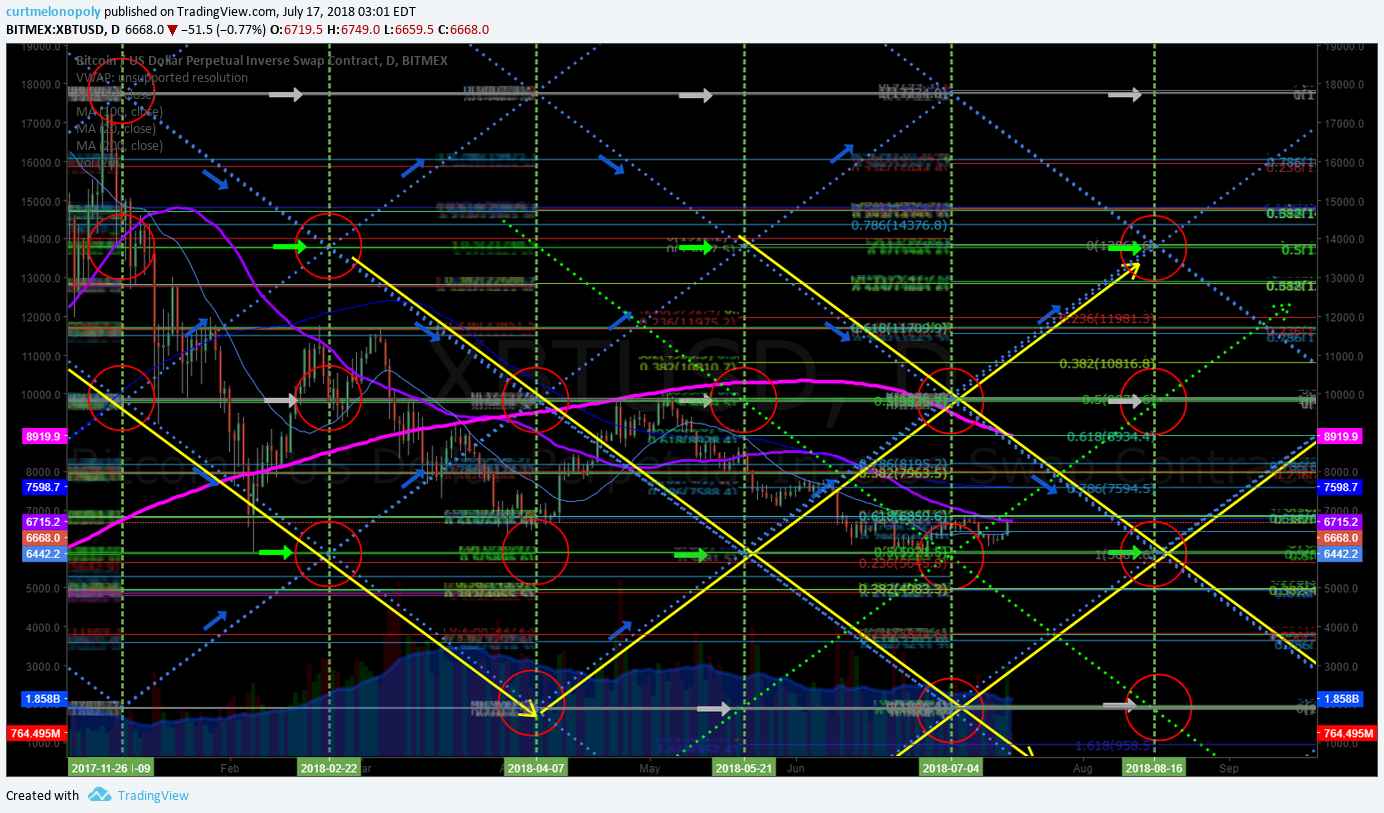
Bitcoin trading like a conventional equity now. Launched off 50 MA testing 100 MA resistance soon. $BTCUSD $BTC #Bitcoin #premarket https://twitter.com/CryptotheAlgo/status/1019561358600409088

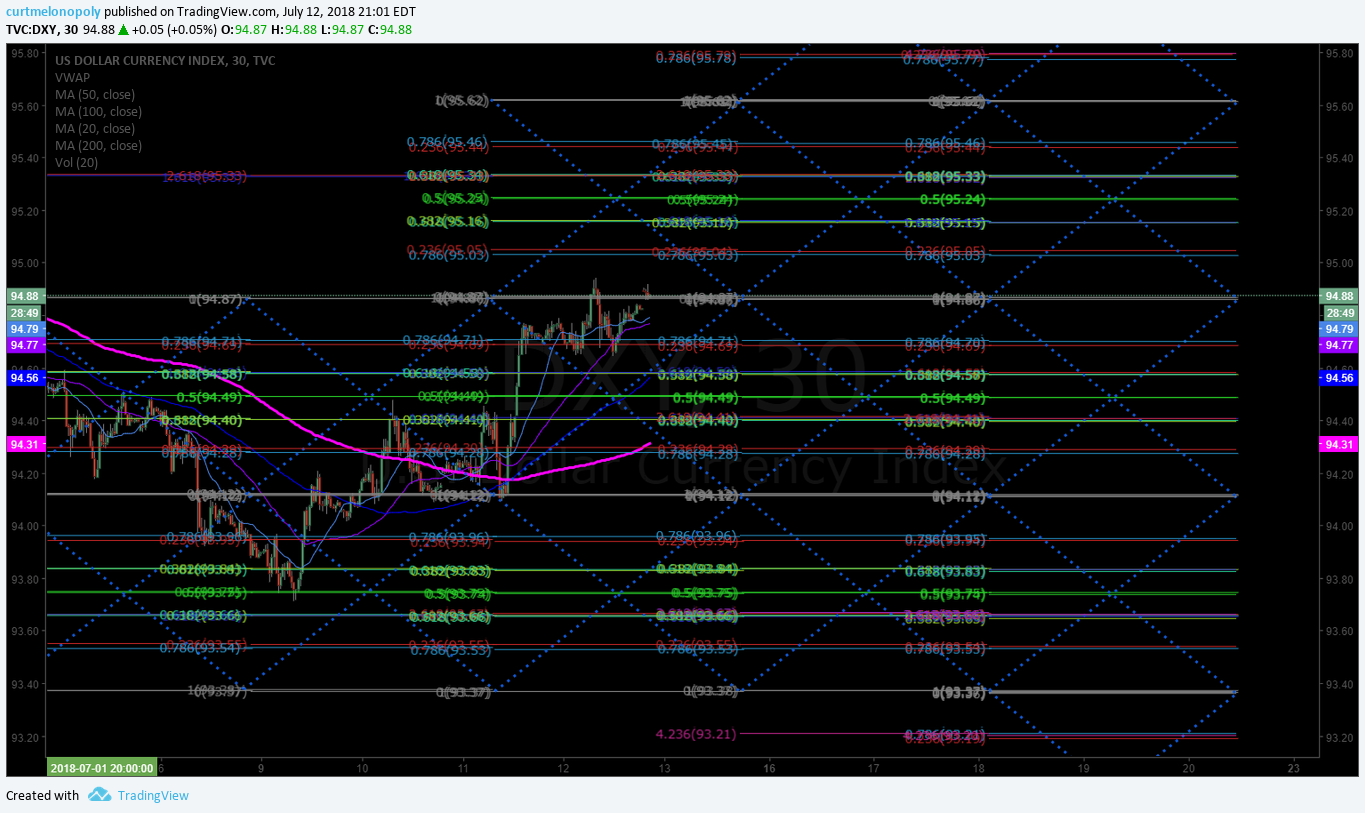
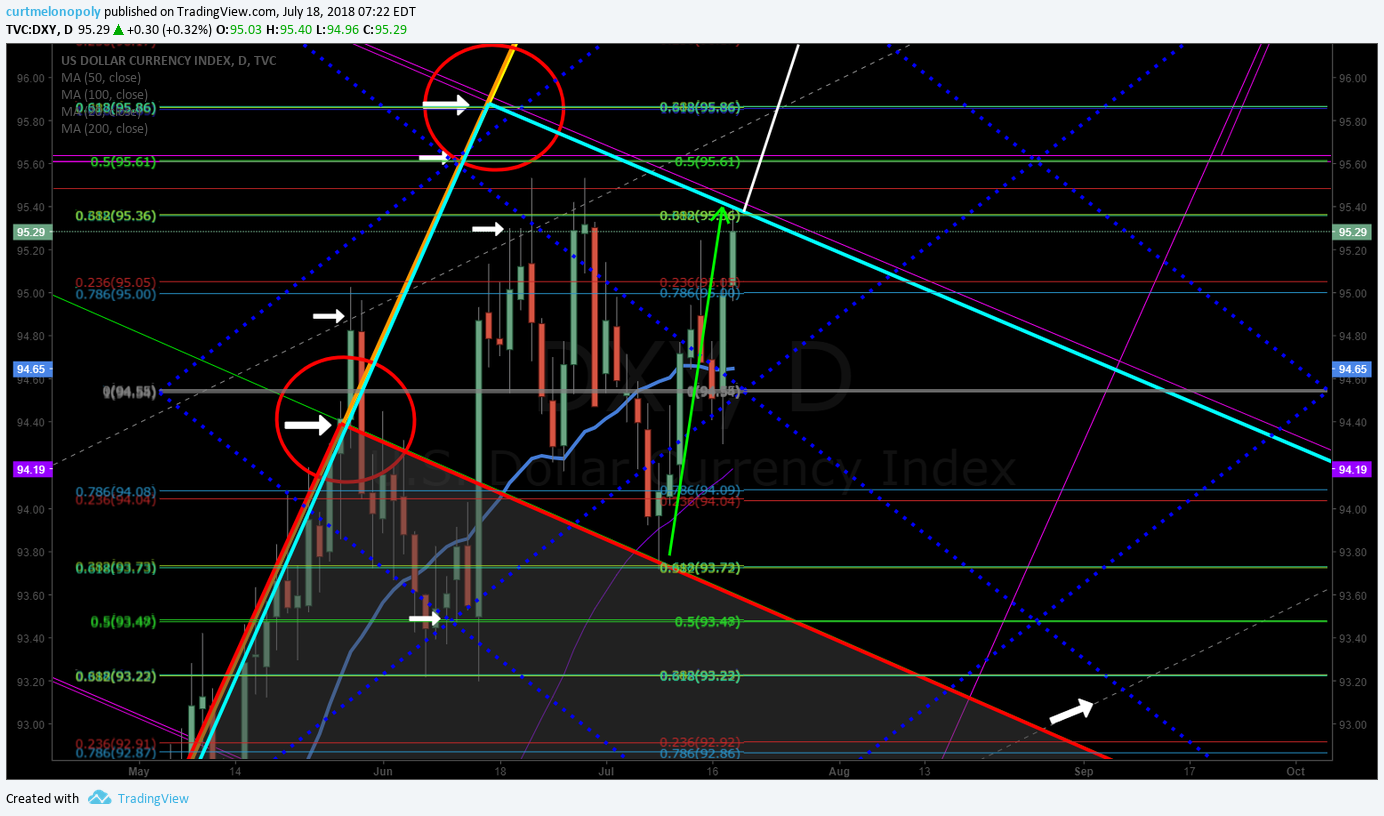
US Dollar Index (DXY) Chart. Perfect move from structure to structure at resistance now to next possible. $DXY $UUP #USD #swingtrading #dollar

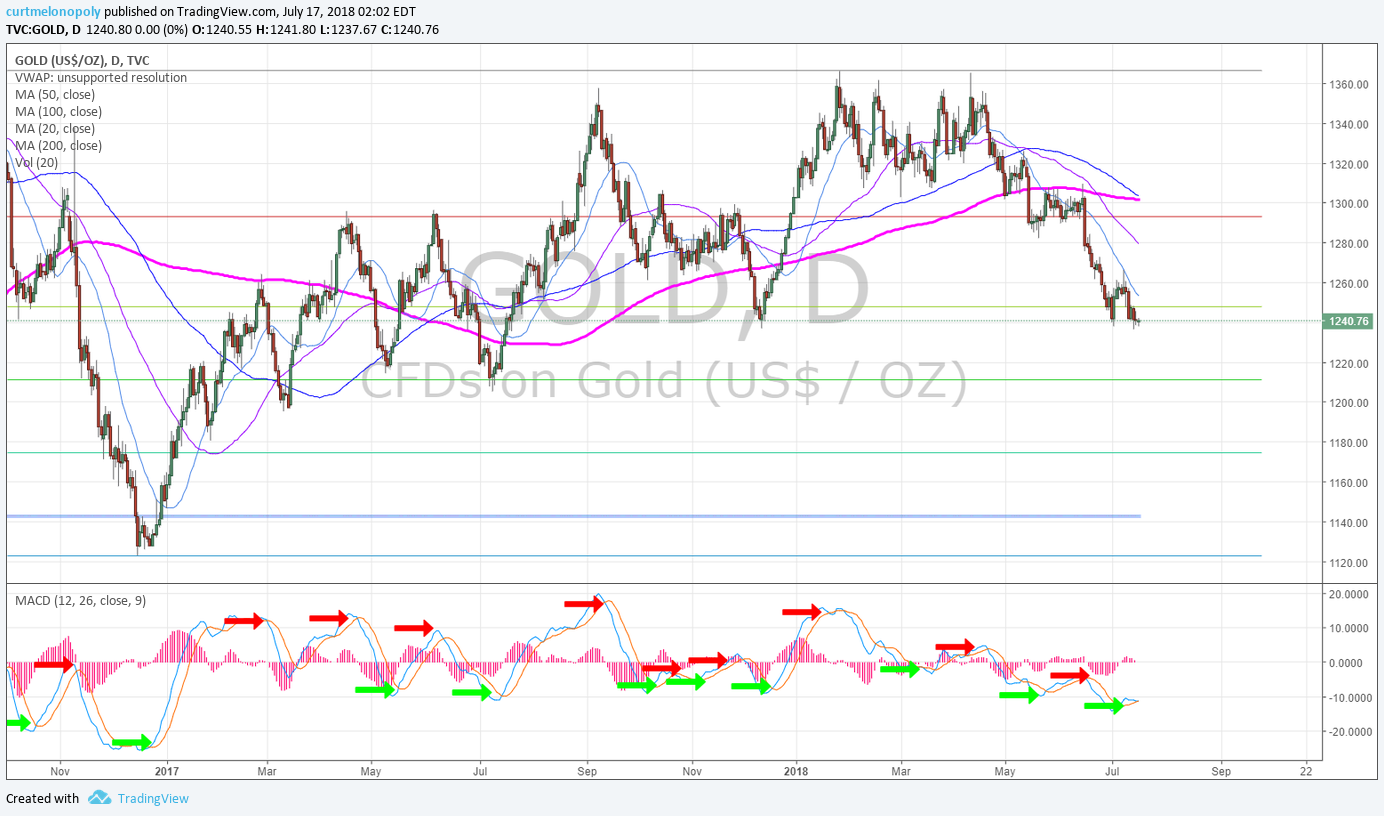
Gold chart (Daily) MACD may cross up here at previous December low support test. #GOLD #CHART $GC_F $XAUUSD $GLD

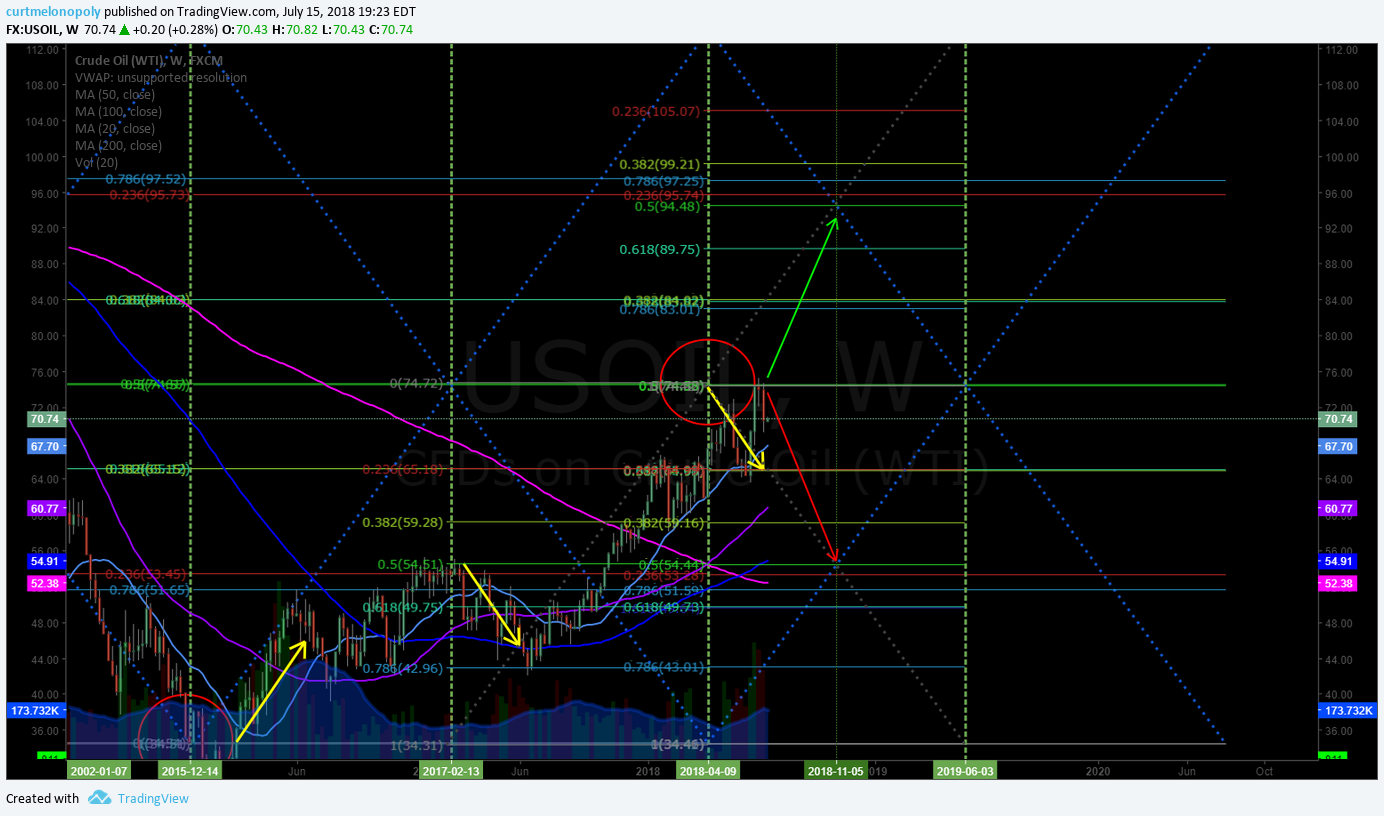
Gold chart monthly – trade sitting on 50 MA test and under bottom trendline. #Gold #Chart $GLD $XUAUSD $GC_F

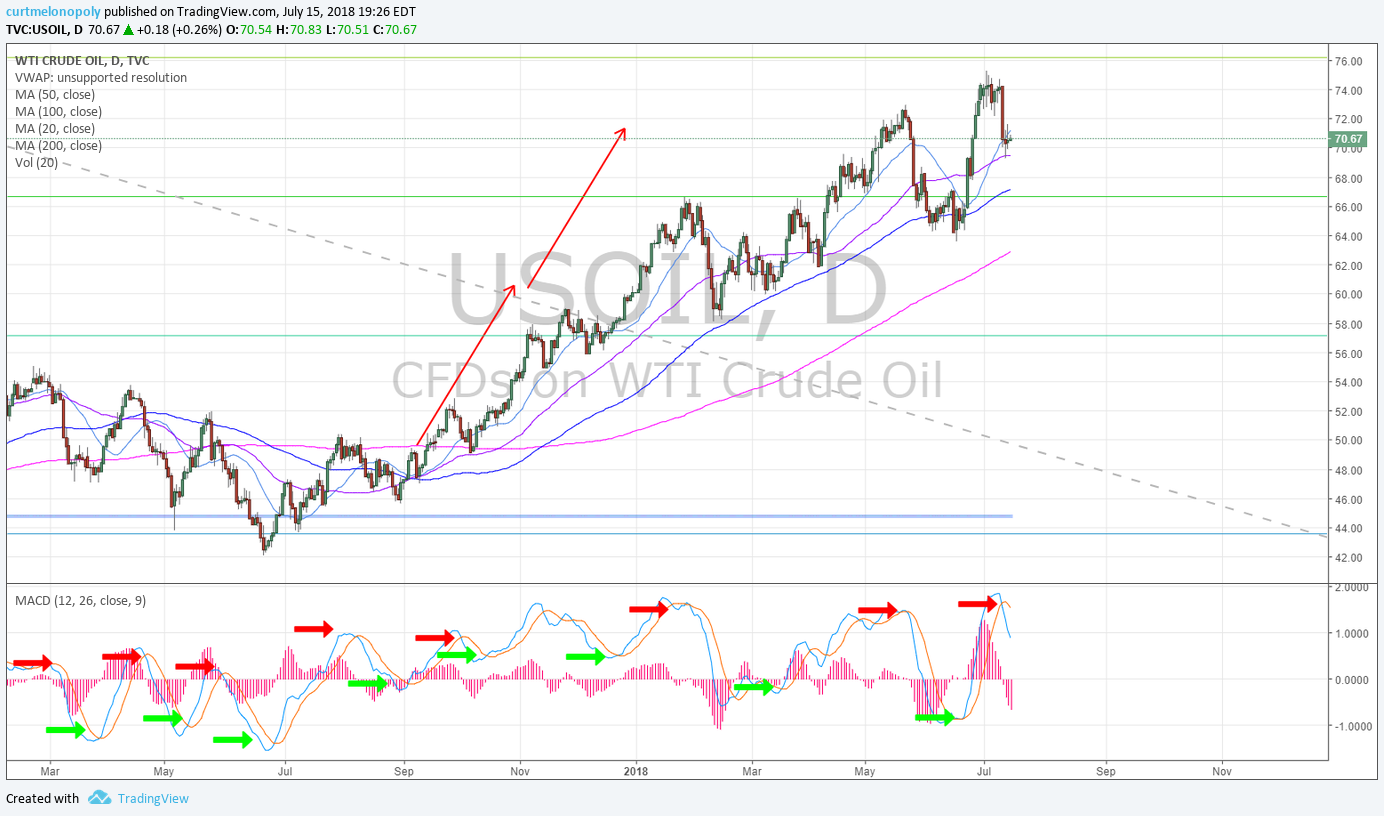
MACD has turned down on the Daily Oil Chart. Bearish indicator to consider. Needs to stay above 20 MA. #OIL $USOIL $WTI

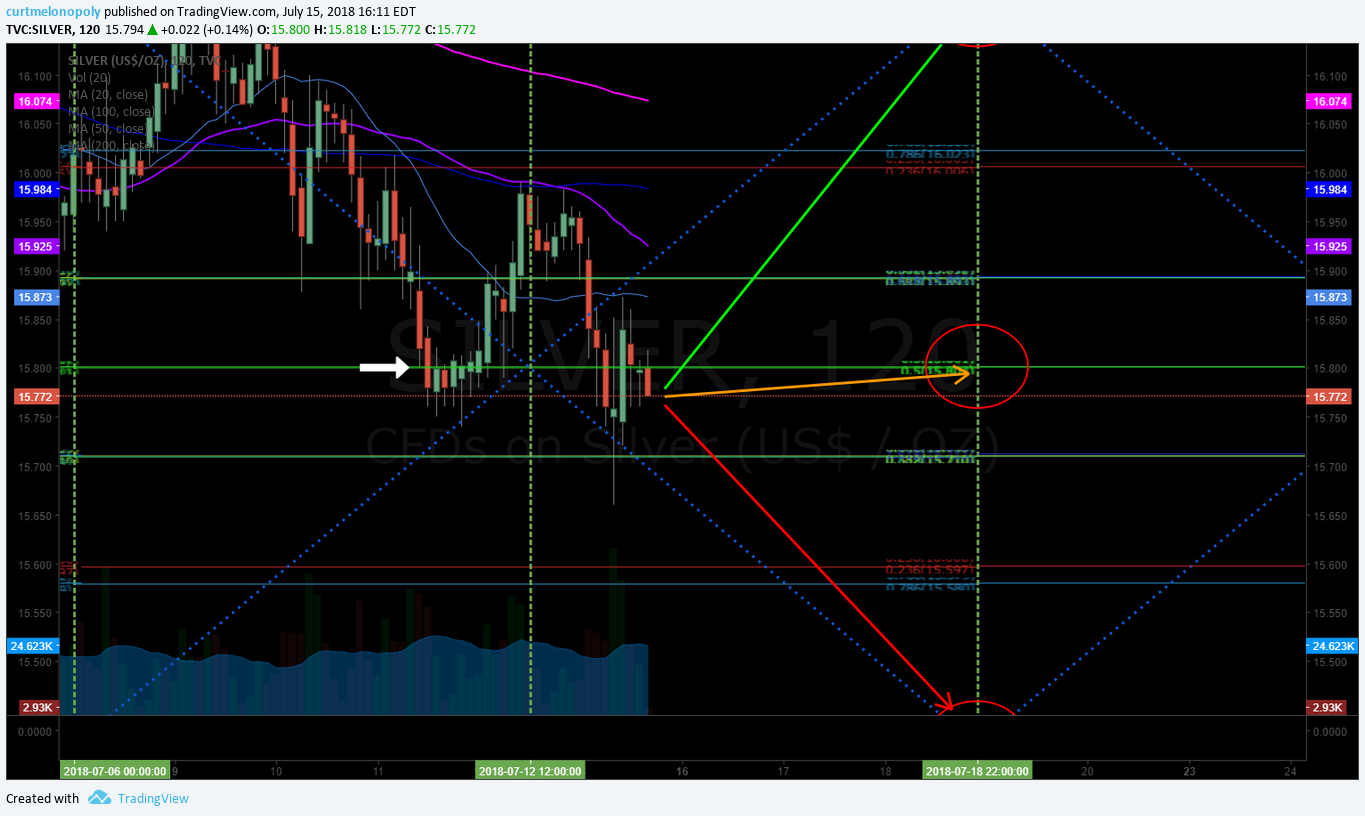
SILVER likely to get a bounce at pivot area to test underside of diagonal trend line #onwatch

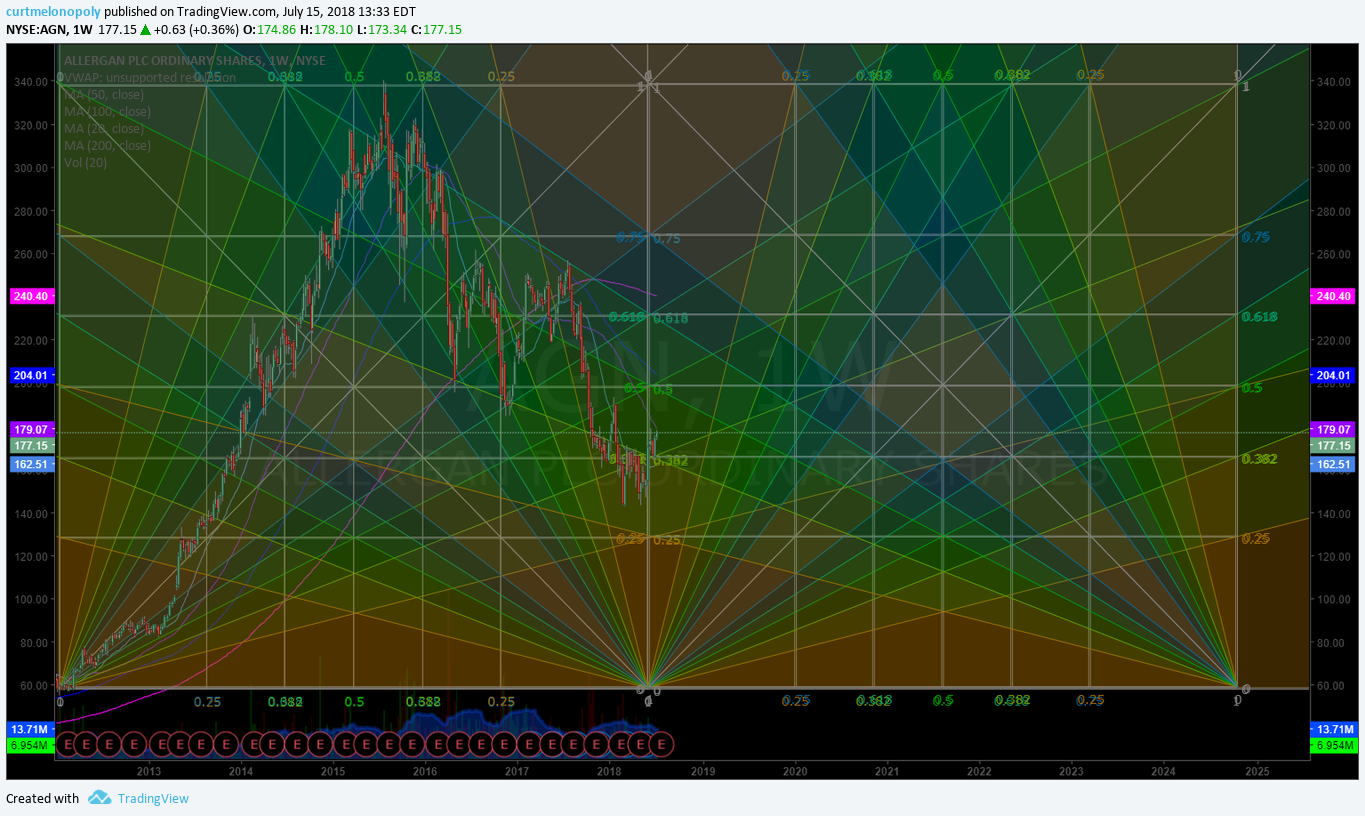
ALLERGAN (AGN). Excellent swing trade in progress trading 177s targets 180.21 184.21 189.03 etc. $AGN #chart

NETFLIX (NFLX) Triggering long in premarket over 400.00 targets 412.00 then 422.00 a key range pivot resistance. $NFLX #swingtrading

CITIGROUP INC (C) Keeps working that support line. No bias here. Watching. $C #stock #chart

EAGLE BUILDING MATERIALS (EXP) Trading 111.05 trending toward 117.75 Nov 2, 2018 price target. $EXP #swingtrading

ALPHABET (GOOGL) Swing trade setup has been going well. 1213.50 July 3 price target in play. $GOOGL #swingtrading

FACEBOOK (FB) swing trade on schedule and target trading 201.15 – over 201.80 bullish targets 202.41 206.58 main 209.97 June 21 or July 6 $FB #swingtrading

150s to 201s Boom $FB We’re in from the 150 s on that great wash-out snap back swing trade set-up trading 201.74 #swingtrading #snapbacktrade #learntotradefear

Market Outlook, Market News and Social Bits From Around the Internet:
#5things
– Google fine
– Trump clarification
– Pound plunge
– Markets rise
– Coming up…
https://bloom.bg/2uxc9CD
Economic Data Scheduled For Wednesday
Economic Data Scheduled For Wednesday pic.twitter.com/UtZtPoZRuI
— Benzinga (@Benzinga) July 18, 2018
If you are new to our trading service you should review recent blog posts, the Compound Trading YouTube Channel and at minimum our algorithm Twitter feeds because they do tell a story in terms of the market and how the inflections of the market determine our day to day trading. You will notice the algorithmic modelling has been undeniably accurate with many time-frames (intra-day, weeks and months out) so I myself have learned to respect the math (they have taken me from a 60% hit rate to 80%+ all publicly posted live trade alerts).
Momentum Stocks (Market Open and Intra-Day):
I do trade morning momo stocks, but I do avoid much of the day trading risk (preferring to daytrade only what is structurally set-up also on the swing trade side and to my advantage in the algorithmic model charting). I often avoid the first 30 minutes (gap and go) and trade momentum stocks or structured (per explanation in previous sentence) stocks later in day after a wash-out looking for a snap-back trade that can possibly also become a strong swing or longer term trade that I can leg in to. Just prior to open and shortly after open I post momentum stocks to the trade chat room (and Twitter and Stocktwits if I have time).
Some of my Favorite Intra-day Trading Set-Ups:
(1) Momentum Stock Wash-Outs for Snap Back, (2) Bad News Wash-outs on Stocks with High Institutional Ownership, (3) Getting on the Right Side of a Trend Change and scaling in my position and (4) Our Algorithm Charting Model Set-Ups.
The momentum stocks (from previous days and morning trade) I continue to watch through the day for indicators that allow a trade.
Morning Stock Watch-Lists for my Favorite Set-Ups:
(1) Pre-Market Gainers Watch-List: Top % Gainers: $PRPO, $CEI, $CBIO $UUUU $ERIC $CLRB $TOPS $ATOS $NOG $MDGS $MTG $UAL $CSX $NOK $FPI $MBRX $FCEL $ADAP $ASML $MS $AAL
(2) Pre-market Decliners Watch-List :
(3) Other Watch-List:
(4) Regular Algo Charting Watch-List: Gold $GC_F $GLD, Miners $GDX ($NUGT, $DUST, $JDST, $JNUG), Silver $SLV $SI_F ($USLV, $DSLV), Crude Oil FX: $USOIL $WTI ($UWT, $DWT, $USO, $UCO, $CL_F, $UWT, $DWT), Natural Gas $NG_F ($UGAZ, $DGAZ), S & P 500 $SPY $ES_F ($SPXL, $SPXS), US Dollar Index $DXY ($UUP), Volatility $VIX ($TVIX, $UVXY), $BTCUSD Bitcoin.
(5) Recent Upgrades: $AVP $BWA $CXO $PAA $CF $CDW $LTXB $SUN $CMA $MPLX $FPI $BMO $CSX $ALL
(6) Recent Downgrades: $FHN $NFX $AVGO $ALV $VC $ANDX $CLX $UHS $HCSG $KL $PCAR $RYN $EXR $TWTR $FHN $MMP $IRWD $COLM $UNIT $WIN $COTV $CIEN
Stay tuned in Stock Chat Room for more pre-market stocks on watch.
Study:
For new readers, a review of our unlocked posts on our blog would help you get in to the story we are following with the securities listed in this newsletter.
Free scanners to find momentum stocks that you can easily review charts of for indicators that bring probability of your trade being successful up considerably. These are not useful for first 30 minute market open gap and go type plays (you need a good momentum scanner, level 2, and best to have hot-keys for the first 30 mins of gap and go trading)… but are very useful for intra day scalping and swing trading (start with trending stocks and then look at indicators intra for simple set-ups – study scan study scan study scan).
http://finviz.com/
https://finance.yahoo.com/screener/predefined/ec5bebb9-b7b2-4474-9e5c-3e258b61cbe6
http://www.highshortinterest.com/
http://www.gurufocus.com/short-stocks.php
http://www.3xetf.com/all/
http://www.etf.com/channels/gold-etfs
GL!
Curtis
Algorithm Twitter feeds can be found here: $BTC (@CryptotheAlgo) $WTI (@EPICtheAlgo), $VIX (@VexatiousVIX), $SPY (@FREEDOMtheAlgo), $GLD (@ROSIEtheAlgo), $SLV (@SuperNovaAlgo), $DXY (@DXYUSD_Index). Our Swing Trading Twitter feed is found here: https://twitter.com/swingtrading_ct. Our lead trader Twitter feed is here @curtmelonopoly
Article Topics: Premarket, Watchlist, Stocks, Trading, Plan, $PRPO, $CBIO, $ERIC, $ADAP, #EIA, OIL, $WTI, GOLD, $GLD, Crypto, $BTC , US Dollar, $DXY