Skip to content

Compound Trading Group

  • About
  • White Paper
  • Returns
  • News
    • NOTICE of Online Information Meetings
  • Order
    • Terms
  • About
  • White Paper
  • Returns
  • News
    • NOTICE of Online Information Meetings
  • Order
    • Terms

Yearly Archives: 2018

  1.   »  
  2. Yearly Archives: 2018

Year: 2018

How to Trade Pure Storage (PSTG) Earnings in Six Days (Member Edition) $PSTG #swingtrading #daytrading

How to Trade Pure Storage (PSTG) Earnings in Six Days (Member Edition) $PSTG #swingtrading #daytrading

May 16, 2018June 9, 2018 Swing TraderSwing Trading$PSTG, Chart, earnings, How To, Swing Trade

How to Trade Pure Storage (PSTG) Earnings in Six Days.

Pure Storage technical swing trade chart set-up with buy / sell triggers and price targets.

May 16, 2018

What’s New

  • Now available for serious traders, information here for our exclusive Legacy All Access Membership.
  • 24 Hour Crypto Trading Desk opens mid May 2018 along with our Coding Algorithm Models for Machine Trading. This team is also responsible for alerting trades on the live Twitter alert feeds for all models. Formal announcements to follow.

PSTG Earnings Date
Earnings announcement* for PSTG: May 21, 2018

https://www.nasdaq.com/earnings/report/pstg

Below is the link for the real-time Pure Storage chart with all buy sell triggers and price targets;

https://www.tradingview.com/chart/PSTG/GLswoEx0-How-to-Trade-Pure-Storage-Earnings-in-6-days-PSTG-swingtrading/

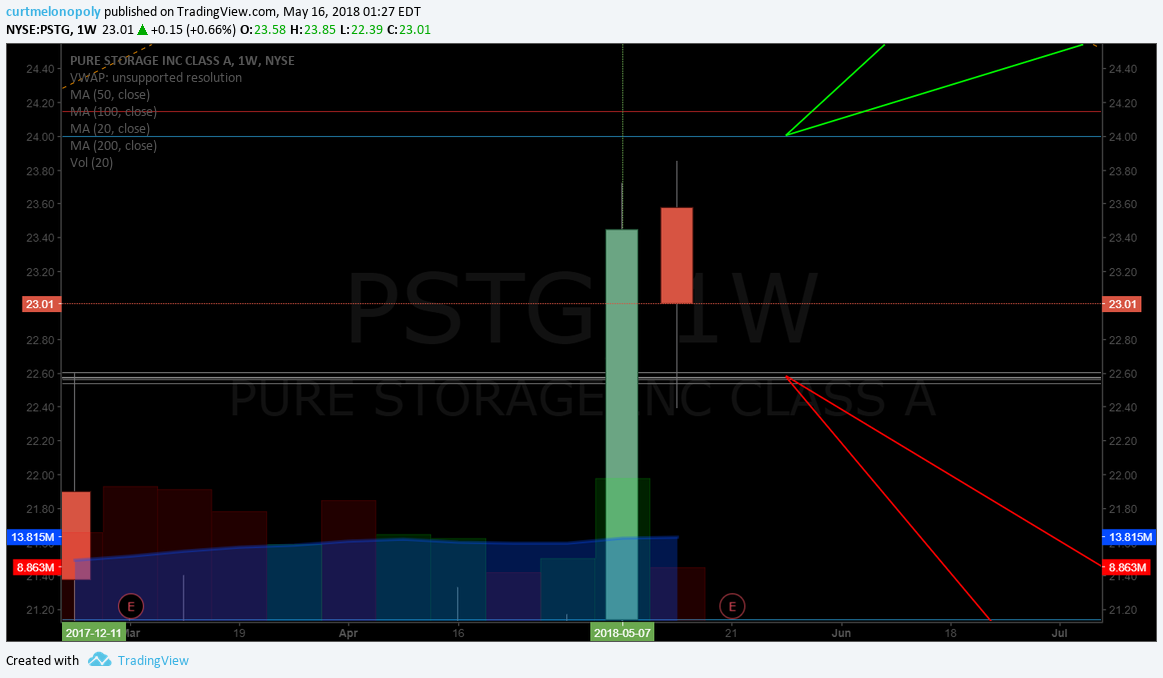
The Pure Storage Swing Trade Set-Up

PSTG closed 23.01 Tuesday with earnings in six days.

Important trade support is at 22.50 area (gray horizontal line) also marked with a white arrow.

White arrows are the most important buy sell triggers on the chart.

Above 22.50 (give it some room) it is a long to next resistance 24.00 area (horizontal lines on chart are resistance / support lines depending on what side of the line trade is on). Next on upside is 24.14 and then 25.12, then 25.44 and 25.91 area.

Under 22.50 area it targets support at 21.14 and then 21.00 then 20.03 and 19.71.

Price targets on model to bullish side are 25.91 and really bullish 29.19 Oct 1 2018. Trade toward target with price action using support and resistance points.

Downside scenario has 19.23 and 15.92 (most bearish) price targets Oct 1 2018.


How to Trade Pure Storage Earnings in 6 days $PSTG #swingtrading by curtmelonopoly on TradingView.com

$PSTG, pure storage, chart, earnings, trade
How to Trade Pure Storage Earnings in 6 days $PSTG #swingtrading

May 14 Article:

Pure Storage Clears Data Bottlenecks On Road To Artificial Intelligence https://www.investors.com/research/the-new-america/pure-storage-artificial-intelligence/?src=A00220&yptr=yahoo

In Closing:

A few hours of trade coaching or study on exactly how to trim in to resistance and how to add to your positions on winners and how to cut losses properly and quickly will return huge dividends.

You can subscribe to our Weekly Swing Trading Newsletter service here, use temporary Promo Code “30P” for 30% off Reg 119.00 Sale Price 83.30.

Or click here to subscribe and get 30% off Real-Time Swing Trading Alerts Reg 99.00 Sale Price 69.37 use temporary Promo Code “Deal30” for 30% off.

I personally guarantee our swing trading service is one of the best in the business and it’s very reasonably priced considering the technical expertise invested in the platform.

Any questions feel welcome to contact me anytime.

Good luck with your $PTSG Pure Storage earnings trade and if you need any help message me anytime!

Best,

Curt

If you are not already on our Free Swing Trading Periodical email list follow the link here to get on it to receive trading set-ups in the future. Unsubscribe anytime.

Connect:

Register to free email list for trade set-ups, webinars, special events: https://compoundtrading.com/contact/

Website: https://compoundtrading.com

Free chat room: https://discord.gg/2HRTk6n

Subscribe: https://compoundtrading.com/overview-…

Twitter: https://twitter.com/CompoundTrading

Lead Trader: https://twitter.com/curtmelonopoly

Tradingview: https://www.tradingview.com/u/curtmel…

Facebook: https://www.facebook.com/compoundtrad…

StockTwits: https://stocktwits.com/compoundtrading

Email: https://info@compoundtrading.com

Compound Trading Platform: Algorithm model charting for $SPY, $VIX, #OIL, #GOLD, #SILVER, #Crypto ($BTC Bitcoin, $ETH, $LTC, $XRP,) $DXY US Dollar and Swing Trading Newsletter. Live trading rooms for daytrading and oil traders. Private coaching and live alerts.


Read More
PreMarket Trading Plan Tues May 15: $CLWT, $SORL, $XENE, $RCON, $DIS, $ITCI, $HTZ, $BOX, $EDIT more.

PreMarket Trading Plan Tues May 15: $CLWT, $SORL, $XENE, $RCON, $DIS, $ITCI, $HTZ, $BOX, $EDIT more.

May 15, 2018June 9, 2018 Curt MelonopolyTrading Plan$CLWT, $DIS, $EDIT, $HTZ, $ITCI, $RCON, $SORL, $XENE, BOX, Plan, Premarket, Stocks, Trading, Watchlist

Compound Trading Trading Plan and Watch List Tuesday May 15, 2018. 

In this issue: $CLWT, $SORL, $XENE, $RCON, $DIS, $ITCI, $HTZ, $BOX, $EDIT, $SPY, $BTC, $ETHUSD, OIL, $CALA, $EXP and more.

Welcome to the morning Wall Street trading day session at Compound Trading!

Notices:

Quick Update: Reporting, Live Rooms, New Team Members, Pricing, Discounts, Trade Coaching, New Book https://compoundtrading.com/quick-update-reporting-live-rooms-new-team-members-pricing-discounts-trade-coaching-new-book/

What’s New at Compound Trading April / May 2018. https://compoundtrading.com/whats-new-at-compound-trading-april-may-2018/

Price Increase: Platform wide price increase May 15, 2018. Does not affect existing members. Official announcement to follow.

Machine Trading: May 15, 2018 the new teams start. Mandate: (1) Intelligent Assisted #IA Trading Platform (Code Algorithm Models), (2) Run 24 Hour Crypto Trading Desk, (3) Alert Trade Set-ups to Member Alert Feeds (for all models) and near future (4) Machine Learning. Official announcement to follow.

Notes in red text below are new comments entered specifically today (or recently important).

Live Trading Room Link:

http://compoundtrading1.clickmeeting.com/livetrading

Real-time Alerts for Oil, Gold, Swing Trading, Day Trading, Bitcoin are available by following specific alert Twitter feeds.

Disclaimer / disclosure: Every subscriber must read this disclaimer.

Reporting and Next Gen Algorithms:

BE SURE to get in to each private Discord server specific to your subscription as many of the updates as we go forward will be posted in there. This includes the SWING TRADING platform also.

IF YOU NEED A LINK / INVITE email or DM us!

Connect with us on Discord.

https://twitter.com/CompoundTrading/status/880670140454637569

Recent Blog / Video / Social Posts: 

#BitcoinTrading 101: A Beginner’s Guide to Getting Started $BTCUSD $XBTUSD $BTC https://compoundtrading.com/bitcointrading-101-beginners-guide-getting-started-btcusd-xbtusd-btc/ …

https://twitter.com/CompoundTrading/status/927397024315662336

How to Use EPIC Oil Algorithm: $USOIL, $WTI, $CL_F, $USO, $UCO, $SCO, $UWT, $DWT, #OIL, #OOTT: http://youtu.be/hawVV31G9bg?a via @YouTube

https://twitter.com/CompoundTrading/status/889148655785177088

How to Use ROSIE Gold Algorithm: #GOLD, $GLD, $XAUUSD, $GDX, $GDXJ, $NUGT, $DUST, $JNUG, $JDST

https://twitter.com/CompoundTrading/status/889147527278333952

Recent Chart / Trade Set-Ups: 

See You Tube for other recent video posts. 

Password ITCI: Protected: Trade Set-Ups (May 14 /15 Member Edition) $BOX, $ITCI, $SPY, $EEM, $PFE, $BTC, Bitcoin, SILVER, $SLV, $ETH, Ethereum, $EOG, $EDIT, $EXP more.

Password: WOW Protected: How to Trade Box Earnings Move (Swing Trade Member Exclusive)

Protected: Trade Set-Ups (May 8 Member Edition) $AAPL, $DIS, $AMD, $ITCI, $AAOI, $SNAP, $FB, $TSLA, $EDIT, $ESPR, $LITE, $LPSN, $SPY.

May 7 – Trade Set-Ups, Consolidated Review $SPY, $AAPL, $TSLA, $SNAP, OIL, $DXY, $VIX, GOLD, $DIS, Silver more.

Trading Set-ups $FB, $AMBA, $SDTY, $TSLA, $GDX, $SLV, $BTC, $JD, $VIX, $LITE, $CELG, $FSLR more.

Do Not Ignore This Trade Set-Up | $AMBA Swing Trade | 40% ROE 3 Mos (Part 1 of 2)

Password: ELON Protected: How to Trade the Tesla Move | Price Targets | Buy Sell Triggers | Time Cycles $TSLA #swingtrading #daytrading

Password: LONG Protected: Overnight Oil Trade | Trading Plan in Detail | EPIC Oil Algorithm $USOIL $WTI $CL_F #OIL $USO #Alerts

Trade Set-ups $SPY, $NFLX, OIL, $WTI, $ESPR, $GOOGL, Bitcoin, $BTC, $FEYE, $AAPL and more.

Trading Set-Ups $SPY, Gold, $GC_F, $GDX, Bitcoin, $GOOGL, $EVLV, $HEAR, $CHEK, $MARA, $PRTA, $ZDGE

Trading Set-Ups $NETE, $TSG, $ETH Ethereum, $BTC Bitcoin, $TAN, $HEAR, $AMMJ, $SNAP, $VLRX

Trade Set-Ups OIL, $WTI, $SPY, $GOOGL, $FSLR, $AXP, $GREK, $CELG, $AAOI, $SDRL, $WFT

Great Trading Last Few Wks – Lets Keep Going! $RIG, #OIL, $SPY, $ETH, $BTC, $FB, $GOOGL, $BWA, $GDX more.

Recent Educational Articles / Videos:

I get a lot of Q’s on How to Trade our models, this vid has 5 min explanation at 1:00 min-6:00 min. https://www.youtube.com/watch?v=QrXbE7lojAg&t=3s … – Fib Trendlines, Trading structure/quads, Price targets, Main support resistance (buy sell triggers), Time cycles, Moving averages, Trading trims/adds.

I get a lot of Q's on How to Trade our models, this vid has 5 min explanation at 1:00 min-6:00 min. https://t.co/oqezvVcn0y … – Fib Trendlines, Trading structure/quads, Price targets, Main support resistance (buy sell triggers), Time cycles, Moving averages, Trading trims/adds.

— Melonopoly (@curtmelonopoly) May 13, 2018

Trading Plan (Buy, Hold, Sell) Watch Lists. Morning Momentum / Gap / News / PR / IPO / SEC Filings / Earnings Stocks on Watch: 

Stocks making the biggest moves premarket: HD, ULTA, CBS, TSLA, F, WYNN & more –

Stocks making the biggest moves premarket: HD, ULTA, CBS, TSLA, F, WYNN & more – https://t.co/g5NO1T5SLw

— Melonopoly (@curtmelonopoly) May 15, 2018

25 Stocks Moving In Tuesday’s Pre-Market Session https://benzinga.com/z/11712868 $A $HAIR $ISNS $VIPS $HD $SWCH $APTO $BOXL $CLWT $LPTH $MYND $SORL $DAVE $XENE $VRX $SYMC

25 Stocks Moving In Tuesday's Pre-Market Session https://t.co/IM88xE4jNT $A $HAIR $ISNS $VIPS $HD $SWCH $APTO $BOXL $CLWT $LPTH $MYND $SORL $DAVE $XENE $VRX $SYMC https://t.co/25mIuNitLW

— Melonopoly (@curtmelonopoly) May 15, 2018

Market Observation:

As of 8:21 AM: US Dollar $DXY trading 92.67, Oil FX $USOIL ($WTI) trading 71.84, Gold $GLD trading 1306.89, Silver $SLV trading 16.36, $SPY 272.98, Bitcoin $BTC.X $BTCUSD $XBTUSD 8770.00 and $VIX trading 13.2.

Momentum Stocks to Watch: $CLWT $SORL $XENE $RCON 

News: 

$AYTU, $CLWT, $HTBX, $MDGS, $PFNX, $SGLB, $SORL, $XENE

$GILD KITE Announces New Worldwide Facilities and Expanded Collaboration With National Cancer Institute to Support Cell Therapy Pipeline

Recent SEC Filings: 

Recent IPO’s:

Earnings: 

#earnings for the week

$WMT $HD $AMAT $CSCO $M $JCP $DE $TTWO $BZUN $MZOR $NTES $KEM $A $VIPS $CSIQ $LONE $HQCL $MARK $SORL $JWN $DGLY $EXP $SWCH $AZN $CPB $NM $GDP $BCLI $MGIC $TGEN $KMDA $JACK $ATNX $HTHT $MANU $NINE $MTBC $VRTU $RXN $AMRS $FLO

http://eps.sh/cal

#earnings for the week $WMT $HD $AMAT $CSCO $M $JCP $DE $TTWO $BZUN $MZOR $NTES $KEM $A $VIPS $CSIQ $LONE $HQCL $MARK $SORL $JWN $DGLY $EXP $SWCH $AZN $CPB $NM $GDP $BCLI $MGIC $TGEN $KMDA $JACK $ATNX $HTHT $MANU $NINE $MTBC $VRTU $RXN $AMRS $FLO https://t.co/r57QUKKDXL https://t.co/EFUpuZmWFi

— Melonopoly (@curtmelonopoly) May 14, 2018

Trade Set-up Alerts, Charts & Reports. Recent / Current Holds, Open and Closed Trades:

$DIS long side trade doing well – IT IS AT a trim in to 200 MA zone intraday now.

$DIS, chart
$DIS long side trade doing well – IT IS AT a trim in to 200 MA zone intraday now.

$ITCI cleared the 50 MA getting in to first intra day resistance at red horiz lines

$ITCI cleared the 50 MA getting in to first intra day resistance at red horiz lines

$EDIT flying here hit 37.20 trim in to 37.60 add above – it’s a power move and thats mid quad resistance

$EDIT flying here hit 37.20 trim in to 37.60 add above – it’s a power move and thats mid quad resistance

$SPY up and over adds to next resistance 274.51 trim in to it add above

$SPY up and over adds to next resistance 274.51 trim in to it add above

$HTZ trading 17.89 premarket – trim in to 50 MA on hourly add above.

$HTZ trading 17.89 premarket – trim in to 50 MA on hourly add above.

Per recent;

$BOX Weekly Algorithmic Model Chart #earnings #trading

BOX, earnings, trade, set-up, howto
$BOX Weekly Algorithmic Model Chart #earnings #trading

Gold. Monthly. $XAUUSD $GC_F $GLD $NUGT $DUST $JDST $JNUG #Gold

Gold. Monthly. $XAUUSD $GC_F $GLD $NUGT $DUST $JDST $JNUG #Gold

Simple symmetrical time cycle on weekly, Volatility reversal leading in to July 23 ish probable. $VIX $UVXY $TVIX

Simple symmetrical time cycle on weekly, Volatility reversal leading in to July 23 ish probable. $VIX $UVXY $TVIX

$VIX under moving averages on Daily Chart and under lower bollinger. Long bias RR setting in.

$VIX under moving averages on Daily Chart and under lower bollinger. Long bias RR setting in.

Doesn’t really matter how you draw the lines – there’s a decision coming on Silver Weekly Chart. #Silver $SLV $USLV $DSLV

Doesn’t really matter how you draw the lines – there’s a decision coming on Silver Weekly Chart. #Silver $SLV $USLV $DSLV

Massive time cycle comes due late July on Gold Daily. Structure in place still. May 14 218 AM #Gold $GLD $GC_F $XAUUSD $NUGT $DUST

Massive time cycle comes due late July on Gold Daily. Structure in place still. May 14 218 AM #Gold $GLD $GC_F $XAUUSD $NUGT $DUST

With earnings on deck this week watch this one close. 118.00 upside 93.00 downside. Good range. $EXP

With earnings on deck this week watch this one close. 118.00 upside 93.00 downside. Good range. $EXP

$CALA targeting 3.00 range July 6. Trending down quad wall near perfect. Watch for bounce. #swingtrading

$CALA targeting 3.00 range July 6. Trending down quad wall near perfect. Watch for bounce. #swingtrading

Bull bear fight is on with dollar closing the week at the 50 MA. Watch that close. $DXY $UUP

Bull bear fight is on with dollar closing the week at the 50 MA. Watch that close. $DXY $UUP

$SPY Daily Chart, ending week bullish with a break above upper TL and 20 MA near breach 50 MA. $ES_F $SPXL $SPXS

$SPY Daily Chart, ending week bullish with a break above upper TL and 20 MA near breach 50 MA. $ES_F $SPXL $SPXS

Oil Monthly. Right at pivot, between 100 MA Resistance 200 MA Support. MACD SQZMOM trending up Stoch high. $USOIL $WTI $USO #OIL

Oil Monthly. Right at pivot, between 100 MA Resistance 200 MA Support. MACD SQZMOM trending up Stoch high. $USOIL $WTI $USO #OIL

Market Outlook, Market News and Social Bits From Around the Internet:

Economic Data Scheduled For Tuesday

Economic Data Scheduled For Tuesday pic.twitter.com/RJDq9ZqGNs

— Benzinga (@Benzinga) May 15, 2018

#5things people in markets are talking about today:
-China policy
-Erdogan wants monetary control
-Retail sales
-Markets mixed
-European growth
https://bloom.bg/2rLbU4H

#5things people in markets are talking about today:
-China policy
-Erdogan wants monetary control
-Retail sales
-Markets mixed
-European growthhttps://t.co/fUUQWVknFI https://t.co/q0ylxeePqw

— Melonopoly (@curtmelonopoly) May 15, 2018

To prevent oil spiking to $100 over Iran, Saudi Arabia and Russia might have to step in

https://twitter.com/EPICtheAlgo/status/996369476022099969

If you are new to our trading service you should review recent blog posts, the Compound Trading YouTube Channel and at minimum our algorithm Twitter feeds because they do tell a story in terms of the market and how the inflections of the market determine our day to day trading. You will notice the algorithmic modelling has been undeniably accurate with many time-frames (intra-day, weeks and months out) so I myself have learned to respect their math (they have taken me from a 60% hit rate to 80%+ in my trading – all publicly posted live trades).

Momentum Stocks (Market Open and Intra-Day):

I do trade morning momo stocks, but I do avoid much of the day trading risk (preferring to daytrade only what is structurally set-up also on the swing trade side and to my advantage in the algorithmic model charting). I often avoid the first 30 minutes (gap and go) and trade momentum stocks or structured (per explanation in previous sentence) stocks later in day after a wash-out looking for a snap-back trade that can possibly also become a strong swing or longer term trade that I can leg in to. Just prior to open and shortly after open I post momentum stocks to the trade chat room (and Twitter and Stocktwits if I have time).

Some of my Favorite Intra-day Trading Set-Ups:

(1) Momentum Stock Wash-Outs for Snap Back, (2) Bad News Wash-outs on Stocks with High Institutional Ownership, (3) Getting on the Right Side of a Trend Change and scaling in my position and (4) Our Algorithm Charting Model Set-Ups.

The momentum stocks (from previous days and morning trade) I continue to watch through the day for indicators that allow a trade.

Morning Stock Watch-Lists for my Favorite Set-Ups:

(1) Pre-Market Gainers Watch-List: $CLWT $SORL $XENE $RCON 

(2) Pre-market Decliners Watch-List : $VIPS $KOOL $EOLS $SBGL $SPY $QQQ $IWM

(3) Other Watch-List:

(4) Regular Algo Charting Watch-List: Gold $GC_F $GLD, Miners $GDX ($NUGT, $DUST, $JDST, $JNUG), Silver $SLV $SI_F ($USLV, $DSLV), Crude Oil FX: $USOIL $WTI ($UWT, $DWT, $USO, $UCO, $CL_F, $UWT, $DWT), Natural Gas $NG_F ($UGAZ, $DGAZ), S & P 500 $SPY $ES_F ($SPXL, $SPXS), US Dollar Index $DXY ($UUP), Volatility $VIX ($TVIX, $UVXY), $BTCUSD Bitcoin.

(5) Recent Upgrades:

(6) Recent Downgrades: 

$TSLA Morgan Stanley cuts Tesla TSLA PT to $291 from $376, 2020 EPS to -0.12 USD from +2.76 USD

Stay tuned in Stock Chat Room for more pre-market stocks on watch.

In Closing:

A few hours of trade coaching or study on exactly how to trim in to resistance and how to add to your positions on winners and how to cut losses properly and quickly will return huge dividends.

You can subscribe to our Weekly Swing Trading Newsletter service here, use temporary Promo Code “30P” for 30% off Reg 119.00 Sale Price 83.30.

Or click here to subscribe and get 30% off Real-Time Swing Trading Alerts Reg 99.00 Sale Price 69.37 use temporary Promo Code “Deal30” for 30% off.

I personally guarantee our swing trading service is one of the best in the business and it’s very reasonably priced considering the technical expertise invested in the platform.

Study:

For new readers, a review of our unlocked posts on our blog would help you get in to the story we are following with the securities listed in this newsletter.

Free scanners to find momentum stocks that you can easily review charts of for indicators that bring probability of your trade being successful up considerably. These are not useful for first 30 minute market open gap and go type plays (you need a good momentum scanner, level 2, and best to have hot-keys for the first 30 mins of gap and go trading)… but are very useful for intra day scalping and swing trading (start with trending stocks and then look at indicators intra for simple set-ups – study scan study scan study scan).

http://finviz.com/

https://finance.yahoo.com/screener/predefined/ec5bebb9-b7b2-4474-9e5c-3e258b61cbe6

http://www.highshortinterest.com/

http://www.gurufocus.com/short-stocks.php

http://www.3xetf.com/all/

http://www.etf.com/channels/gold-etfs

GL!

Curtis

Algorithm Twitter feeds can be found here: $BTC (@CryptotheAlgo) $WTI (@EPICtheAlgo), $VIX (@VexatiousVIX), $SPY (@FREEDOMtheAlgo), $GLD (@ROSIEtheAlgo), $SLV (@SuperNovaAlgo), $DXY (@DXYUSD_Index). Our Swing Trading Twitter feed is found here: https://twitter.com/swingtrading_ct.  Our lead trader Twitter feed is here @curtmelonopoly

Article Topics: Premarket, Watchlist, Stocks, Trading, Plan, $CLWT, $SORL, $XENE, $RCON, $DIS, $ITCI, $HTZ, $BOX, $EDIT

Read More
Trade Set-Ups (May 14 /15 Member Edition) $BOX, $ITCI, $SPY, $EEM, $PFE, $BTC, Bitcoin, SILVER, $SLV, $ETH, Ethereum, $EOG, $EDIT, $EXP more.

Trade Set-Ups (May 14 /15 Member Edition) $BOX, $ITCI, $SPY, $EEM, $PFE, $BTC, Bitcoin, SILVER, $SLV, $ETH, Ethereum, $EOG, $EDIT, $EXP more.

May 15, 2018June 9, 2018 Swing TraderSwing Trading$BTC, $EDIT, $EEM, $EOG, $ETH, $EX, $ITCI, $PFE, BITCOIN, BOX, Chart, Ethereum, Report, Setups., Silver, SLV, SPY, Swingtrading, Video

Swing Trading Report and Video for May 14 / 15, 2018.

In this Issue: $BOX, $ITCI, $SPY, $EEM, $PFE, $BTC, Bitcoin, SILVER, $SLV, $ETH, Ethereum, $EOG, $EDIT, $EXP more.

What’s New!

  • Interested in free swing trading setups? Click here to sign up for the Complimentary Swing Trading Report Mailing List.
  • Now available for serious traders – Legacy All Access Membership.
  • Price increase platform wide May 15, 2018. Detailed announcement to follow. Current members unaffected.
  • 24 Hour Crypto Trading Desk opens May 15, 2018 along with our Coding Algorithm Models for Machine Trading. Formal announcements to follow.

The Mid Day Trade Set-Ups Video:

Trade set-ups on this video; $BOX, $ITCI, $SPY, $EEM, $PFE, $BTC, Bitcoin, SILVER, $SLV, $ETH, Ethereum, $EOG, $EDIT, $EXP more.

Mid Day Chart Trading Set-ups May 14 Summary:

Trade set-ups May 14 Mid Day Trade Review;

$ITCI – called it on way down for a turn, it’s turned and it’s been a great trade, cleared 50 MA, swing trade and intra day resistance points. Swing 23.78 above is important resistance. 21.22 22.30 intra. 30.63 is a swing resistance to watch.

$SPY – through price target, in to resistance today, up and over adding. May 18 273.40 target moderate, 283.00 bullish target. 274.50 next resistance. 272.10 support intra.

Bitcoin $BTC – up against resistance (mid quad) very important area. 8870.00 area. Upside target 9880.0 and moderate 8871.00 bearish 7894.00 May 19 approx.

Silver $SLV – buy side alert issued 16.67 area, I’m off a bit but it’s a small starter.

$GOOGL – great trade with it bullish through targets ,trading very technical. 1127.81 resistance 1148.04 1158.09 1166.00 area. Support 1078.58 1103.20.

$EOG – at resistance, trim 119.61 next 128.15 and support 108.91.

$EDIT – 36.45 pivot triggered long over and then came off. Over 50 MA is bullish. Mid quad 37.70 mid qaud resistance. 47.49 is bullish target late Sept.

$HTZ – over 50 MA on hourly we sent alert to trim longs in to the 50 MA, wash-out snap back trade,

$GDX is playing out according to model.

$EEM up against 50 MA on daily, 100 MA above bothers me, MACD is turned up. Soft. Price above all MA’s with 50 breaching the 100 MA and I’d be interested in a play. Moving averages are the issue. MACD looks good.

$PFE 20 MA above on weekly chart not great, stochastic RSI coming down on monthly, MACD not the best, against historical resistance. Very soft.

$EXP 107.90 buy trigger waiting on earnings before execution.

$BOX hit mid quad resistance and came off, excellent symmetry in model, there is a set up post on blog for mailing list subscribers. 20.39 resistance 33.20 bullish target 23.74 bearish target – trade price toward target.

Ethereum $ETH $ETHUSD – up over MA’s, 739.11 resistance 739.55, and main resistance at 825.43 and 906.97 top of channel. Algorithmic model chart resistance at channel.

$BTC Bitcoin under mid channel line. 17690.00 July 4 price target is the most bullish scenario (unlikely of course, but in a bull run that would be the most bullish target for Bitcoin). Trading the channel.

In Closing:

I will re-iterate that a few hours of trade coaching or study on exactly how to trim in to resistance and how to add to your positions on winners and how to cut losses properly and quickly will return huge dividends.

You can subscribe to our Weekly Swing Trading Newsletter service here, use temporary Promo Code “30P” for 30% off Reg 119.00 Sale Price 83.30.

Or click here to subscribe and get 30% off Real-Time Swing Trading Alerts Reg 99.00 Sale Price 69.37 use temporary Promo Code “Deal30” for 30% off.

I personally guarantee our swing trading service is one of the best in the business and it’s very reasonably priced considering the technical expertise invested in the platform.

Any questions feel welcome to contact me anytime.

Peace and best,

Curt

Recent Trading Set-Up Review Webinars / Posts:

Password: WOW Protected: How to Trade Box Earnings Move (Swing Trade Member Exclusive)

Protected: Trade Set-Ups (May 8 Member Edition) $AAPL, $DIS, $AMD, $ITCI, $AAOI, $SNAP, $FB, $TSLA, $EDIT, $ESPR, $LITE, $LPSN, $SPY.

May 7 – Trade Set-Ups, Consolidated Review $SPY, $AAPL, $TSLA, $SNAP, OIL, $DXY, $VIX, GOLD, $DIS, Silver more.

Trading Set-ups $FB, $AMBA, $SDTY, $TSLA, $GDX, $SLV, $BTC, $JD, $VIX, $LITE, $CELG, $FSLR more.

Do Not Ignore This Trade Set-Up | $AMBA Swing Trade | 40% ROE 3 Mos (Part 1 of 2)

Password: ELON Protected: How to Trade the Tesla Move | Price Targets | Buy Sell Triggers | Time Cycles $TSLA #swingtrading #daytrading

Password: LONG Protected: Overnight Oil Trade | Trading Plan in Detail | EPIC Oil Algorithm $USOIL $WTI $CL_F #OIL $USO #Alerts

Trade Set-ups $SPY, $NFLX, OIL, $WTI, $ESPR, $GOOGL, Bitcoin, $BTC, $FEYE, $AAPL and more.

Trading Set-Ups $SPY, Gold, $GC_F, $GDX, Bitcoin, $GOOGL, $EVLV, $HEAR, $CHEK, $MARA, $PRTA, $ZDGE

Trading Set-Ups $NETE, $TSG, $ETH Ethereum, $BTC Bitcoin, $TAN, $HEAR, $AMMJ, $SNAP, $VLRX

Trade Set-Ups OIL, $WTI, $SPY, $GOOGL, $FSLR, $AXP, $GREK, $CELG, $AAOI, $SDRL, $WFT

Great Trading Last Few Wks – Lets Keep Going! $RIG, #OIL, $SPY, $ETH, $BTC, $FB, $GOOGL, $BWA, $GDX more.

Swing Trade Set-Ups Abound $SPY, $NFLX, $DIS, $EOG, $WTIC, $USOIL, $BTC, $FB, $MARA, $LITE, $IOTS and more.

Special Swing Trade Report: #OIL, #GOLD, $NFLX, $SPY, $DIS, $GDX, $TSLA, $AAOI, $ESPR, $ITCI, $TAN, $CELG, $C and more.

Register to free email list for trade set-ups, webinars, special events: https://compoundtrading.com/contact/

Website: https://compoundtrading.com

Free chat room: https://discord.gg/2HRTk6n

Subscribe: https://compoundtrading.com/overview-…

Twitter: https://twitter.com/CompoundTrading

Lead Trader: https://twitter.com/curtmelonopoly

Tradingview: https://www.tradingview.com/u/curtmel…

Facebook: https://www.facebook.com/compoundtrad…

StockTwits: https://stocktwits.com/compoundtrading

Email: https://info@compoundtrading.com

Compound Trading Platform: Algorithm model charting for $SPY, $VIX, #OIL, #GOLD, #SILVER, #Crypto ($BTC Bitcoin, $ETH, $LTC, $XRP,) $DXY US Dollar and Swing Trading Newsletter. Live trading rooms for daytrading and oil traders. Private coaching and live alerts.

Read More
PreMarket Trading Plan Mon May 14: $MYO, $PRPO, $ACIA, $KTOV, $BOX, $CALA, $SPY, GOLD, SILVER, OIL, $VIX, $DXY more.

PreMarket Trading Plan Mon May 14: $MYO, $PRPO, $ACIA, $KTOV, $BOX, $CALA, $SPY, GOLD, SILVER, OIL, $VIX, $DXY more.

May 14, 2018June 9, 2018 Curt MelonopolyTrading Plan$ACIA, $CALA, $KTOV, $MYO, $PRPO, BOX, DXY, Gold, Oil, Plan, Premarket, Silver, SPY, Stocks, Trading, VIX, Watchlist

Compound Trading Trading Plan and Watch List Monday May 14, 2018. 

In this issue: $MYO $PRPO $ACIA $KTOV, $BOX, $CALA, $SPY, GOLD, SILVER, OIL, $VIX, $DXY and more.

Welcome to the morning Wall Street trading day session at Compound Trading!

Notices:

Quick Update: Reporting, Live Rooms, New Team Members, Pricing, Discounts, Trade Coaching, New Book https://compoundtrading.com/quick-update-reporting-live-rooms-new-team-members-pricing-discounts-trade-coaching-new-book/

What’s New at Compound Trading April / May 2018. https://compoundtrading.com/whats-new-at-compound-trading-april-may-2018/

Price Increase: Platform wide price increase May 15, 2018. Does not affect existing members. Official announcement to follow.

Machine Trading: May 15, 2018 the new teams start. Mandate: (1) Intelligent Assisted #IA Trading Platform (Code Algorithm Models), (2) Run 24 Hour Crypto Trading Desk, (3) Alert Trade Set-ups to Member Alert Feeds (for all models) and near future (4) Machine Learning. Official announcement to follow.

Notes in red text below are new comments entered specifically today (or recently important).

Live Trading Room Link:

http://compoundtrading1.clickmeeting.com/livetrading

Real-time Alerts for Oil, Gold, Swing Trading, Day Trading, Bitcoin are available by following specific alert Twitter feeds.

Disclaimer / disclosure: Every subscriber must read this disclaimer.

Reporting and Next Gen Algorithms:

BE SURE to get in to each private Discord server specific to your subscription as many of the updates as we go forward will be posted in there. This includes the SWING TRADING platform also.

IF YOU NEED A LINK / INVITE email or DM us!

Connect with us on Discord.

https://twitter.com/CompoundTrading/status/880670140454637569

Recent Blog / Video / Social Posts: 

#BitcoinTrading 101: A Beginner’s Guide to Getting Started $BTCUSD $XBTUSD $BTC https://compoundtrading.com/bitcointrading-101-beginners-guide-getting-started-btcusd-xbtusd-btc/ …

https://twitter.com/CompoundTrading/status/927397024315662336

How to Use EPIC Oil Algorithm: $USOIL, $WTI, $CL_F, $USO, $UCO, $SCO, $UWT, $DWT, #OIL, #OOTT: http://youtu.be/hawVV31G9bg?a via @YouTube

https://twitter.com/CompoundTrading/status/889148655785177088

How to Use ROSIE Gold Algorithm: #GOLD, $GLD, $XAUUSD, $GDX, $GDXJ, $NUGT, $DUST, $JNUG, $JDST

https://twitter.com/CompoundTrading/status/889147527278333952

Recent Chart / Trade Set-Ups: 

See You Tube for other recent video posts. 

Password: WOW Protected: How to Trade Box Earnings Move (Swing Trade Member Exclusive)

Protected: Trade Set-Ups (May 8 Member Edition) $AAPL, $DIS, $AMD, $ITCI, $AAOI, $SNAP, $FB, $TSLA, $EDIT, $ESPR, $LITE, $LPSN, $SPY.

May 7 – Trade Set-Ups, Consolidated Review $SPY, $AAPL, $TSLA, $SNAP, OIL, $DXY, $VIX, GOLD, $DIS, Silver more.

Trading Set-ups $FB, $AMBA, $SDTY, $TSLA, $GDX, $SLV, $BTC, $JD, $VIX, $LITE, $CELG, $FSLR more.

Do Not Ignore This Trade Set-Up | $AMBA Swing Trade | 40% ROE 3 Mos (Part 1 of 2)

Password: ELON Protected: How to Trade the Tesla Move | Price Targets | Buy Sell Triggers | Time Cycles $TSLA #swingtrading #daytrading

Password: LONG Protected: Overnight Oil Trade | Trading Plan in Detail | EPIC Oil Algorithm $USOIL $WTI $CL_F #OIL $USO #Alerts

Trade Set-ups $SPY, $NFLX, OIL, $WTI, $ESPR, $GOOGL, Bitcoin, $BTC, $FEYE, $AAPL and more.

Trading Set-Ups $SPY, Gold, $GC_F, $GDX, Bitcoin, $GOOGL, $EVLV, $HEAR, $CHEK, $MARA, $PRTA, $ZDGE

Trading Set-Ups $NETE, $TSG, $ETH Ethereum, $BTC Bitcoin, $TAN, $HEAR, $AMMJ, $SNAP, $VLRX

Trade Set-Ups OIL, $WTI, $SPY, $GOOGL, $FSLR, $AXP, $GREK, $CELG, $AAOI, $SDRL, $WFT

Great Trading Last Few Wks – Lets Keep Going! $RIG, #OIL, $SPY, $ETH, $BTC, $FB, $GOOGL, $BWA, $GDX more.

Recent Educational Articles / Videos:

I get a lot of Q’s on How to Trade our models, this vid has 5 min explanation at 1:00 min-6:00 min. https://www.youtube.com/watch?v=QrXbE7lojAg&t=3s … – Fib Trendlines, Trading structure/quads, Price targets, Main support resistance (buy sell triggers), Time cycles, Moving averages, Trading trims/adds.

I get a lot of Q's on How to Trade our models, this vid has 5 min explanation at 1:00 min-6:00 min. https://t.co/oqezvVcn0y … – Fib Trendlines, Trading structure/quads, Price targets, Main support resistance (buy sell triggers), Time cycles, Moving averages, Trading trims/adds.

— Melonopoly (@curtmelonopoly) May 13, 2018

Trading Plan (Buy, Hold, Sell) Watch Lists. Morning Momentum / Gap / News / PR / IPO / SEC Filings / Earnings Stocks on Watch: 

Stocks making the biggest moves premarket: XRX, F, WMT, JPM, HSBC, GOOGL & more

Stocks making the biggest moves premarket: XRX, F, WMT, JPM, HSBC, GOOGL & more https://t.co/QdxbYmyaaw

— Melonopoly (@curtmelonopoly) May 14, 2018

Premarket analyst action – healthcare https://seekingalpha.com/news/3356187-premarket-analyst-action-healthcare?source=feed_f … #premarket $BGNE $SURF $TNDM

Premarket analyst action – healthcare https://t.co/fc9mNqWRJ2 #premarket $BGNE $SURF $TNDM

— Seeking Alpha Market News (@MarketCurrents) May 14, 2018

26 Stocks Moving In Monday’s Pre-Market Session https://benzinga.com/z/11703065 $ACIA $OCLR $LITE $FNSR $KTOV $NXPI $QCOM $REGI $NHTC $ECYT $XRX

26 Stocks Moving In Monday's Pre-Market Session https://t.co/6XSI4dgemv $ACIA $OCLR $LITE $FNSR $KTOV $NXPI $QCOM $REGI $NHTC $ECYT $XRX

— Benzinga (@Benzinga) May 14, 2018

7 Stocks To Watch For May 14, 2018 https://benzinga.com/z/11701862 $A $HQCL $ITRI $NI $VIPS $YUMA $RXN

7 Stocks To Watch For May 14, 2018 https://t.co/u70P8n60c1 $A $HQCL $ITRI $NI $VIPS $YUMA $RXN

— Benzinga (@Benzinga) May 14, 2018

Market Observation:

As of 8:00 AM: US Dollar $DXY trading 92.55, Oil FX $USOIL ($WTI) trading 70.80, Gold $GLD trading 1318.41, Silver $SLV trading 16.63, $SPY 273.30, Bitcoin $BTC.X $BTCUSD $XBTUSD 8418.00 and $VIX trading 13.1.

Momentum Stocks to Watch: $MYO $PRPO $ACIA $KTOV

News: 

$MYO Myomo® Application for Medicare Codes Receives Favorable Preliminary Decision

https://finance.yahoo.com/news/myomo-application-medicare-codes-receives-120000268.html?.tsrc=rss

$MYO Myomo® Application for Medicare Codes Receives Favorable Preliminary Decision https://t.co/ERTe4JGVan

— Melonopoly (@curtmelonopoly) May 14, 2018

OPEC says global oil glut nearly gone as output ticks up slightly https://seekingalpha.com/news/3356195-opec-says-global-oil-glut-nearly-gone-output-ticks-slightly?source=feed_f … #premarket $USO $OIL $UWT $UCO

Your questions about the crypto regulatory fight in the U.S.—answered https://bloom.bg/2L0jJfV

Your questions about the crypto regulatory fight in the U.S.—answered https://t.co/WK7belEi6p pic.twitter.com/svNtzrmcEO

— Bloomberg Crypto (@crypto) May 14, 2018

$COCP Completed successful uplisting to Nasdq Capital Market March 12,th 2018

$ELOX uplisted

Boston Scientific announces real-world data demonstrating success of SMART pass on the S-ICD system https://seekingalpha.com/news/3356173-boston-scientific-announces-real-world-data-demonstrating-success-smart-pass-s-icd-system?source=feed_f … #premarket $BSX

Recent SEC Filings: 

Recent IPO’s:

Earnings: 

#earnings for the week

$WMT $HD $AMAT $CSCO $M $JCP $DE $TTWO $BZUN $MZOR $NTES $KEM $A $VIPS $CSIQ $LONE $HQCL $MARK $SORL $JWN $DGLY $EXP $SWCH $AZN $CPB $NM $GDP $BCLI $MGIC $TGEN $KMDA $JACK $ATNX $HTHT $MANU $NINE $MTBC $VRTU $RXN $AMRS $FLO

http://eps.sh/cal

#earnings for the week $WMT $HD $AMAT $CSCO $M $JCP $DE $TTWO $BZUN $MZOR $NTES $KEM $A $VIPS $CSIQ $LONE $HQCL $MARK $SORL $JWN $DGLY $EXP $SWCH $AZN $CPB $NM $GDP $BCLI $MGIC $TGEN $KMDA $JACK $ATNX $HTHT $MANU $NINE $MTBC $VRTU $RXN $AMRS $FLO https://t.co/r57QUKKDXL https://t.co/EFUpuZmWFi

— Melonopoly (@curtmelonopoly) May 14, 2018

Trade Set-up Alerts, Charts & Reports. Recent / Current Holds, Open and Closed Trades:

$BOX Weekly Algorithmic Model Chart #earnings #trading

BOX, earnings, trade, set-up, howto
$BOX Weekly Algorithmic Model Chart #earnings #trading

Gold. Monthly. $XAUUSD $GC_F $GLD $NUGT $DUST $JDST $JNUG #Gold

Gold. Monthly. $XAUUSD $GC_F $GLD $NUGT $DUST $JDST $JNUG #Gold

Simple symmetrical time cycle on weekly, Volatility reversal leading in to July 23 ish probable. $VIX $UVXY $TVIX

Simple symmetrical time cycle on weekly, Volatility reversal leading in to July 23 ish probable. $VIX $UVXY $TVIX

$VIX under moving averages on Daily Chart and under lower bollinger. Long bias RR setting in.

$VIX under moving averages on Daily Chart and under lower bollinger. Long bias RR setting in.

Doesn’t really matter how you draw the lines – there’s a decision coming on Silver Weekly Chart. #Silver $SLV $USLV $DSLV

Doesn’t really matter how you draw the lines – there’s a decision coming on Silver Weekly Chart. #Silver $SLV $USLV $DSLV

Massive time cycle comes due late July on Gold Daily. Structure in place still. May 14 218 AM #Gold $GLD $GC_F $XAUUSD $NUGT $DUST

Massive time cycle comes due late July on Gold Daily. Structure in place still. May 14 218 AM #Gold $GLD $GC_F $XAUUSD $NUGT $DUST

With earnings on deck this week watch this one close. 118.00 upside 93.00 downside. Good range. $EXP

With earnings on deck this week watch this one close. 118.00 upside 93.00 downside. Good range. $EXP

$CALA targeting 3.00 range July 6. Trending down quad wall near perfect. Watch for bounce. #swingtrading

$CALA targeting 3.00 range July 6. Trending down quad wall near perfect. Watch for bounce. #swingtrading

Bull bear fight is on with dollar closing the week at the 50 MA. Watch that close. $DXY $UUP

Bull bear fight is on with dollar closing the week at the 50 MA. Watch that close. $DXY $UUP

$SPY Daily Chart, ending week bullish with a break above upper TL and 20 MA near breach 50 MA. $ES_F $SPXL $SPXS

$SPY Daily Chart, ending week bullish with a break above upper TL and 20 MA near breach 50 MA. $ES_F $SPXL $SPXS

Oil Monthly. Right at pivot, between 100 MA Resistance 200 MA Support. MACD SQZMOM trending up Stoch high. $USOIL $WTI $USO #OIL

Oil Monthly. Right at pivot, between 100 MA Resistance 200 MA Support. MACD SQZMOM trending up Stoch high. $USOIL $WTI $USO #OIL

Market Outlook, Market News and Social Bits From Around the Internet:

Economic Data Scheduled For Monday

Economic Data Scheduled For Monday pic.twitter.com/2N84n9mCGd

— Benzinga (@Benzinga) May 14, 2018

#5things
-U.S.-China tensions ease
-Italy’s ambitious populists
-OPEC says has Iran buffer
-Markets mixed
-Jerusalem embassy
https://bloom.bg/2IcNAUh

#5things
-U.S.-China tensions ease
-Italy's ambitious populists
-OPEC says has Iran buffer
-Markets mixed
-Jerusalem embassyhttps://t.co/4axxsJ8Fmm pic.twitter.com/D3glqrO299

— Bloomberg Markets (@markets) May 14, 2018

If you are new to our trading service you should review recent blog posts, the Compound Trading YouTube Channel and at minimum our algorithm Twitter feeds because they do tell a story in terms of the market and how the inflections of the market determine our day to day trading. You will notice the algorithmic modelling has been undeniably accurate with many time-frames (intra-day, weeks and months out) so I myself have learned to respect their math (they have taken me from a 60% hit rate to 80%+ in my trading – all publicly posted live trades).

Momentum Stocks (Market Open and Intra-Day):

I do trade morning momo stocks, but I do avoid much of the day trading risk (preferring to daytrade only what is structurally set-up also on the swing trade side and to my advantage in the algorithmic model charting). I often avoid the first 30 minutes (gap and go) and trade momentum stocks or structured (per explanation in previous sentence) stocks later in day after a wash-out looking for a snap-back trade that can possibly also become a strong swing or longer term trade that I can leg in to. Just prior to open and shortly after open I post momentum stocks to the trade chat room (and Twitter and Stocktwits if I have time).

Some of my Favorite Intra-day Trading Set-Ups:

(1) Momentum Stock Wash-Outs for Snap Back, (2) Bad News Wash-outs on Stocks with High Institutional Ownership, (3) Getting on the Right Side of a Trend Change and scaling in my position and (4) Our Algorithm Charting Model Set-Ups.

The momentum stocks (from previous days and morning trade) I continue to watch through the day for indicators that allow a trade.

Morning Stock Watch-Lists for my Favorite Set-Ups:

(1) Pre-Market Gainers Watch-List: $MYO $PRPO $ACIA $KTOV $NXPI $CNET $PXLW $HMNY $OCLR $VLRX $HTBX $NPTN $TNDM $SYMC $LITE $RGSE $FNSR $AMDA $TRXC $EMIS $HUYA $MRVL $BLNK $QCOM

(2) Pre-market Decliners Watch-List :

(3) Other Watch-List:

(4) Regular Algo Charting Watch-List: Gold $GC_F $GLD, Miners $GDX ($NUGT, $DUST, $JDST, $JNUG), Silver $SLV $SI_F ($USLV, $DSLV), Crude Oil FX: $USOIL $WTI ($UWT, $DWT, $USO, $UCO, $CL_F, $UWT, $DWT), Natural Gas $NG_F ($UGAZ, $DGAZ), S & P 500 $SPY $ES_F ($SPXL, $SPXS), US Dollar Index $DXY ($UUP), Volatility $VIX ($TVIX, $UVXY), $BTCUSD Bitcoin.

(5) Recent Upgrades: $TLRD $WAB $DK $TRI $AMS $LB $LEA $FNHC $FBN $TNDM $TLRD $LGCY $UPS $MTH $MGA $OC $FMC $CSX $AG $TTD $CVX $AMAT $CMG

JPMorgan Remains Positive on Ormat Technologies $ORA, Issues Cautious Alert Regarding Lava Flow in …

(6) Recent Downgrades: $ANDV $XRX $OC $AOSL $UIHC $TWNK $DF $HTH $CHSP $FBHS $MAS $UNIT $DCT $JELD $BECN $CUB $IFF $EMES $IFF $CASY $CAT

Stay tuned in Stock Chat Room for more pre-market stocks on watch.

In Closing:

A few hours of trade coaching or study on exactly how to trim in to resistance and how to add to your positions on winners and how to cut losses properly and quickly will return huge dividends.

You can subscribe to our Weekly Swing Trading Newsletter service here, use temporary Promo Code “30P” for 30% off Reg 119.00 Sale Price 83.30.

Or click here to subscribe and get 30% off Real-Time Swing Trading Alerts Reg 99.00 Sale Price 69.37 use temporary Promo Code “Deal30” for 30% off.

I personally guarantee our swing trading service is one of the best in the business and it’s very reasonably priced considering the technical expertise invested in the platform.

Study:

For new readers, a review of our unlocked posts on our blog would help you get in to the story we are following with the securities listed in this newsletter.

Free scanners to find momentum stocks that you can easily review charts of for indicators that bring probability of your trade being successful up considerably. These are not useful for first 30 minute market open gap and go type plays (you need a good momentum scanner, level 2, and best to have hot-keys for the first 30 mins of gap and go trading)… but are very useful for intra day scalping and swing trading (start with trending stocks and then look at indicators intra for simple set-ups – study scan study scan study scan).

http://finviz.com/

https://finance.yahoo.com/screener/predefined/ec5bebb9-b7b2-4474-9e5c-3e258b61cbe6

http://www.highshortinterest.com/

http://www.gurufocus.com/short-stocks.php

http://www.3xetf.com/all/

http://www.etf.com/channels/gold-etfs

GL!

Curtis

Algorithm Twitter feeds can be found here: $BTC (@CryptotheAlgo) $WTI (@EPICtheAlgo), $VIX (@VexatiousVIX), $SPY (@FREEDOMtheAlgo), $GLD (@ROSIEtheAlgo), $SLV (@SuperNovaAlgo), $DXY (@DXYUSD_Index). Our Swing Trading Twitter feed is found here: https://twitter.com/swingtrading_ct.  Our lead trader Twitter feed is here @curtmelonopoly and lead tech developer @hundalSHS.

Article Topics: Premarket, Watchlist, Stocks, Trading, Plan, $MYO $PRPO $ACIA $KTOV, $BOX, $CALA, $SPY, GOLD, SILVER, OIL, $VIX, $DXY

Read More
Volatility $VIX Chart Models Mon May 14 $TVIX, $UVXY, $VXX

Volatility $VIX Chart Models Mon May 14 $TVIX, $UVXY, $VXX

May 14, 2018December 30, 2018 Vexatious VixVexatious $VIX$VXX, Algo, Algorithms, Stocks, Trading, TVIX, UVXY, Vexatious, VIX, Volatility

Volatility $VIX Charting / Algorithm Observations Report Monday May 14, 2018 $TVIX, $UVXY, $VXX 

Good day! My name is Vexatious $VIX the Algo. Welcome to my new $VIX algorithmic modeling charting trade report for Compound Trading.

Volatility Charting Observations:

$VIX 60 min quads with buy sell triggers. . $TVIX $UVXY May 14 427 AM

https://www.tradingview.com/chart/VIX/hllxz98u-VIX-60-min-quads-with-buy-sell-triggers-TVIX-UVXY-May-14-4/

$VIX, 60 min, daytrading, algorithm
$VIX 60 min quads with buy sell triggers. . $TVIX $UVXY May 14 427 AM

Per recent’

$VIX 60 min quads with buy sell triggers. . $TVIX $UVXY Apr 30 332 AM

https://www.tradingview.com/chart/VIX/G270DtON-VIX-60-min-quads-with-buy-sell-triggers-TVIX-UVXY-Apr-30-3/

$VIX, 60 Min, Chart
$VIX 60 min quads with buy sell triggers. . $TVIX $UVXY Apr 30 332 AM

Per recent;

$VIX 60 min quads with buy sell triggers. VIX struggling with 16.9 main resistance. $TVIX $UVXY Apr 24 233 AM

https://www.tradingview.com/chart/VIX/2BoMsi4K-VIX-60-min-quads-with-buy-sell-triggers-VIX-struggling-with-16/

$VIX, main, resistance, chart
$VIX 60 min quads with buy sell triggers. VIX struggling with 16.9 main resistance. $TVIX $UVXY Apr 24 233 AM

Buy sell swing trading triggers for $VIX:

23.2

22.4

21.6

20.8

20.1

19.3

18.5

17.7

16.9

16.1

15.3

14.5

13.7

12.9

12.1

11.4

10.6

9.8

9.0

$VIX Volatility Index Conventional Charting

$VIX under moving averages on Daily Chart and under lower bollinger. Long bias RR setting in.

https://www.tradingview.com/chart/VIX/jyABVDwV-VIX-under-moving-averages-on-Daily-Chart-and-under-lower-bollin/

$VIX, daily chart, bollinger bands
$VIX under moving averages on Daily Chart and under lower bollinger. Long bias RR setting in.

$VIX trading above 200 MA on trend with MACD completely flat and absent.

https://www.tradingview.com/chart/VIX/tlB2XbXE-VIX-trading-above-200-MA-on-trend-with-MACD-completely-flat-and/

$VIX, daily, chart, 200 MA, MACD
https://www.tradingview.com/chart/VIX/tlB2XbXE-VIX-trading-above-200-MA-on-trend-with-MACD-completely-flat-and/

Per recent;

$VIX Daily MACD still trending down, getting close to bottom. Riding 100 MA. Price near bottom bollinger.

https://www.tradingview.com/chart/VIX/XMSXtSdU-VIX-Daily-MACD-still-trending-down-getting-close-to-bottom-Ri/

$VIX, bollinger bands, 100 MA, MACD
$VIX Daily MACD still trending down, getting close to bottom. Riding 100 MA. Price near bottom bollinger.

$VIX Weekly Chart

Simple symmetrical time cycle on weekly chart, Volatility reversal leading in to July 23 ish is probable. $VIX $UVXY $TVIX #volatility #trading

Volatility, weekly, chart
Simple symmetrical time cycle on weekly chart, Volatility reversal leading in to July 23 ish is probable. $VIX $UVXY $TVIX #volatility #trading

Per recent;

$VIX weekly chart has MACD trending down and structure broke.

https://www.tradingview.com/chart/VIX/q5FIivkK-VIX-weekly-chart-has-MACD-trending-down-and-structure-broke/

$VIX, weekly, chart, MACD
https://www.tradingview.com/chart/VIX/q5FIivkK-VIX-weekly-chart-has-MACD-trending-down-and-structure-broke/

Per recent;

$VIX structure on the last bullish move is now all but gone. Likely continued decline.

https://www.tradingview.com/chart/VIX/ZDViNVKz-VIX-structure-on-the-last-bullish-move-is-now-all-but-gone-Lik/

$VIX, bearish, chart
$VIX structure on the last bullish move is now all but gone. Likely continued decline.

Per recent;

$VIX losing structure for bull move. MACD about to cross down.

https://www.tradingview.com/chart/VIX/YqCfwhCQ-VIX-losing-structure-for-bull-move-MACD-about-to-cross-down/

$VIX, MACD, chart
$VIX losing structure for bull move. MACD about to cross down.

Per previous;

$VIX Weekly chart structure in place yet but MACD nearing top. #volatility #chart

https://www.tradingview.com/chart/VIX/y6cuTBwI-VIX-Weekly-chart-structure-in-place-yet-but-MACD-nearing-top/

$VIX, Weekly, chart
$VIX Weekly chart structure in place yet but MACD nearing top. #volatility #chart

Per recent;

$VIX Weekly chart model provides bullish outlook also.

https://www.tradingview.com/chart/VIX/CbShhY1p-VIX-Weekly-chart-model-provides-bullish-outlook-also/

$VIX, weekly, chart, bullish
$VIX Weekly chart model provides bullish outlook also.

Good luck with your trades and look forward to seeing you in the room!

Vexatious the $VIX Algo

Tweets by VexatiousVIX

Article Topics: Vexatious, $VIX, Algo, Volatility, Stocks, Trading, Algorithms, $TVIX, $UVXY, $VXX

Read More
SuperNova $SILVER Algo Chart Model Update Mon May 14 $SLV ($USLV, $DSLV)

SuperNova $SILVER Algo Chart Model Update Mon May 14 $SLV ($USLV, $DSLV)

May 14, 2018December 30, 2018 Supernova SilverSuperNova Silver Algo$DSLV, $USLV, Algorithm, Chart, Silver, SLV, SuperNova

Silver Trading Chart Update Monday May 14, 2018 $SLV ($USLV, $DSLV) Chart and Algorithm Observations

My name is SuperNova the Silver Algo. Welcome to my new Silver trade report. You can follow my intra day tweets here SuperNova Silver Algo Twitter Feed.

How My Algorithm Works and Availability:

I am an algorithm chart model in development.

Below you will find my simplified view of levels that can be used on a traditional chart to possibly advance a traders’ edge (both intra-day and as a swing trader). This work, and your subsequent trading, should be considered one decision at a time, “if this happens then this or this are my targets”… price – trigger – trade and so on (rooted in technical set-up).

My algorithmic charting will eventually transition to developer coding phase for our trader’s dashboard program. I am not an automated bot or high frequency type algorithm (HFT). Please review my algorithm development process.

Below you will find simple Generation I Level chart modeling with a goal toward generation 5 modeling as with EPIC the Oil Algorithm model (for example).

Silver Trading Observations

Targets charted in play in to next time cycle. SuperNova $SILVER Algorithm Chart Model $SLV, $USLV, $DSLV

https://www.tradingview.com/chart/SILVER/mjK7lGPH-Targets-charted-in-play-in-to-next-time-cycle-SuperNova-SILVER/

Silver, algorithm
Targets charted in play in to next time cycle. SuperNova $SILVER Algorithm Chart Model $SLV, $USLV, $DSLV

Key Silver Buy Sell Triggers (wide range swing trading):

18.51

17.74

16.96

16.17

15.40

Per recent;

Per last report 16.95 as May 7 most probable PT. SuperNova $SILVER Algo Chart Model $SLV, $USLV, $DSLV

https://www.tradingview.com/chart/SILVER/f4V72Z37-Per-last-report-16-95-as-May-7-most-probable-PT-SuperNova-SILV/

Silver, chart, daily
Per last report 16.95 as May 7 most probable PT. SuperNova $SILVER Algo Chart Model $SLV, $USLV, $DSLV

Per recent;

April 24 – Silver retrace was deeper than expected. Revised 16.95 as May 7 most probable PT. SuperNova $SILVER Algo Chart Model $SLV, $USLV, $DSLV

https://www.tradingview.com/chart/SILVER/JMMORR5d-Silver-retrace-was-deeper-than-expected-Revised-16-95-as-May-7/

Silver, price target, chart
Silver retrace was deeper than expected. Revised 16.95 as May 7 most probable PT. SuperNova $SILVER Algo Chart Model $SLV, $USLV, $DSLV

Per recent;

Silver on fire through chart model. Retrace to 16.96 Apr 24 and uptrend to 17.72 May 7 probable PT. SuperNova $SILVER Algo Chart Model $SLV, $USLV, $DSLV

https://www.tradingview.com/chart/SILVER/ZuT9lS35-Silver-on-fire-through-chart-model-Retrace-to-16-96-Apr-24-and/

Silver, algorithm, chart
Silver on fire through chart model. Retrace to 16.96 Apr 24 and uptrend to 17.72 May 7 probable PT. SuperNova $SILVER Algo Chart Model $SLV, $USLV, $DSLV

Silver 2 Hour Chart Model (daytrading)

Silver did not hit target this time – bought above. Bullish bias. SuperNova $SILVER Algorithm Chart Model $SLV, $USLV, $DSLV

https://www.tradingview.com/chart/SILVER/PbxezBFv-Silver-did-not-hit-target-this-time-bought-above-Bullish-bias/

Silver, chart, daytrading, algorithm
Silver did not hit target this time – bought above. Bullish bias. SuperNova $SILVER Algorithm Chart Model $SLV, $USLV, $DSLV

Per recent;

Silver daytrading model amazing – it keeps hitting mid quad target over and over again.

https://www.tradingview.com/chart/SILVER/jO7DpOGo-Silver-daytrading-model-amazing-it-keeps-hitting-mid-quad-targ/

Silver, daytrading, chart, model
https://www.tradingview.com/chart/SILVER/jO7DpOGo-Silver-daytrading-model-amazing-it-keeps-hitting-mid-quad-targ/

Per recent;

Silver confirming long side trade bias over 16.69 first target 16.78 then 16.95 on daytrading model. SILVER $SLV #trading

https://www.tradingview.com/chart/SILVER/cVp4ec08-Silver-confirming-long-side-trade-bias-over-16-69-first-target-1/

Silver, daytrading, chart, long, trade
Silver confirming long side trade bias over 16.69 first target 16.78 then 16.95 on daytrading model. SILVER $SLV #trading

Silver Conventional Charting

Doesn’t really matter how you draw the lines – there’s a decision coming on Silver Weekly Chart. #Silver $SLV $USLV $DSLV

Also, take note of 200 MA on weekly chart just above current trade.

https://www.tradingview.com/chart/SILVER/Q2Nj70JG-There-s-a-decision-coming-on-Silver-Chart-notes/

Silver. chart, weekly
Doesn’t really matter how you draw the lines – there’s a decision coming on Silver Weekly Chart. #Silver $SLV $USLV $DSLV

Per recent;

April 30 – SILVER conventional chart compression to end of triangle.

https://www.tradingview.com/chart/SILVER/oP1bN6XV-SILVER-conventional-chart-compression-to-end-of-triangle/

Silver, chart
SILVER conventional chart compression to end of triangle.

Per recent;

April 24 – Silver touch to 100 MA and came off. Intra getting a bounce here.

https://www.tradingview.com/chart/SILVER/HuuNsIPA-Silver-touch-to-100-MA-and-came-off-Intra-getting-a-bounce-here/

Silver, 100MA, resistance, chart
Silver touch to 100 MA and came off. Intra getting a bounce here.


Recent Algorithm Price Target Hits

May 14 – I will update target hits soon.

April 19 – Since the posts below the models have been hitting targets regularly. Looks like we have the models dialed in.

Silver Mar 2 300 PM target hit – not perfect but a hit. Provided on weekend prior report. SuperNova $SILVER Algo Chart Model $SLV, $USLV, $DSLV

Silver, price, targets, Algorithm
Silver Mar 2 300 PM target hit – not perfect but a hit. Provided on weekend prior report. SuperNova $SILVER Algo Chart Model $SLV, $USLV, $DSLV

Silver Mar 9 300 AM target hit – not perfect but it hit. Provided on weekend prior report. SuperNova $SILVER Algo Chart Model $SLV, $USLV, $DSLV

Silver, algo, chart, targets
Silver Mar 9 300 AM target hit – not perfect but it hit. Provided on weekend prior report. SuperNova $SILVER Algo Chart Model $SLV, $USLV, $DSLV

Good luck with your trades and look forward to seeing you in the room!

SuperNova Silver Algo 

Tweets by SuperNovaAlgo

Article Topics: SuperNova, Silver, Chart, Algorithm, $SILVER, $SLV, $USLV, $DSLV

Read More
Rosie Gold Algorithm Chart Model Mon May 14 $GC_F $XAUUSD $GLD $UGLD $DGLD $GDX $NUGT $DUST

Rosie Gold Algorithm Chart Model Mon May 14 $GC_F $XAUUSD $GLD $UGLD $DGLD $GDX $NUGT $DUST

May 14, 2018December 30, 2018 RosietheAlgo GLDRosie the Gold Algo Chart Report$DGLD, $DUST, $GDX, $JDST, $JNUG, $NUGT, $UGLD, $XAUUSD, Algorithm, Chart, GLD, Gold, Miners, Rosie, Trading

Rosie the Gold Algorithm Model Charting Update Monday May 14, 2018 #GOLD $GC_F $XAUUSD $GLD, $UGLD, $DGLD with Gold Miner Observations: $GDX, $GDXJ ($NUGT, $DUST, $JDST, $JNUG)

Good day! My name is Rosie the Gold Algo. Welcome to my new member edition Gold trade report for Compound Trading.

Like EPIC our Oil Algorithm chart model, I am an algorithm chart model in development and trader testing for coding phase to be used as an intelligent assistant for our traders (not HFT). My charting model is specifically suitable for the use and purpose of Gold and Gold Miner related.

The charting models are best used decision to decision. In other words, each line on the algorithmic model charts are support and resistance. As trade progresses, weighing algorithmic charting model against conventional charting observations provides an edge over using only conventional charts.

If you need assistance at anytime contact my developers at info@compoundtrading.com.

Updates:

The charting below for Gold now has prospective channel support and resistance, considerable wider time frame quad walls highlighted (thicker orange dotted lines) and key channel direction decision areas noted with purple arrows.

How to Use the Charting Model:

How to Use ROSIE Gold Algorithm: #GOLD, $GLD, $XAUUSD, $GDX, $GDXJ, $NUGT, $DUST, $JNUG, $JDST

Gold / Gold Miner Trade Coaching

Users of this algorithm model charting may opt for private one-on-one coaching with our lead trader and / or an experienced trader that has worked under our lead trader.

On our website there are standard one-on-one online coaching packages you can order (coaching via Skype) or you can request a customized package (reflecting the time you are wanting to invest in your learning). 

To request a custom package most suited to your needs email us at info@compoundtrading.com or click here for a standard private trade coaching package. Other options for coaching include online webinars for members (from time to time), private on location and in-person coaching sessions at our new trading location(s) and organized trading conference events. 

Primary Trade Indications:

Live Twitter Alert Feed for Gold / Miner Trades: @GoldAlerts_CT

Gold Trade Buy / Sell Short Term Swing Triggers

For short term trading the following are support and resistance areas for trade that can be used as buy / sell triggers for Gold.

1300.96

1311.07

1321.30

1331.51

1341.61

1351.86

1362.03

1372.72

1383.43

1384.79

The primary method of trade our traders are reporting works with the most predictability is to wait for Gold to breach the trading range (grey lines marked with arrows) up or down and then have it confirm as it leaves the corresponding trading quadrant to the up or downside. See video above.

As it is a model in development, if you find more predictable methods please report same.

Resistance and Support Clusters: Blue and Yellow horizontal (may be sloped) lines (marked with arrows). The thicker they are the more significant they are. Blue are conventional indicators and Yellow are calculated historical algorithmic points of significance. If the cluster is significant our charting techs will shade the area in white to bring this to your attention. The most recent cluster has proven to be significant resistance in recent trade.

Trading Range: Grey Lines (marked with grey arrows). Trade above or below creates bias and bias is confirmed to a high probability when trade then leaves a quadrant (geometric diamond shape formed with diagonal Fib trend lines for time – frame) after gaining or losing a trading range horizontal support / resistance line (grey horizontal line).

Quadrants: Diagonal Orange Lines that form diamond shapes. Based on diagonal Fibonacci trend lines act as important support and resistance. The wider the time frame the thicker the line.

Channel Decisions: Purple arrows note critical uptrend and downtrend channel decisions.

Fibonacci Support and Resistance: Horizontal lines on charting (various colors).

Targets: Red circles on charting. The least of the indicators and should be used for observation purpose only. The targets are in very early stage development / testing. Two are provided for each quadrant time frame – the upper scenario targets should be considered if trend is up and likewise for the lower. Only either are expected to hit (if at all – very low probability of a hit is expected at this point).

Conventional Charting: All decisions should be weighed against conventional charting (as may be provided below also).

Gold Algorithm Live Charting Link: 

Click on share button bottom right (beside flag) and then click on “Make it Mine”.

Gold Live Chart Link May 14, 2018:

https://www.tradingview.com/chart/GOLD/sbNBGHIg-Gold-current-trade-Rosie-Gold-Algorithm-May-13-246-AM-Gold-G/

Gold current trade. Rosie Gold Algorithm. May 13 246 AM #Gold $GLD $GC_F $XAUUSD $NUGT $DUST

Gold, current, trade, chart
Gold current trade. Rosie Gold Algorithm. May 13 246 AM #Gold $GLD $GC_F $XAUUSD $NUGT $DUST

Gold down channel scenario. Rosie Gold Algorithm. May 13 245 AM #Gold $GLD $GC_F $XAUUSD $NUGT $DUST

Gold, downtrend, chart
Gold doown channel scenario. Rosie Gold Algorithm. May 13 245 AM #Gold $GLD $GC_F $XAUUSD $NUGT $DUST

Gold up channel scenario. Rosie Gold Algorithm. May 13 244 AM #Gold $GLD $GC_F $XAUUSD $NUGT $DUST

Gold, up, channel, chart
Gold up channel scenario. Rosie Gold Algorithm. May 13 244 AM #Gold $GLD $GC_F $XAUUSD $NUGT $DUST

Conventional Charting Considerations:

Massive time cycle comes due late July on Gold Daily. Structure in place still. May 14 218 AM #Gold $GLD $GC_F $XAUUSD $NUGT $DUST

https://www.tradingview.com/chart/GOLD/bzK0cwH7-Massive-time-cycle-comes-due-late-July-on-Gold-Daily-Notes/

Gold, time cycle, chart
Massive time cycle comes due late July on Gold Daily. Structure in place still. May 14 218 AM #Gold $GLD $GC_F $XAUUSD $NUGT $DUST

Per previous;

Gold daily chart simple model still has structure, but it’s close to a fall out.

https://www.tradingview.com/chart/GOLD/K1clwQ6o-Gold-daily-chart-simple-model-still-has-structure-but-it-s-clos/

Gold, daily, chart, structure
Gold daily chart simple model still has structure, but it’s close to a fall out.

Per recent;

April 24 – Gold 0.33% lost 50 MA but bullish structure still in play. #Gold #XAUUSD $GC_F $GLD

https://www.tradingview.com/chart/GOLD/8tCBgGWn-Gold-lost-50-MA-but-bullish-structure-in-play-Gold-Notes/

Gold, chart, bullish
Gold lost 50 MA but bullish structure still in play. #Gold #XAUUSD $GC_F $GLD


Gold Miner $GDX:

$GDX structure still in play. Very predictable trade over and over. $NUGT $DUST $JDST $JNUG

https://www.tradingview.com/chart/GDX/izAOofSK-GDX-structure-still-in-play-Very-predictable-trade-over-and-ov/

$GDX, chart
$GDX structure still in play. Very predictable trade over and over. $NUGT $DUST $JDST $JNUG

Per recent;

April 30 – $GDX No change. Support at Fib TL quad wall held and trending in to resistance.

https://www.tradingview.com/chart/GDX/oySDQVAb-GDX-No-change-Support-at-Fib-TL-quad-wall-held-and-trending-in/

$GDX, chart
$GDX No change. Support at Fib TL quad wall held and trending in to resistance.

Per recent;

April 24 – $GDX came off at mid quad resistance as thought. Add long or enter long at quad TL line support if it holds.

https://www.tradingview.com/chart/GDX/VcYeYEEm-GDX-came-off-at-mid-quad-resistance-as-thought-Add-long-or-ent/

$GDX, chart, resistance, support
$GDX came off at mid quad resistance as thought. Add long or enter long at quad TL line support if it holds.

Per recent;

$GDX Gold miner trading near mid quad resistance test and perfectly on way to price target. $NUGT $DUST $JNUG $JDST

https://www.tradingview.com/chart/GDX/vsFoQRJA-GDX-Gold-miner-trading-near-mid-quad-resistance-test-and-perfec/

$GDX, Gold, Miner, Chart, $DUST, $NUGT
$GDX Gold miner trading near mid quad resistance test and perfectly on way to price target. $NUGT $DUST $JNUG $JDST

Recent Gold Price Targets:

May 14 – Will update price target hits soon.

Per recent;

Gold price target April 6 hit perfect to time and price provided on report 14 days prior. $GC_F $GLD $XAUUSD $DUST $NUGT

Gold, price target, algorithm
Gold price target April 6 hit perfect to time and price provided on report 14 days prior. $GC_F $GLD $XAUUSD $DUST $NUGT

Gold price target 1800 Sun lined up to price target time and price provided on report 6 days prior. $GC_F $GLD $XAUUSD $DUST $NUGT

Gold, price, target, hit, algorithm
Gold price target 1800 Sun lined up to price target time and price provided on report 6 days prior. $GC_F $GLD $XAUUSD $DUST $NUGT

Gold price target 1800 Mar 4 hit perfect to time and price provided on report 6 days prior. $GC_F $GLD $XAUUSD $DUST $NUGT

Gold, algorithm, price, target
Gold price target 1800 Mar 4 hit perfect to time and price provided on report 6 days prior. $GC_F $GLD $XAUUSD $DUST $NUGT

Gold price target 1800 Feb 4 hit perfect to time and price provided on report 7 days prior. $GC_F $GLD $XAUUSD $DUST $NUGT

Gold, algorithm, price, target, hit
Gold price target 1800 Feb 4 hit perfect to time and prce provided on report 7 days prior. $GC_F $GLD $XAUUSD $DUST $NUGT

Recent Gold and Gold Miner Trade Alerts:

May 14 – Will update Gold alerts soon.

Alert – Gold long side bias trade set-up trading intra 1346.18 PT’s on chart. Trim in to each resistance & add above.

https://twitter.com/goldalerts_ct/status/986515923657019393

Gold, long, trade
Alert – Gold long side bias trade set-up trading intra 1346.18 PT’s on chart. Trim in to each resistance & add above.

$GDX long side trade trim bias now in to resistance at 23.14 and add above long for next PT 24.21

https://twitter.com/goldalerts_ct/status/984834434015821824

$GDX long side trade trim bias now in to resistance at 23.14 and add above long for next PT 24.21

https://twitter.com/goldalerts_ct/status/984834434015821824

$GDX near mid quad res today – trim longs there and add above on break for 25.19 PT June 5. https://www.tradingview.com/chart/GDX/iriVmaBR-GDX-near-mid-quad-res-today-trim-longs-there-and-add-above-on/ …

https://twitter.com/goldalerts_ct/status/984215137010757632

Gold Trading Plan

Gold trading plan. Long side alert 405 AM – 18 Apr 2018 at green arrow 1346.18 trading 1326.50 intra. Fails at red arrow. Hold. Hedge.

Gold, trading, plan, long
Gold trading plan. Long side alert 405 AM – 18 Apr 2018 at green arrow 1346.18 trading 1326.50 intra. Fails at red arrow. Hold. Hedge.

Will add under 1321.33, 1311.86, 1300.93, expect at latest bounce 1293.51 and add there.

Trading, plan, Gold, adds
Will add under 1321.33, 1311.86, 1300.93, expect at latest bounce 1293.51 and add there.

Major support pivot in the 1293.51 area of Gold Algorithm Model. #Gold #trading #Algorithm #Chart

Gold, support, chart
Major support pivot in the 1293.51 area of Gold Algorithm Model. #Gold #trading #Algorithm #Chart

Green triangle completion of significant time cycle in Gold and support area (inverse apex). Significant buy zone if trade gets there.

Gold, time, price, cycle, chart
Green triangle completion of significant time cycle in Gold and support area (inverse apex). Significant buy zone if trade gets there.

Bullish scenario 1367.80 May 1 is top of quad in current time cycle. Unlikely but worth note for major resistance trims.

Gold, resistance, chart
Bullish scenario 1367.80 May 1 is top of quad in current time cycle. Unlikely but worth note for major resistance trims.

All the best with your trades and look forward to seeing you in the room!

Rosie the Gold Algo

Tweets by ROSIEtheAlgo

Article Topics: Rosie, Gold, Algorithm, Chart, Trading, Gold, $XAUUSD, $GOLD, $GLD, $UGLD, $DGLD, Miners, $GDX, $NUGT, $DUST, $JDST, $JNUG

Read More
Swing Trading Report Sun May 13 Part B: $CALA, $EXP, $GOOGL, $AMZN, $XRT, $BOFI, $EOG, $NG more  …

Swing Trading Report Sun May 13 Part B: $CALA, $EXP, $GOOGL, $AMZN, $XRT, $BOFI, $EOG, $NG more …

May 13, 2018July 15, 2018 Swing TraderSwing Trading$AMZN, $BOFI, $CALA, $EOG, $EXP, $FIT, $GOOGL, $GREK, $NG, $OAK, $RSX, $SLCA, $TRCH, $VFC, $XRT, Picks, Stock, Swing, Trading

Welcome to Compound Trading Swing Trading Report Sunday May 13, 2018 Part B.

In this issue; $CALA, $EXP, $GOOGL, $AMZN, $XRT, $BOFI, $EOG, $NG, $SLCA, $GREK, $TRCH, $FIT, $VFC, $OAK, $RSX, $TRCH and more …

Email us at info@compoundtrading.com anytime with any questions about any of the swing trades listed below. Or, if we get bogged down private message Curtis in trade room or direct message him on Twitter. Market hours are tough but we endeavor to get back to everyone after market each day.

Notices:

Good day!

This swing trading report is one in five in rotation. This is part B. It has been a couple weeks since the last full report – there have been a number of swing alerts, special set-up posts and videos, but no full reports of covered equities. As such, this week there will be significant reporting on equities we cover to get the reports back in cycle.

The reports are in the process of upgrades to included buy and sell triggers identified on charting of select instruments that are nearing trade set-ups. The triggers (price and / or other indicators) will also be programmed in to our charting for attendees to the live trading room and alerts will flash on screen in the trading room. Additionally, the triggers will be buy / sell points for our traders to use as part of the alerts members may receive.

If you need help with a specific trade and the specific trading plan for your swing trade set-up let me know and as I have time I can help you formulate.

When managing your trades with the reports keep in mind that you will have to invest an hour or two a week to check the indicators mentioned for buy and sell triggers.

Swing trading success, even with a service, does require “some” maintenance on the part of the user, although the new live alert service will take much of that burden off the user as we know many of our users have busy lives. It is the indicators lining up that signal a trade long entry or an exit. In our case rely heavily on MACD on daily or weekly (or Stoch RSI and Moving averages) but indicators we are basing our trade entry and exits on are listed with each trade so any user that does even moderate trade management will know when the indicator(s) have turn with or against the trade.

Intra-week you can always DM myself on Twitter or email with specific questions regarding trades you are considering for assistance. But it is critical that you attend to the maintenance of your signals at least once a week if not twice and set stops and preferably alarms so that intra-week you can enter or exit. If nothing else you can always book some coaching time and I’ll assist also (although we are at a point of waiting list for the coaching, at minimum you can get on list or for immediate help as I said please DM or email).

IF WE DON’T GET BACK TO YOU RIGHT AWAY it is usually because we are pressured with deadlines or are trading.

As live charts are made available below, click on link and open viewer. Then to use chart yourself click on share button at bottom right (near thumbs up) and then click “make it mine”.

To remove the indicators (MACD, Stochastic RSI, Squeeze Momentum Indicator represented at bottom of chart) double click on chart body – and same to return the indicators.

If you receive a report and you are not subscribed to the specific service it is a complimentary issue..

Our apologies if you receive more than one copy – it means you are on more than one subscription list. We are working to resolve this issue.

Newer updates below in red for ease.

Recent Compound Trading Videos for Swing Traders / Charting Set-Ups:

See You Tube for other recent video posts. 

Password: WOW Protected: How to Trade Box Earnings Move (Swing Trade Member Exclusive)

Protected: Trade Set-Ups (May 8 Member Edition) $AAPL, $DIS, $AMD, $ITCI, $AAOI, $SNAP, $FB, $TSLA, $EDIT, $ESPR, $LITE, $LPSN, $SPY.

May 7 – Trade Set-Ups, Consolidated Review $SPY, $AAPL, $TSLA, $SNAP, OIL, $DXY, $VIX, GOLD, $DIS, Silver more.

Trading Set-ups $FB, $AMBA, $SDTY, $TSLA, $GDX, $SLV, $BTC, $JD, $VIX, $LITE, $CELG, $FSLR more.

Do Not Ignore This Trade Set-Up | $AMBA Swing Trade | 40% ROE 3 Mos (Part 1 of 2)

Part 2 – The Battle Plan | How to Trade the $AMBA Move https://compoundtrading.com/do-not-ignore-this-trade-set-up-amba-swing-trade-40-roe-3-mos-part-1-of-2/

Password: ELON Protected: How to Trade the Tesla Move | Price Targets | Buy Sell Triggers | Time Cycles $TSLA #swingtrading #daytrading

Password: LONG Protected: Overnight Oil Trade | Trading Plan in Detail | EPIC Oil Algorithm $USOIL $WTI $CL_F #OIL $USO #Alerts

Trade Set-ups $SPY, $NFLX, OIL, $WTI, $ESPR, $GOOGL, Bitcoin, $BTC, $FEYE, $AAPL and more.

Trading Set-Ups $SPY, Gold, $GC_F, $GDX, Bitcoin, $GOOGL, $EVLV, $HEAR, $CHEK, $MARA, $PRTA, $ZDGE

Trading Set-Ups $NETE, $TSG, $ETH Ethereum, $BTC Bitcoin, $TAN, $HEAR, $AMMJ, $SNAP, $VLRX

Trade Set-Ups OIL, $WTI, $SPY, $GOOGL, $FSLR, $AXP, $GREK, $CELG, $AAOI, $SDRL, $WFT

Great Trading Last Few Wks – Lets Keep Going! $RIG, #OIL, $SPY, $ETH, $BTC, $FB, $GOOGL, $BWA, $GDX more.

Swing Trade Set-Ups Abound $SPY, $NFLX, $DIS, $EOG, $WTIC, $USOIL, $BTC, $FB, $MARA, $LITE, $IOTS and more.

Special Swing Trade Report: #OIL, #GOLD, $NFLX, $SPY, $DIS, $GDX, $TSLA, $AAOI, $ESPR, $ITCI, $TAN, $CELG, $C and more.

Email us at info@compoundtrading.com anytime with any questions about any of the swing trades listed below. Or, if we get bogged down private message Curtis in trade room or direct message him on Twitter. Market hours are tough but we endeavor to get back to everyone after market each day.

$AMBA – Ambarella Inc.

April 29 – I published a two part special report on the $AMBA swing trade, you can find them below. As the trade proves out I will post member exclusive set-ups and alerts. Could be a good one here.

Do Not Ignore This Trade Set-Up | $AMBA Swing Trade | 40% ROE 3 Mos (Part 1 of 2)

Part 2 – The Battle Plan | How to Trade the $AMBA Move

Summary of the trade set-up on AMBA:

$AMBA closed April 27 at 46.75.

Trend Change: This set-up is a long over 49.50 (if 49.50 area is held) for a major trend change to the upside. Resistance is at 51.50 area in this scenario (trim in advance and add over).

or for Active Trading: This is a long over 47.25 in to resistance near 49.40 (trim in advance and add over).

Be sure to trim longs in advance of that and then if resistance is breached add over that to the next resistance and then rinse and repeat. The horizontal fib lines on the chart show you support and resistance points.

On the short side for a day trade… Friday’s close was 46.75 and the next support is in the 44.55 range… so if there is pressure on the stock in premarket or at open Monday then a short in to the 44.55 support may work out. But be cautious, this thing has science all over it saying that a snap-back is very possible and it should be vicious when it starts.

Support and Resistance Levels – I’ve made the chart easy to manage visually by adding white arrows to each major support and resistance level. The white arrows are your primary buy sell triggers.

Note also the “trading quad walls”. These are Fibonacci based diagonal trend-lines that form a trading structure “quadrants”. They also act as support and resistance.

The red circles are price targets. The price targets for June 10, 2018 time cycle peak are 58.60 (bullish), 49.40 (moderate), 40.13 (bearish). Trade in accordance to price action toward the appropriate target. It is paint by numbers trading – just follow the rules and if your trade fails be sure to cut losses quickly and be ready to turn with price as needed. Trust the plan.

The MOST INTERESTING THING about this set-up is the possibility for a trend reversal based on a simple wash-out down trend with a snap-back that could see a significant three to six month trend to the upside.

In Part 3 (for our Swing Trading Members) I will cover that scenario for significant gains should that transpire.

Also… pay attention to the downside bearish scenario playing out here. If that occurs I will do a Part 3 specific to that and include a detailed trading plan.

My Personal Earnings Rule: 95% of the time I will not hold in to earnings. Trade your plan however you wish.

AMBA, chart, set up
Here’s your technical chart set-up for trading Ambarella $AMBA. Part 2 of 3 part series.
swing, trading, AMBA
Here is how the technical set-up appears on the daily chart for $AMBA in advance of the earnings trade. #swingtrading

Mar 21 – $AMBA swing trade technically perfect 54.72 targets 58.66 Mar 30 . Chart Notes.

https://www.tradingview.com/chart/AMBA/rOpynBS5-AMBA-swing-trade-technically-perfect-54-72-targets-58-66-Mar-30/ #swingtrading #pricetargets

$AMBA, swingtrading, chart
$AMBA swing trade technically perfect. 54.72 targets 58.66 Mar 30. #swingtrading

Feb 20 – $AMBA over 49.40 is a buy and below a sell – currently testing support resistance area.

$AMBA, chart
$AMBA over 49.40 is a buy and below a sell – currently testing support resistance area.

Feb 20 – $AMBA Not a great risk reward chart set up here with MACD and SQZMOM up and Stochastic near top. #trading

$AMBA, chart, setup
$AMBA Not a great risk reward chart set up with MACD SQZMOM up and Stoch near top.

Jan 7 – $AMBA: path of least resistance here is a pull back to 58.61 but the indecisive target may play out 67.82 per below and I believe the bullish target is a challenge. But trade in direction of target / price trajectory and trend using the triggers on the chart.

$AMBA Just shy Jan 5 bullish target 67.78 trading 63.62. Feb 15 time cycle peak has 77.08 bull, 67.82 indecisive, 58.61 bearish pull back for targets. Buy / sell swing trading triggers between targets at white arrows. Swing in direction of target trajectory #swingtrading

Real time charting link to $AMBA swing trading chart with buy / sell triggers and price targets on time cycles.

https://www.tradingview.com/chart/AMBA/iePm04YG-AMBA-Just-shy-Jan-5-bullish-target-67-78-trading-63-62-Feb-15/

$AMBA, swing, trading, chart
$AMBA Just shy Jan 5 bullish target 67.78 trading 63.62. Feb 15 time cycle peak has 77.08 bull, 67.82 indecisive, 58.61 bearish pull back for targets. #swingtrading

$AMBA Weekly chart provides perspective on clean trade through time price cycle targets at upper lower quads #tradingedge #swingtrading

https://www.tradingview.com/chart/AMBA/8J36Kzrq-AMBA-Weekly-chart-provides-perspective-on-clean-trade-through-t/

$AMBA, weekly, chart, swing, trading
$AMBA Weekly chart provides perspective on clean trade through time price cycle targets at upper lower quads #tradingedge #swingtrading

Dec 6 – $AMBA trading 57.57 after post earning pop – take long at MA bounce or Fib bounce and trim at each extension up. #swingtrading

Buy triggers (wait for a Fib buy trigger support to hold and bounce off one for a long)

49.45

51.70

54.66

57.57 trading at now

58.56 main resistance (you can use this as first sell trigger trim

63.00 sell triggers start (trim longs starting here or at main resistance above)

65.68

67.53

$COTY

April 29 – This $COTY chart is a nightmare, will likely bounce to 200 MA soon. But I may discontinue coverage soon also. Watching.

$COTY, daily, chart
This $COTY chart is a nightmare, will likely bounce to 200 MA soon. But I may discontinue coverage soon also. Watching.

Mar 21 – $COTY back to 200 MA test – wait for MACD to turn and trade long – very predictable #swingtrade

The trade velocity (ROE) is one of the best we follow, and the MACD turn up and down does it. Good annual performance on this simple indicator trade with MACD turn on the daily chart.

$COTY, chart, swingtrade, MACD
$COTY back to 200 MA test – wait for MACD to turn and trade long – very predictable #swingtrade

$FSLR – First Solar

April 29 – $FSLR trading closed Friday 77.90 and is in break-out on the daily. We’ll look at the weekly and find resistance to watch for.

$FSLR, breakout, daily, chart
$FSLR trading closed Firday 77.90 and is in break-out on the daily. We’ll look at the weekly and find resistance to watch for.

April 29 – $FSLR on the weekly chart – between here and 86.00 imo is pensive… however, it seems to have the indications to do it. Over 86 long. If I had to predict what’s next… the pull back is near and at each turn up after a pull-back it’s a long. And then if and when it gets up over 86.00 it’s a structured trade to the upside. At that point (over 86.00 held) I will chart the trade structure with specific lower time frame support and resistance and price targets along with time-cycles etc.

https://www.tradingview.com/chart/FSLR/Yf46TA2G-FSLR-on-the-weekly-chart-between-here-and-86-00-imo-is-pensi/

$FSLR, weekly, chart
$FSLR between here and 86.00 imo is pensive… however, it seems to have the indications to do it. Over 86 long.

Mar 21 – $FSLR other side of earnings great trade here… and the 20 MA and 50 MA with 20 breaching – really bullish.

$FSLR, trading, chart, bullish
$FSLR other side of earnings great trade here… and the 20 MA and 50 MA with 20 breaching – really bullish.

Mar 21 – $FSLR 78 should see 88 on weekly chart. #swingtrading https://www.tradingview.com/chart/FSLR/Cp3Ga5Nq-FSLR-78-should-see-88-on-weekly-chart-swingtrading/

$FSLR, weekly, chart, price targets
$FSLR 78 should see 88 on weekly chart. #swingtrading

$AAOI – Applied Opto Electronics Inc

April 29 – $AAOI closed the session Friday 33.76 above main trading area support around 27.50

This $AAOI chart went out to the private server on April 23, 2018;

$AAOI over 32.90 targets 39.18 then 40.66. Watch for 50 MA overhead. (purple)

https://www.tradingview.com/chart/AAOI/h0vTNpUZ-AAOI-over-32-90-targets-39-18-then-40-66-Watch-for-50-MA-overh/

$AAOI over 20 50 100 MA, indicators trending (MACD, Stochastic RSI, SQZMOM, above mid quad Fibonacci diagonal support are all bullish. Watch quad Fib downtrending trendline, FIB horizontal resistance lines and especially 200 MA on way to July targets.

I prefer the upper target as long as trade can breach the 200 MA.

https://www.tradingview.com/chart/AAOI/VFWNtWNu-AAOI-over-20-50-100-MA-indicators-trending-above-mid-quad-sup/

$AAOI, chart
AAOI chart structure on the daily chart – -algorithmic model

$AAOI News: SUGAR LAND, Texas, April 18, 2018 (GLOBE NEWSWIRE) — Applied Optoelectronics, Inc. (AAOI), a leading provider of fiber-optic access network products for the internet datacenter, cable broadband, telecom and fiber-to-the-home (FTTH) markets, today announced that it will release financial results for its first quarter ended March 31, 2018 on Tuesday, May 8, 2018.

$AAOI News: Applied Optoelectronics, Fiber-optic network provider Applied Optoelectronics Inc (NASDAQ: AAOI) has been a regular on the FIS Astec list for months. Utilization jumped 23 percent last week, pushing short interest up to 92 percent of available shares.

Mar 21 – $AAOI Sitting on 200 MA on weekly chart. If it bounces watch for 20 MA upside resistance. #watchlist #swingtrading

This is my nemesis from 2017 and now in to 2018. I am absolutely convinced this will run to at least the mid 45s this year, if not more. Earnings will be the turn imo (at latest) in about 45 days ish.

At least I admit the conviction trade struggles 🙂

$AAOI, swingtrading
$AAOI Sitting on 200 MA on weekly chart. If it bounes watch for 20 MA upside resistance. #watchlist #swingtrading

$HIIQ – Health Ins Innovations

April 29 – $HIIQ under pressure with ER in 3 days. Bias to a downside dump in to earnings and upside targets 31.15 maybe 35.70 Aug 10 – but post earnings price action will tell the story.

https://www.tradingview.com/chart/HIIQ/iLs6TVLY-HIIQ-under-pressure-with-ER-in-3-days-Bias-to-upside-targets-3/

$HIIQ, chart, swingtrading
Mar 21 – $HIIQ What a sweet trade for our swing trading members…. hit first and second targets near perfect boom town. #swingtrading #tradingtowin

Mar 21 – $HIIQ What a sweet trade for our swing trading members…. hit first and second targets near perfect boom town. #swingtrading #tradingtowin

https://www.tradingview.com/chart/HIIQ/GAB93rNq-HIIQ-What-a-sweet-trade-hit-price-targets-plan-near-perfect/ …

$HIIQ, swingtrading, pricetargets
$HIIQ What a sweet trade for our swing trading members…. hit first and second targets near perfect boom town. #swingtrading

Mar 21 – The way to trade this now is wait for the MACD to turn back up and long it to the nearest resistance notes in white arrow on chart above. Really bullish and no reason to fight the trend.

$HIIQ swing trading plan levels to watch – swing high with MACD turn to targets until MACD turns down.

https://www.tradingview.com/chart/HIIQ/te5fDkYk-HIIQ-swing-trading-plan-levels-to-watch-swing-high-with-MACD/

$HIIQ, daily, MACD, tradingplan, price, targets
$HIIQ swing trading plan levels to watch – swing high with MACD turn to targets until MACD turns down.

Feb 20 – $HIIQ targets 35.70 or 40.10 May 16 as bullish scenario. #stock #chart #swingtrade

The lower of two target scenarios from last report played out (white directional arrows).

$HIIQ, stock, chart, swingtrade
$HIIQ targets 35.70 or 40.10 May 16 as bullish scenario. #stock #chart #swingtrade

$CELG – Celgene

April 29 – $CELG with earnings in 4 days. Upside bias 105.41 downside 86.09 June 9 time cycle pending earnings price action.

Of special note with this set-up is where trade closed Friday (91.18). This specific area of the chart is a volatile area (see yellow circles to left). There are large gaps between Fib support and resistance areas. Prepare for volatility in to earnings.

I think it’s likely we see lift in to earnings. But as always trade price direction in to most logical target between support and resistance as noted on chart.

https://www.tradingview.com/chart/CELG/OkTgm9XT-CELG-with-earnings-in-4-days-Upside-bias-105-41-downside-86-09/

$CELG, chart, setup, earnings, swingtrade
$CELG with earnings in 4 days. Upside bias 105.41 downside 86.09 June 9 time cycle pending earnings

April 8 – $CELG 86s to 91s off real-time alert, buy sell trigger now. Looking for next price target in time cycle. #swingtrading

Trade wasn’t bullish enough to get to last price target BUT nonetheless it was a decent buy side trade alert in to the most recent time cycle.

Refer to my last real-time swing trading alert post on $CELG here: https://www.tradingview.com/chart/CELG/RwZItPb8-CELG-hit-last-price-target-targets-95-90-Apr-3-Chart-notes/

Now trade is sitting right on top of a mid quad price support (signalling a decision area). When price exits a time cycle and is at the mid quad this signifies the bull bear fight at the buy sell trigger. If it was trading / trending under I could confidently alert a short side trade in to the next time cycle. The same works above the quad support to the next upside bullish price target in to the next time cycle. In this instance, trade is not signalling yet which way we are going.

I will real-time alert the set-up as it concludes over the coming days.

My personal trader bias is short in to next downside price target in to next time cycle peak (see vertical dotted green lines for time cycle conclusions).

https://www.tradingview.com/chart/CELG/gdKoFxEq-CELG-86s-to-91s-off-alert-buy-sell-trigger-now-Chart-Notes/

$CELG, Swing, trade, alert
$CELG 86s to 91s off real-time alert, buy sell trigger now. Looking for next price target in time cycle. #swingtrading

1:21 PM – 8 Apr 2018 $CELG 86s to 91s off alert, buy sell trigger now. Waiting for trade direction triggers. Chart Notes. https://www.tradingview.com/chart/CELG/gdKoFxEq-CELG-86s-to-91s-off-alert-buy-sell-trigger-now-Chart-Notes/ …

https://twitter.com/SwingAlerts_CT/status/983031984753692672

5:56 PM – 26 Mar 2018 $CELG hit last price target – targets 95.90 Apr 3. Chart notes. https://www.tradingview.com/chart/CELG/RwZItPb8-CELG-hit-last-price-target-targets-95-90-Apr-3-Chart-notes/ …

https://twitter.com/SwingAlerts_CT/status/978390139201302529

Mar 26 –

$CELG Celgene 2.58% hit our last price target and now $CELG targets 95.90 April 3 peak time cycle on 60 minute chart as most probable with MACD turned up on daily. Trading 87.03 intra. If it fails trade in direction of the possible targets. #swingtrading

Use the chart model to trim and add at horizontal Fibonacci support and resistance and watch the blue diagonal trend-lines for support and resistance also.

https://www.tradingview.com/chart/CELG/RwZItPb8-CELG-hit-last-price-target-targets-95-90-Apr-3-Chart-notes/

$CELG targets 95.90 April 3 as most probable with MACD turned up on daily. Trading 87.03 intra.

$CELG, price, target, swing trading
$CELG targets 95.90 April 3 as most probable with MACD turned up on daily. Trading 87.03 intra.

Feb 20 – $CELG under 96.00 resistance is bearish to 86.00 support Feb 28 cycle peak. 60 Min stock chart.

$CELG, stock, chart, 60 mi
$CELG under 96.00 resistance is bearish to 86.00 support Feb 28 cycle peak. 60 Min stock chart.

Jan 7 – $CELG So far in this washout very indecisive trade – watching for 60 min time cycle peaks for trade lift to bring time frame out for swing trade.

In other words, as soon as trade gets bullish on the 60 minute time-frame then I can chart the daily time frame for a proper swing trade. So I am watching the mid quad time cycle peaks for possible lift for a clue to begin trading it and move to a daily time-frame chart for a swing trade post wash-out.

https://www.tradingview.com/chart/CELG/vCzFudSI-CELG-So-far-in-this-washout-very-indecisive-trade-watching-fo/

$CELG, swing, trade, chart
$CELG So far in this washout very indecisive trade – watching for 60 min time cycle peaks for trade lift to bring time frame out for swing trade.

$LITE – LUMENTUM

April 29 – Per last report “From here $LITE targets 64.95 April 6 with MACD turned down” and … yes it hit that target near perfect.

https://www.tradingview.com/chart/LITE/4gG5oDqb-Per-last-report-From-here-LITE-targets-64-95-April-6-with-MACD/

$LITE, Swing ,trade, targets
Per last report From here $LITE targets 64.95 April 6 with MACD turned down and yes it hit that target near perfect.

$LITE With earnings in 2 days it seems oversold. Expect a bounce at quad wall. Bias to 105.41 June 4. Bearish 86.09.

https://www.tradingview.com/chart/LITE/ZBSqAIwC-LITE-With-earnings-in-2-days-it-seems-oversold-Expect-a-bounce/

$LITE, earnings, set up, chart
$LITE With earnings in 2 days it seems oversold. Expect a bounce at quad wall. Bias to 105.41 June 4. Bearish 86.09.

March 26 – Doesn’t get much better than this. Great trade set-up for our swing trading platform, hit upper target and more (early), was alerted on report Feb 20 for Apr 9 PT. $LITE #swingtrading

$LITE,, price targets, swingtrading
Great trade set-up for our swing trading platform, hit upper target early from Feb 20 for Apr 9. $LITE #swingtrading

From here $LITE targets 64.95 April 6 with MACD turned down, but IMO doesn’t get the whole way.

$LITE, chart
From here $LITE targets 64.95 April 6 but IMO doesn’t get the whole way.

$CALA – Calithera Biosciences

May 13 – $CALA targeting 3.00 range July 6. Trending down quad wall near perfect. Watch for bounce. #swingtrading

This is quite amazing actually. With so much pressure to downside it is remaining structural. Great short trade but risk reward is diminishing as it nears it’s previous lows from Dec 2016. Watching for a bounce now.

https://www.tradingview.com/chart/CALA/P1UhXPq4-CALA-targeting-3-00-range-July-6-Trending-down-quad-wall-near/

News: Calithera Biosciences Inc (NASDAQ:CALA): Is Breakeven Near? https://finance.yahoo.com/news/calithera-biosciences-inc-nasdaq-cala-003530591.html?.tsrc=rss

$CALA, chart, daily
$CALA targeting 3.00 range July 6. Trending down quad wall near perfect. Watch for bounce. #swingtrading

Mar 26 – $CALA trending toward lower target and indecisive, but MACD may turn up here. Needs at least 8.30 for upside.

$CALA, chart
$CALA indecisive as it targets the lower target, but MACD may turn up here. Needs at least 8.30 for upside.

Feb 20 – $CALA Continues under pressure targeting lower targets on price cycle termination. Buy sell triggers on chart.

https://www.tradingview.com/chart/CALA/dGHYJLL9-CALA-Continues-under-pressure-targeting-lower-targets-on-price/

$CALA, stock, chart, Daily, price, targets
$CALA Continues under pressure targeting lower targets on price cycle termination. Buy sell triggers on chart.

$XRT – SPDR S&P Retail ETF 

May 13 – $XRT Under 45.00 is a short bias and over 46.00 is long bias. Retail ETF.

https://www.tradingview.com/chart/XRT/tdPTekPr-XRT-Under-45-00-is-a-short-bias-and-over-46-00-is-long-bias-Re/

$XRT, swing trade, chart
$XRT Under 45.00 is a short bias and over 46.00 is long bias. Retail ETF.

March 26 – $XRT short set up at 44.90 area if price gets there. Under significant structural pressure now. #swingtrading

$XRT, short, setup, chart
$XRT short set up at 44.90 area if price gets there. Under significant structural pressure now. #swingtrading

Jan 7 – $XRT Nice clean mid quad price time target hit on this daily swing trading chart model. #swingtrading

$XRT, price, target, hit, chart
$XRT Nice clean mid quad price time target hit on this daily swing trading chart model. #swingtrading

$XRT Symmetry suggests 41.36 ish May 2019 but be sure to trade with price action. As trade leaves this target area I will chart lower time frames as the trade gives indication to up or downside. Chart link below FYI (from previous reports).

$XRT, swing, trading, chart, targets
$XRT Symmetry suggests 41.36 ish May 2019 but be sure to trade with price action.

Dec 7 – Stoch RSI on $XRT daily has turned down so there is a chance that the lower target for Jan 8 2018 hits at 41.00 FYI on watch

https://www.tradingview.com/chart/XRT/SBZB7651-Stoch-RSI-on-XRT-daily-has-turned-down-so-there-is-a-chance-tha/

$XRT, Stochastic, RSI, Daily, Chart
Stoch RSI on $XRT daily has turned down so there is a chance that the lower target for Jan 8 2018 hits at 41.00 FYI on watch

$EXP Building Materials

May 13 – With earnings on deck this week watch this one close. 118.00 upside 93.00 downside. Good range. $EXP

Also of note; when it recently bottomed it was technically perfect to the buy trigger noted on the chart (white arrow) and now trade is above the 200 MA on daily chart. It is set to rocket if earnings are received well by the street.

https://www.tradingview.com/chart/EXP/rbshbboE-With-earnings-on-deck-this-week-watch-this-one-close-118-00-ups/

$EXP, earnings, trade
With earnings on deck this week watch this one close. 118.00 upside 93.00 downside. Good range. $EXP

Mar 26 – $EXP 118.00 or 140.00 Oct 30 2018 with MACD turned up and above 200 MA with volume.

https://www.tradingview.com/chart/EXP/A4dRb4aL-EXP-118-00-or-140-00-Oct-30-2018-with-MACD-turned-up-and-above/

$EXP, swing, trading, chart
$EXP 118.00 or 140.00 Oct 30 2018 with MACD turned up and above 200 MA with volume.

Main Buy Sell Triggers:

140.00

118.00

95.60

73.37

$FIT – FITBIT

May 13 – Trading 5.21 with flat indicators and bottom ish pattern that doesn’t look healthy. Alarmed and ready if it moves.

Mar 26 – $FIT near its previous lows, may get a bottom bounce soon. Watching Stoch RSI for a trade.

$FIT, previous, lows, chart
$FIT near its previous lows, may get a bottom bounce soon. Watching Stoch RSI for a trade.

$VFC

May 13 – Trading 77.94 with MACD on daily trending down. Won’t look at it until MACD crosses up.

Mar 26 – $VFC on weekly looks like it has some chop left. No trade.

$VFC, weekly chart
$VFC on weekly looks like it has some chop left. No trade.

Alphabet (Google) $GOOGL, $GOOG

May 13 – $GOOGL bounced perfectly early April at the buy sell trigger, now at the next buy sell trigger. Above long and below short.

https://www.tradingview.com/chart/GOOGL/84b348lm-GOOGL-bounced-perfectly-early-April-at-the-buy-sell-trigger-no/

GOGGL, daily, chart
$GOOGL bounced perfectly early April at the buy sell trigger, now at the next buy sell trigger. Above long and below short.

Mar 26 – $GOOGL interesting how it hit that quad wall support and bounced back over 200 MA. Price targets on chart. #swingtrading

As long as it holds that 200 MA it should be either 1218.00 or 1319.00 for July 11 time price cycle peak on Google chart.

https://www.tradingview.com/chart/GOOGL/GGFajJAj-GOOGL-interesting-how-it-hit-that-quad-wall-support-and-bounced/

$GOOGl, swingtrading, chart, price, targets
$GOOGL interesting how it hit that quad wall support and bounced back over 200 MA. Price targets on chart. #swingtrading

Amazon $AMZN

May 13 – $AMZN near all time highs. Watching for structure on break-out. To be determined.

$AMZN, stock, chart
$AMZN near all time highs. Watching for structure on break-out. To be determined.

Mar 26 – $AMZN Keep it easy on this and assess when Stoch RSI on daily turns. Very easy trade for decent RR.

$AMZN, trading, chart, stochastic
$AMZN Keep it easy on this and assess when Stoch RSI on daily turns. Very easy trade for decent RR.

OakTree Capital $OAK

May 13 – Trading 40.05 indicators are flat – on watch for a trade.

Mar 26 – $OAK Risk reward near long side now, watching for Stoch RSI to turn on weekly. #swingtrading

$OAK, swingtrading, chart
$OAK Risk reward near long side now, watching for Stoch RSI to turn on weekly. #swingtrading

VanEck Vectors Russia ETF $RSX

May 13 – Keenly watching $RSX trade for a breach through 200 MA with structure. On watch.

https://www.tradingview.com/chart/RSX/eNXfUAMo-Keenly-watching-RSX-trade-for-a-breach-through-200-MA-with-stru/

$RSX, stock, chart
Keenly watching $RSX trade for a breach through 200 MA with structure. On watch.

BOFI Holdings $BOFI

May 13 – $BOFI chart has the ingredients for a structured break-out of previous highs here. Watching very close now.

$BOFI, stock, chart
$BOFI chart has the ingredients for a structured break-out of previous highs here. Watching very close now.

Mar 26 – $BOFI Great trading set-up from earlier this year. Indicators extended and long side RR is limited. No new trade. Weekly chart shown.

$BOFI, weekly, char
$BOFI Great trading set-up from earlier this year. Indicators exended and long swide RR is limited. No new trade.

Jan 9 – $BOFI Very near upside break out in to earnings. On high watch now. I will alert and chart if trade starts.

$BOFI, chart, break out
$BOFI Very near upside break out in to earnings. On high watch now.

US Silica Holdings $SLCA

May 13 – $SLCA is still indecisive relative to risk reward IMO. Watching.

$SLCA, stock chart
$SLCA is still indecisive relative to risk reward IMO. Watching.

Mar 26 – $SLCA trading 25.08 with indecisive indicators on all time-frames

Jan 9 – $SLCA Will likely start a long position today on this set up. Will alert and chart the trade if so.

$SLCA, swing, trading, setup
$SLCA Will likely start a long position today on this set up. Will alert and chart the trade if so.

$EOG EOG Resources 

May 13 – $EOG Yet another great trade set up from this year, on watch for structured upside break also.

$EOG, stock, chart
$EOG Yet another great trade set up from this year, on watch for structured upside break also.

Mar 26 – $EOG watching resistance on weekly just under 109 for upside or downside trade. #swingtrading Upside targets 134.00 area and downside 83.00 area.

https://www.tradingview.com/chart/EOG/TmrfuGQM-EOG-watching-resistance-on-weekly-just-under-109-for-upside-or/

$EOG, resistance, test
$EOG watching resistance on weekly just under 109 for upside or downside trade. #swingtrading

$GREK Global Greece ETF

May 10 – $GREK Watching for strength in a move over 200 MA on weekly chart.

$GREK, stock, chart
$GREK Watching for strength in a move over 200 MA on weekly chart.

Mar 26 – $GREK on weekly is a short when Stoch RSI peaks and turns down if price under 200 MA. Watching.

$GREK, short, trade, setup
$GREK on weekly is a short when Stoch RSI peaks and turns down if price under 200 MA. Watching.

$TRCH Torchlight Energy

May 13 – Trading 1.20 indecisive.

Mar 26 – Trading 1.36 indecisive.

Jan 9 – Trading 1.26 indecisive but that could change soon.

$NG Nova Gold

May 13 – Trading 4.90. As with previous report… it is moderately bullish but RR isn’t the best.

March 26  – Trading 4.68 has some bullside indications for follow-through but I’m not convinced at this point. Watching only.

Email or DM me on Twitter anytime with thoughts or questions!

Cheers!

Curtis

Temporary Promo Discounts (for new members only).

Subscribe to Weekly Swing Trading Newsletter service here Reg 119.00. Promo Price 83.30 (30% off). Promo Code “30P”. 

Or Real-Time Swing Trading Alerts Reg 99.00. Promo Price 69.37 (30% off). Promo Code “Deal30”.

I personally guarantee our swing trading service is one of the best in the business and it’s very reasonably priced considering the technical expertise invested in the platform (Lead Trader).

Subscribe to Swing Trading Service:

Swing Trading Bundle (Swing Trading Newsletter and Live Swing Trading Alerts).

Swing Trading Newsletter (Weekly Newsletter Published for Traders).

Real-Time Swing Trading Alerts (Private Member only Twitter Feed).

One-on-One Trade Coaching (Via Skype or In-Person).

Free Mailing List(s):

Join Email List for Free Trade Charting Trade Set-ups, Deals, Podcasts and Public Webinars.

Free Swing Trading Periodical Contact Form (Complimentary Swing Trade Set-Ups to Email)

Public Chat:

Visit our Free Public Chat Room on Discord.

Tweets by swingtrading_ct

Article Topics; Compound Trading, Swing, Trading, Stock, Picks, $CALA, $EXP, $GOOGL, $AMZN, $XRT, $BOFI, $EOG, $NG, $SLCA, $GREK, $TRCH, $FIT, $VFC, $OAK, $RSX, $TRCH

Read More
How to Trade Box Earnings Move (Swing Trade Member Exclusive)

How to Trade Box Earnings Move (Swing Trade Member Exclusive)

May 13, 2018June 9, 2018 Swing TraderSwing TradingBOX, earnings, howtotrade, move

How to Trade $BOX Earnings:

Price Targets | Buy Sell Triggers | Symmetry | Channel | Time Cycles | Support and Resistance

May 13, 2018

What’s New

  • Now available for serious traders, information here for our exclusive Legacy All Access Membership.
  • 24 Hour Crypto Trading Desk opens mid May 2018 along with our Coding Algorithm Models for Machine Trading. This team is also responsible for alerting trades on the live Twitter alert feeds for all models. Formal announcements to follow.

This trade symmetry was alerted today by Sean @chefducati (Twitter). Give him a follow – he does his homework.

Part 1 – The Battle Plan | How to Trade the BOX Earnings Move (Chart Structure)

This time I will start with the exclusive member algorithmic model charting (the end of the story) and if time allows I’ll put out a conventional charting post to the public.

But for members, here’s the set-up;

If I have time I will also publish the daily time-frame, below is a weekly simple charting model.

https://www.tradingview.com/chart/BOX/7il5UXjz-BOX-Weekly-Algorithmic-Model-Chart-earnings-trading/

$BOX Weekly Algorithmic Model Chart #earnings #trading

BOX, earnings, trade, set-up, howto
$BOX Weekly Algorithmic Model Chart #earnings #trading

Trading the move.

Here’s a break down of your key levels, it is technical so don’t hesitate to ask questions:

Symmetry – As Sean pointed out when he alerted my, the symmetry is amazing with this stock. The weekly symmetry is charted between the targets with the green arcs and red circular targets. Each time price lands at a mid quad (important horizontal Fib support / resistance).

Channel – The weekly time-frame uptrending channel allows for a potential price spike to 32.87 to 33.15 with-out trade being divergent (outside of the algorithmic charting structure). Anything over that would be considered divergent in this time-frame and is a significant short sided bias scenario.

Support and Resistance – Your primary current upside resistance is at 28.36 – it closed Friday at 27.35. Your primary support in the current trading range (the current quadrant) is 23.85. See white arrows.

The Nature of Trade – It is in its nature to test the first Fib support down from the mid quad horizontal support / resistance. In this instance that is at 26.44 area. If it bounces prior to this that is a bullish signal. Long side adds in here are appropriate if trade turns on a tighter time frame such as th 30 min or 1 hour or even 4 hour.

The opposite is true if trade is above the mid quad and that resistance is at 30.24. In a long scenario trim heavy in to 30.24 and add above.

The Channel – The yellow arrows are the top and the bottom of the wide time frame (weekly) structure. They are absolute short or long side signals if trade enters either region.

Price Targets – The next price target in symmetry is Dec 10 at 28.32. However if it becomes extremely bullish the upper price target is 37.24 in that trading quadrant and top of channel.

In a bearish scenario on the same day, December 10, 2018 the target is 19.30.

Trade price toward the target but don’t forget to trim longs one Fib above the mid quad or in a short scenario cover bias should be engaged at one Fib lower than the mid quad (as explained above).

Again, this is technical so if you need a hand with your trading plan let me know. Bottom line is that each line is support and resistance – add above and trim in to them when long and when short start covering in advance and increase sizing when support fails.

In Closing:

I will re-iterate that a few hours of trade coaching or study on exactly how to trim in to resistance and how to add to your positions on winners and how to cut losses properly and quickly will return huge dividends.

You can subscribe to our Weekly Swing Trading Newsletter service here, use temporary Promo Code “30P” for 30% off Reg 119.00 Sale Price 83.30.

Or click here to subscribe and get 30% off Real-Time Swing Trading Alerts Reg 99.00 Sale Price 69.37 use temporary Promo Code “Deal30” for 30% off.

I personally guarantee our swing trading service is one of the best in the business and it’s very reasonably priced considering the technical expertise invested in the platform.

Any questions feel welcome to contact me anytime.

Hopefully I will get time to model this on shorter time-frames soon for more intra-day daytrading scenarios.

Thanks again to Sean for alerting this!

Good luck with your $BOX earnings trade and if you need any help message me anytime!

Best,

Curt

If you are not already on our Free Swing Trading Periodical email list follow the link here to get on it to receive trading set-ups in the future. Unsubscribe anytime.

Connect:

Register to free email list for trade set-ups, webinars, special events: https://compoundtrading.com/contact/

Website: https://compoundtrading.com

Free chat room: https://discord.gg/2HRTk6n

Subscribe: https://compoundtrading.com/overview-…

Twitter: https://twitter.com/CompoundTrading

Lead Trader: https://twitter.com/curtmelonopoly

Tradingview: https://www.tradingview.com/u/curtmel…

Facebook: https://www.facebook.com/compoundtrad…

StockTwits: https://stocktwits.com/compoundtrading

Email: https://info@compoundtrading.com

Compound Trading Platform: Algorithm model charting for $SPY, $VIX, #OIL, #GOLD, #SILVER, #Crypto ($BTC Bitcoin, $ETH, $LTC, $XRP,) $DXY US Dollar and Swing Trading Newsletter. Live trading rooms for daytrading and oil traders. Private coaching and live alerts.

Read More
US Dollar $DXY Algorithm Model Chart Update Sun May 13 $UUP

US Dollar $DXY Algorithm Model Chart Update Sun May 13 $UUP

May 13, 2018December 30, 2018 $DXY US Dollar Index$DXY US Dollar Algo$UUP, Algorithm, Chart, Dollar, DXY, Trading, USD

$DXY US Dollar Algorithmic Model Chart Update/ Observations Sunday May 13, 2018 $UUP

Welcome to my report for Compound Trading – $DXY the US Dollar algorithm charting model.

I am an early development model – one of seven in development at Compound Trading. This work is very early stage generation 1 work. Generation 2 – 5 is scheduled for 2018 and will eventually be coded to a digital dashboard for our traders to use as an intelligent assistant.

This charting is to be used in conjunction with conventional charting as trader assisted signals. The signals in the model (at this point) are simple that each line on the model chart are considered a support and resistance test.

$DXY US Dollar Algorithm Charting Model $UUP

$DXY US Dollar 30 Min Algorithmic Model Chart with buy sell triggers, trading quads, channel, MAs, price targets. $UUP May 13 339 PM

If this goes to a sell, the yellow are your prospective channel support and resistance for a down turn.

https://www.tradingview.com/chart/DXY/uL7Ifwwc-DXY-US-Dollar-30-Min-Algorithmic-Model-Chart-with-buy-sell-trig/

$DXY, chart, model, 30 MIN, algorithm
$DXY US Dollar 30 Min Algorithmic Model Chart with buy sell triggers, trading quads, channel, MAs, price targets. $UUP May 13 339 PM

Per recent;

$DXY US Dollar 30 Min Algorithmic Model Chart with buy sell triggers, trading quads, channel, MAs, price targets. $UUP Apr 30 352 AM

https://www.tradingview.com/chart/DXY/H4SxD6bF-DXY-US-Dollar-30-Min-Algorithmic-Model-Chart-with-buy-sell-trig/

$DXY, algorithm, model, 30 Min
$DXY US Dollar 30 Min Algorithmic Model Chart with buy sell triggers, trading quads, channel, MAs, price targets. $UUP Apr 30 352 AM

Per recent;

$DXY US Dollar 30 Min Algorithmic Model Chart with buy sell triggers, trading quads, channel, MAs, price targets. $UUP Apr 24 306 AM

https://www.tradingview.com/chart/DXY/fRPAv34Z-DXY-US-Dollar-30-Min-Algorithmic-Model-Chart-with-buy-sell-trig/

DXY, chart, channels, price targets
$DXY US Dollar 30 Min Algorithmic Model Chart with buy sell triggers, trading quads, channel, MAs, price targets. $UUP Apr 24 306 AM

Per recent;

$DXY US Dollar 30 Min Algorithmic Model Chart with buy sell triggers, trading quads, MAs, price targets. $UUP Apr 9 438 AM

https://www.tradingview.com/chart/DXY/BdCMagXx-DXY-US-Dollar-30-Min-Algorithmic-Model-Chart-with-buy-sell-trig/

$DXY, 30 Min Chart, Model
$DXY US Dollar 30 Min Algorithmic Model Chart with buy sell triggers, trading quads, MAs, price targets. $UUP Apr 9 438 AM

$DXY Geometric Daily Chart Model

May 13 – Big test with the dollar here. Visually intense on the geometric US Dollar model. $UUP $DXY

Use link below from last report to view real time chart.

$DXY, algorithm, geometric, model
Big test with the dollar here. Visually intense on the geometric US Dollar model. $UUP $DXY

Per recent;

US Dollar $DXY touched 200 MA on daily and backed off. Geometric model charting.

https://www.tradingview.com/chart/DXY/b394Eu1X-US-Dollar-DXY-touched-200-MA-on-daily-and-backed-off-Geometric/

$DXY, daily, geometric, model, chart
April 24 – US Dollar $DXY range bound sideways at support in geometric model charting.

Per recent’

April 24 – US Dollar $DXY range bound sideways at support in geometric model charting.

https://www.tradingview.com/chart/DXY/lWpcdLmA-US-Dollar-DXY-range-bound-sideways-at-support-in-geometric-mode/

US Dollar, DXY, geometric, model, chart
US Dollar $DXY range bound sideways at support in geometric model charting.

Conventional Charting Considerations:

Bull bear fight is on with dollar closing the week at the 50 MA. Watch that close. $DXY $UUP

https://www.tradingview.com/chart/DXY/du2DtL3W-Bull-bear-fight-is-on-with-dollar-closing-the-week-at-the-50-MA/

Weekly, dollar, chart
Bull bear fight is on with dollar closing the week at the 50 MA. Watch that close. $DXY $UUP

If $DXY US Dollar Index builds structured base over main pivot (red line) it’s a long all day long. $UUP.

https://www.tradingview.com/chart/DXY/PKj5eWu2-If-Dollar-builds-structured-base-over-main-pivot-Notes/

If $DXY -0.18% US Dollar Index -0.18% builds structured base over main pivot (red line) it’s a long all day long. $UUP.

WATCH the MACD for a turn down. Has it’s 200 MA (pink), but that’s not considerable relatively speaking right now.

Watch the pivot and watch the MACD on the daily. MACD turns down and it will be a retrace 99 in 100 times.

daily, dollar, chart
If $DXY US Dollar Index builds structured base over main pivot (red line) it’s a long all day long. $UUP.

Per recent;

$DXY There it is, reach up and touch to 200 MA and a back off intra. MACD trending on Daily.

https://www.tradingview.com/chart/DXY/xM0QQv1p-DXY-There-it-is-reach-up-and-touch-to-200-MA-and-a-back-off-in/

DXY, Daily, Chart, 200 MA, MACD
https://www.tradingview.com/chart/DXY/xM0QQv1p-DXY-There-it-is-reach-up-and-touch-to-200-MA-and-a-back-off-in/

Dollar bulls keep an eye on 200 MA overhead on daily. $DXY #USD $UUP #chart #resistance

https://www.tradingview.com/chart/DXY/DGp06qLl-Dollar-bulls-keep-an-eye-on-200-MA-overhead-on-daily-DXY-USD/

DXY, chart, 200MA, resistance
Dollar bulls keep an eye on 200 MA overhead on daily. $DXY #USD $UUP #chart #resistance

Per recent;

April 9 – $DXY Daily chart range trade stuck with MACD indecisive. $UUP

https://www.tradingview.com/chart/DXY/bgTJqSqy-DXY-range-trade-stuck-with-MACD-indecisive-UUP/

$DXY, Daily, Chart
$DXY range trade stuck with MACD indecisive. $UUP

Per recent;

MACD turned down on DXY. Not an easy trade here or lately.

https://www.tradingview.com/chart/DXY/xeNnsI8J-MACD-turned-down-on-DXY/

$DXY, MACD, daily
MACD turned down on DXY. Not an easy trade here or lately.

Best with your trades and look forward to seeing you in the room!

$DXY US Dollar Algo

Tweets by dxyusd_index

Article Topics: $DXY, Trading, USD, Dollar, Chart, Algorithm, $UUP

Read More

Posts navigation

Older posts
Newer posts
Proudly powered by WordPress | Theme: sharksdesign by reviewexchanger.
 

Loading Comments...