

Blogs
Strategies for Day Trading and Swing Trading Crude Oil | Premium Member Newsletter
Strategies for Crude Oil Futures Trade February 12, 2019. Includes Rule-Set Instructions.
Below is the oil futures trading battle plan for day trading, swing trading intra-day and longer term swing trading.
This report includes a section that breaks out much of the rule-set for the 1 minute model with an actual trade progression as alerted in the oil trading room and on the Twitter alert feed. The report on whole provides key insight in to the rule-set we are using.
If you want to learn how we traded for over 63% gains last month, study this report and any recent reporting and videos closely. Our software techs believe 500% is not out of the question. I know it’s lofty, but when you consider the current win rate (over 90%) and that last months trading gains were only as a result of trading less than 10% of the time you can then begin to appreciate the power of a winning systematic oil trading rule-set.
The EPIC Crude Oil Algorithm Reporting below is an alternate format to the regular format – we will be using alternate formats during a period of establishing simplified trading strategies for our members (the trade rule-set).
Links for the 1 minute model and the 30 minute EPIC model are provided separate of this report to members as they are slightly different for different distribution lists (retail, commercial, institutional variations). If you need either please message us preferably at [email protected].
Oil Trading Strategies Below are in Large Part Based on the EPIC Oil Algorithm Charting Model.
We Weigh Trade Probabilities on all time-frames against the EPIC model. This is important to consider when assessing our trade alerts for your own trading plan.
The EPIC Crude Oil Trading Algorithm Model below is by far the most predictable model we use for trade (30 Minute chart model).
The 30 minute EPIC model provides a general trading structure for the day. Important areas of support and resistance should be considered. It is common for the outside quad walls to be tested on the upside and downside. Long trades at the bottom support and short trades at the top of each quad or channel should be considered. Specific points of trade execution should be considered on lower time frame charting models.
On the EPIC Algorithm model a trade in to top of quad range is probable if price is over mid quad.
Refer to historical EPIC reporting and videos on yYouTube for ways to structure trades in the model.

- Trading the Range of the Quadrants and Range of the Channels:
- Respecting the key resistance and support areas of the oil trading model at quadrant walls (orange dotted), channel support and resistance (orange dotted), mid quad horizontal support and resistance (horizontal line that cuts through middle of quad) and the mid channel lines (light gray dotted).
- We are finding that when oil trade is not in an uptrend or downtrend and is trading sideways around a pivot that trade will often test the mid channel lines (gray dotted) of the model. This causes the predictability of the quadrant support and resistance to be less (trade at quad support and resistance can be “sloppy”). This trade action in the model makes logical sense as a trend is not in play for an up or down channel. Another way to describe it would be trade using half quadrant support and resistance. While trade is in a sideways pattern on the daily your intra-day crude oil trading strategy should reflect this scenario. See examples from trade below:
-

“the predictability of the quadrant support and resistance to be less #crude #oil #trading #strategies” -

“when oil trade is not in an uptrend or downtrend and is trading sideways around a pivot (as it has the last eight or so trading days) that trade will often test #oil #trade”.
-
- Trade Size.
- Sizing should be considered at key support and resistance of the EPIC model structure. The model can be used to determine sizing bias on tighter time frames on one minute below. Sizing can also be a consideration for short term swing trading oil in the model.
Per previous;
Screen capture of trade moving through EPIC Crude Oil Algorithm range Jan 16 – 20. The quadrant walls and mid channel lines are support and resistance.

Timing Trades Using the One Minute Oil Chart Model.
- Volume.
- Wait for volume. Low volume periods have lower predictability in the models. Often early in futures trade and after 2:30 oil settlement daily are commonly low volume periods of trade.
- Trend.
- Determine the intra-day direction (trend) of trade. Strong bias should be considered for long or short positioning based on intra-day trend. Upward trend bias to long positions and down trend intra-day bias to short positions.
- Determine the trend on the daily chart also, some bias should be toward that. Watch the MACD on the daily, although it is a moderately late indicator it does confirm bias / trend.
- Check important timing for key global market open hours (inflections in intra-day trend can occur there, especially going in to New York regular market open).
- Support and Resistance.
- In an uptrend try and execute on support of the range on the one minute trading box (short term pull back) – the opposite is true in a downtrend. Break-up or break-down trades are more risky but can return positive results as long as a trader closes losing positions quickly.
- Trade Size and Positioning.
- In a predictable structure sizing intra-day should be maximum at entry and trims at mid trading box and top or bottom of trading box – specific to the 1 minute chart model. Our software for instance will enter with 10 contracts and release size as trade proves. See example below:
- Our trader in crude oil trading room providing signals for trade alert that went out to members – screen capture.
- “M – Machine sell program initiated. Short 52.44. Stop 52.61 or buy program detected. 1 Min model price targets 52.29 52.11 51.88 51.66. Support 51.73 on recent 30 min model in trading room and 52.50 52.38 52.19 51.75 EPIC. Resistance 52.62 52.75 53.04 53.16 53.51 EPIC.”
-

Our trader in crude oil trading room providing signals for trade alert that went out to members – screen capture.
- Our trader in crude oil trading room providing signals for trade alert that went out to members – screen capture.
- Position size and trimming to take profits as you go should also reflect key resistance and support on the EPIC algorithm model.
- Trim positions at mid trading box and top of trading box on the one minute chart model for long positions and the opposite is true in shorting. In a squeeze or sell-off this is more difficult and typically a trader will have to trade the break upside at resistance or downside as support is breached because pull-backs are not as likely in a squeeze.
- In a predictable structure sizing intra-day should be maximum at entry and trims at mid trading box and top or bottom of trading box – specific to the 1 minute chart model. Our software for instance will enter with 10 contracts and release size as trade proves. See example below:
- Using Trade Stops.
- From the example above, you will see the stop was set at 52.61 with allowance for a stop also to be triggered if momentum change was detected. “Stop 52.61 or buy program detected”.
- From the oil trading room see also this comment “M – there is a directional move component of the code (that will be included on rule-set that is in final edit tonight). If a move starts and doesn’t directionally continue with prescribed velocity, program will close at entry or prior.”
- The screen capture of the one minute chart below shows you the determined location for the stop for the trade.
- The stop was set just above VWAP and the resistance on the pivot trading box. Above is important to allow for other stops. Your stop will be a total of about 13 – 19 ticks depending on exact entry point.
- You will also notice that I have drawn the Fibonacci retracements on the chart to determine where the trading box pivot resistance is on the one minute model. If you do not know how to do this, be sure to either watch the videos we have on our You Tube channel, read through recent reporting or obtain some private coaching. We do not include the Fibonacci levels on the model because it makes the chart difficult to load on many machines – especially laptops.
-

The stop for the oil trade was set just above the pivot resistance and just above VWAP.
- The stop was moved to the trade entry point in the example below, as trade proved itself below the pivot support. “M – Machine stop at entry”.
- The stop at entry now put us in a no loss position. It was not moved until trade was below the pivot support AND trade hit the first Fibonacci support. Oil trade then bid up to 1 tick under the stop and entry point a number of times before continuing down intra-day.
- To be even more precise about the trade short entry point and the location of the stop you would have to view a fractal of the Fibonacci levels one down. This is not required or reasonable for the day trader executing orders manually to do, it would be too cumbersome for most traders. However, if you want to learn how to do this you can either get in to some trade coaching or ask at our next webinar for oil trading that will be held late February. I am simply pointing out that the precise entry and stop was not coincidental and the fact that trade returned to just under by one tick and ran sideways for nearly 30 minutes was no coincidence. That is machines in the oil trading market.
-

Oil trade dropped below pivot trading box support and hit first Fib mark and stop was now set to trade entry point.
- From the example above, you will see the stop was set at 52.61 with allowance for a stop also to be triggered if momentum change was detected. “Stop 52.61 or buy program detected”.
- Timing Trade Entry.
- The main trading box on the one minute is the support and resistance of the range (where the red and blue dotted and white dotted are).
- Below is an example screen shot of oil trade from the oil trading room example above that shows the intra-day trend of oil trade and the entry point short under the support which is now resistance.
- Trade was trending down in futures from open. Oil was now trading under support on 1 minute chart model, now resistance.
-

Crude oil trade short example chart shows intra-day trend, breach of support and execution of trade on chart.
- Below is an example screen shot of oil trade from the oil trading room example above that shows the intra-day trend of oil trade and the entry point short under the support which is now resistance.
- To pin point timing to the second you can use the pivot areas (top and bottom of range) and monitor the coil around the main support and resistance areas and use the smaller trading box around the pivots. Recent blog posts / videos discuss this and I will discuss further in near term video / blog posts.
- Indicators on the one minute that I use are the Stochastic RSI, MACD and Squeeze Momentum Indicator. The nature of these indicators on a short time frame like the one minute can be deceiving for even the more advanced trader. Use them with caution.
- The main trading box on the one minute is the support and resistance of the range (where the red and blue dotted and white dotted are).
- Using the Oil Trade Alerts.
- You can utilize our oil trade alerts in three main ways;
- The live trading room provides charting and voice broadcast from our lead trader. This is not a chat room – it is intended for traders to be able to hear our lead trader call trades live and view the charting he is using. Any chat is specifically kept to key signals from traders in attendance. This is primarily used by full time traders, institutional or private trading firms.
- The oil trade chat room (private Discord server) is for chat and oil trade signals etc. You can get push notifications to your phone for quick alerts. This is faster than the Twitter oil alert service provided but not as fast as being in the oil trading room with our lead trader. But the lead trader is not always in the live room so Discord provides fast alerts.
- The Twitter EPIC oil alert feed is also used by some of our traders.
- Trade alerts as shown in oil trading room (specifically the chat room private server on Discord) for trimming the short position as it proves out.

Trade alerts as shown in oil trading room for trimming the short position as it proves out. - Screen image of the oil trade alert feed on Twitter as the trade progressed.
-

Screen image of the oil trade alert feed on Twitter as the trade progressed.
- You can utilize our oil trade alerts in three main ways;
- Trimming Positions.
- In the example above (the screen shot of the Discord private member chat room), you see a series of trade alerts from our trader signalling position trimming.
- First Price Target Achieved. “M – first target hit 52.29 trim 10%.”
- The position was trimmed at 52.29 per the original alert signaled as follows “1 Min model price targets 52.29 52.11 51.88 51.66.”
- The amount or size of trim (cover) on the trade was determined to be 10% because this was only the first target in a highly probable trade. The probability rule-set encompasses about 5700 rules so we won’t go in to that here and is not needed for the oil trader to be highly successful using this trading system.
- The first price target alerted was 0.5 retracement on Fibonacci on 1 min oil trading model.
- Notice how trade reversed after the target was hit and was denied at the bottom of the pivot trading box and just under VWAP. Comment from lead trader in the chat room “when it dumped at 52.37 that was a VWAP touch at resistance – boom.”

The first price target alerted was 0.5 retracement on Fibonacci on 1 min oil trading model.
- Price Target 2 Hit. “M – Trim 20% 52.17 at target 2 @ 52.11 short time frame momo reversal”.
- When price misses a target and reverses, which is what it did in this instance (by a fraction), our rule-set in the strategy is to trim the position.
- The size of the trim was in accordance to price target 2 trim size in the rule-set, which is 20%.
- Below is the oil chart model showing the location of the alert to trim size and trade reversing intra-day after meeting price target objective.

Location of price target 2 was the trading box support on oil chart. Trade reversed a fraction before.
- At 30 minute candle expiring trade alert was sent to trim 10% because oil trade held support. In this case pivot trading box support. See chart below that coincides with alert “M – trim 10% 52.03 on timing”.
-

At 30 minute candle expiring trade trim 10% because oil trade held support. In this case pivot trading box support. - Remaining oil trade alerts to trim winning trade. Strategy works well. Oil trading room screen image is below.
- Alerts provided were as follows; “M – trim at 51.94 on timing (target 2 @ 51.88), 30%.
M – Correction: target 3 at 51.88
M – trim 10% 51.88 target 3 hit
M – stop on remaining 52.13 or 51.67 if hit.”
- Alerts provided were as follows; “M – trim at 51.94 on timing (target 2 @ 51.88), 30%.
-

Remaining oil trade alerts to trim winning trade. Strategy works well. Oil trading room screen image. - Trade alert to close oil trade position. “M – stop activated on remaining position 52.13″.

- Oil chart showing where to trim short trade at next Fibonacci support line.
-

Oil chart showing where to trim short trade at next Fibonacci support line. - Oil trade alert produced a 57 point move for an excellent win. Chart shows the trade progression.
-

Oil trade alert produced a 57 point move for an excellent win. Chart shows the trade progression.
Per previous;
Day Trading Crude Oil Futures One Minute Strategy Model Jan 27 504 PM FX USOIL WTI $CL_F $WTI $USO #Crude #Oil #Daytrading

Per previous;
The main trading box range is shown in chart below with purple arrows and the pivot at support and resistance trading box is shown with white arrows (for micro timing decisions).

Also Monitor Oil Resistance and Support Levels on the 4 Hour, Daily, Weekly and Monthly Chart Models.
Beyond using the EPIC Oil Algorithm model for weekly / daily trading strategy / structure and the one minute chart model for timing day trades, use the daily, weekly and monthly chart models for important decisions in oil trade.
The longer the charting time-frame the more serious support and resistance areas should be considered. In other words, key resistance on the monthly or weekly charts trump consideration on the daily and 4 hour and so on.
Trading trend, indicators, support and resistance, support and resistance, indicators and more should have bias to your trade sizing and positioning.
Crude oil trading strategy on 4 hour chart model, key areas of support and resistance noted with white arrows.
Although a test chart (for our machine trading), the 4 hour oil chart below has been responding well to the bounce trend in oil trade so I continue to use it. The key areas of support and resistance are noted, however, all lines are support and resistance levels.
Symmetry on 4 hour oil chart model should be considered. Currently trading over 50 MA.

Oil trade met the price target on the 4 hour model perfect to timing. See charts below.

Per previous;
4 Hour Crude Oil Chart – 20 MA seems the most logical support test for a long trade entry test likely 52.90 area on West Texas.

The previously published chart shows primary support areas to watch (per below).
Per previous;

Symmetry on this 4 hour oil chart model should be considered also. There are 3 options for trade trajectory here.

Per previous;
Key resistance and support for day trading crude oil futures on 4 hour test chart for sizing strategy on machine orders.
Symmetry on this chart structure says 55.30 on West Texas Crude is likely near Feb 1 and down to target. #oil #trading #strategy.

Per previous;
And with this chart also, it is responding well but also is a test chart. I’ve been watching it closely as the support and resistance areas on the charting do seem to be in play. Our techs are back testing test charts.

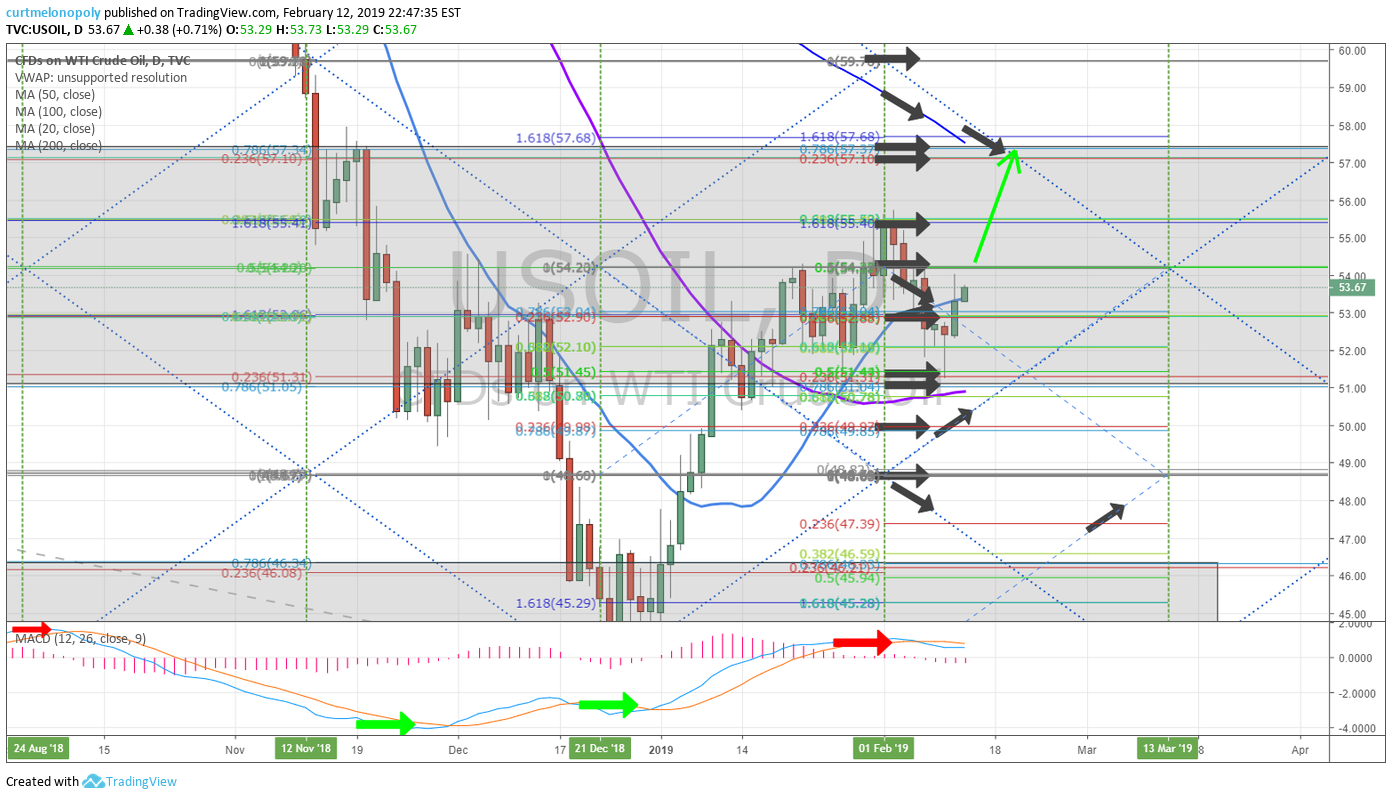
Daily crude chart resistance 54.23, above that holds and 57.32 is in play for Feb 20, 2019 price target.

Per previous;
Daily FX USOIL WTI chart shows 54.14 Feb 1 price target still in play, look for spike or drop in to date. #crude #oil.
A pull back to 20 MA on daily chart is most probable.

Per previous;
Key support and resistance on daily crude oil chart is noted for day trading strategy.

Various points of resistance and support on weekly oil chart. Watch the red trend lines close.

Per previous;
Weekly FX USOIL WTI crude oil chart has been responding well also to market support and resistance areas for trade.

Per previous;
Key support and resistance noted on weekly crude oil chart for futures trade strategy.

Other charts are used in decisions for bias toward trade, some are included below and for others visit the private oil chat room on Discord.
30 minute intra-day crude oil sketch chart from Curtis’ trading desk.
https://www.tradingview.com/chart/USOIL/etSPbOpT-30-minute-doodle-chart/

4 Hour chart structure shows sideways trade in crude oil of late. Also shows timing coming due this candle.

It is also highly recommended that you review recent reporting, discord room chat (regular guidance is posted in the oil chat room private server) and the various videos that are released on a regular basis.
January 2019 Oil Trading Alert Profit / Loss.
Feb 6 – Day Trading Short for a Break to Downside Price Targets (How to with video).
How I Day Trade Crude Oil Short | Downside Break (Waterfall) | Oil Trading Strategies (w/video).
Jan 31 – Day Trade Timing Strategies for Crude Oil Trade Around Time Cycles and EIA.
Jan 28 – Day Trading the Support and Resistance of the Model. How to.
100 Tick Move | Crude Oil Day Trading Strategies | Trade Model Support and Resistance
Jan 27 – Weekly Crude Oil Trading Strategy Guidance Private Post for Premium Members.
Oil Trade Strategies | Day Trading Crude Oil | Premium Member Weekly Guidance.
Jan 23 – Day Trading Crude Oil Futures for Compound Gains.
Not Just Concept: Day Trading Crude Oil 10K – 1 Million in 24 Mos at 10 Ticks Day (Compound Gains).
Jan 20 – Weekly Crude Oil Trading Strategy Guidance Private Post for Premium Members.
Oil Trade Strategy | Day Trading Crude Oil Futures | Premium Weekly Guidance.
Jan 19 – A detailed inside look at our day traders’ strategies in crude oil day trading room.
How I Day Trade Crude Oil +90% Win Rate | Friday’s 158 Tick Move | The Strategy We Used To Trade It.
Jan 18 – By far one of the most important videos for day trading crude oil since our inception;
How I Day Trade Crude Oil on One Minute Chart | Trading Signals | Alerts (with video).
If you have any questions send me a note please!
Best and peace!
Curt
PS Remember to protect capital at all cost, cut losers fast and know that when you win you really win. Use the 1 min charting model for entry timing, cut losers fast and re-enter if you have to. Do that until you learn how to be a regular win-side trader.
Further Learning:
If you would like to learn more, click here and visit our Crude Oil Trading Academy page for complimentary oil trading knowledge – posts from our top crude oil traders that includes learning systems, blog posts and videos.
Welcome to NYMEX WTI Light Sweet Crude Oil Futures.
Subscribe to Oil Trading Platform:
Standalone Oil Algorithm Newsletter (member charting sent out weekly).
Real-Time Oil Trading Alerts (Private Twitter feed).
Oil Trading Room / Algorithm Newsletter / Alert Bundle (includes weekly newsletter, trading room, charting and real-time trading alerts on Twitter).
Commercial / Institutional Multi User License (for professional trading groups).
One-on-One Trade Coaching (Via Skype or in person).
Click here to find all information and pricing on Oil Newsletter, Trading Chat Room, Oil Alerts and more.
Curtis Melonopoly (@curtmelonopoly) is rated Top 250 Stock exchanges authority, covering also Mathematical finance and Economy of the United States
Article Topics: Day Trading, Crude, Oil, Futures, Strategy, USOIL, WTI, CL_F, USO
Follow:
Swing Trading Earnings w/Video | Time Cycle, $TWTR, $FB, $AMD, $ARWR, $FEYE, $XOM, $BP, OIL …
Trade Set Ups for Swing Trading Earnings Thursday Feb 7, 2019.
Swing Trading Signals in this Report: Time Cycle, $TWTR, $FB, $AMD, $ARWR, $FEYE, $XOM, $BP, OIL and more…
Email us at [email protected] anytime with questions about any of the swing trade set ups covered in this video. Market hours can be difficult to respond but we endeavor to get back to everyone after market each day.
Earnings Season Calendars.
Bloomberg Earnings Season Reporting Calendar List: https://www.bloomberg.com/markets/earnings-calendar/us
Investing.com Earnings Calendar https://www.investing.com/earnings-calendar/
Earnings Whispers #earnings for the Week
$GOOGL $TWTR $SNAP $CLF $TTWO $ALXN $DIS $BP $CLX $SYY $GM $GILD $CMG $GRUB $EA $STX $SPOT $AMG $SAIA $RL $CNC $EL $UFI $GLUU $MTSC $JOUT $PM $GPRO $LITE $FEYE $SWKS $LLY $MPC $BDX $REGN $VIAB $ONVO $HUM $ARRY $PBI $ADM $BSAC
#earnings for the week $GOOGL $TWTR $SNAP $CLF $TTWO $ALXN $DIS $BP $CLX $SYY $GM $GILD $CMG $GRUB $EA $STX $SPOT $AMG $SAIA $RL $CNC $EL $UFI $GLUU $MTSC $JOUT $PM $GPRO $LITE $FEYE $SWKS $LLY $MPC $BDX $REGN $VIAB $ONVO $HUM $ARRY $PBI $ADM $BSAC https://t.co/r57QUKKDXL https://t.co/Bm7PEKXynT
— Melonopoly (@curtmelonopoly) February 3, 2019
Earnings Season Special Reports Thus Far:
Jan 29 – Protected: Swing Trading. Earnings. Video. $AMZN, $AMD, $TSLA, $FB, $NFLX, $MSFT, $AAPL, $DAL, $BAC, $C…
Jan 28 – Protected: Swing Trading: Earnings Special Report | $AMZN, $MSFT, $FB, $BABA, $TSLA
Jan 24 – Protected: Swing Trading: Earnings Special Report | $AAPL, $AKS, $AMD, $AGN, $EXP
Jan 17 – Protected: Swing Trading Earnings | Video: Trade Set-Ups | $MS, $AXP, $C, $SJR, $BAC, $DAL, $NFLX, $SPY, $VIX
Jan 16 – Protected: Swing Trading Earnings | Feature Report | $MS, $AXP, $C, $SJR, $BAC, $DAL, $NFLX
Jan 14 – Protected: Swing Trading Earnings | Feature Report | $C, $SJR, $BAC, $DAL, NFLX
Swing Trading Set-Ups:
Feb 6 – Inflection? Mid day review tells you what to watch and when. #timecycles #swingtrading #daytrading https://www.youtube.com/watch?v=UCyiwmTDYno
Feb 7 – TWITTER (TWTR) over 34 targets 38.72 then 51, under targets 26.26. $TWTR #swingtrading #earnings

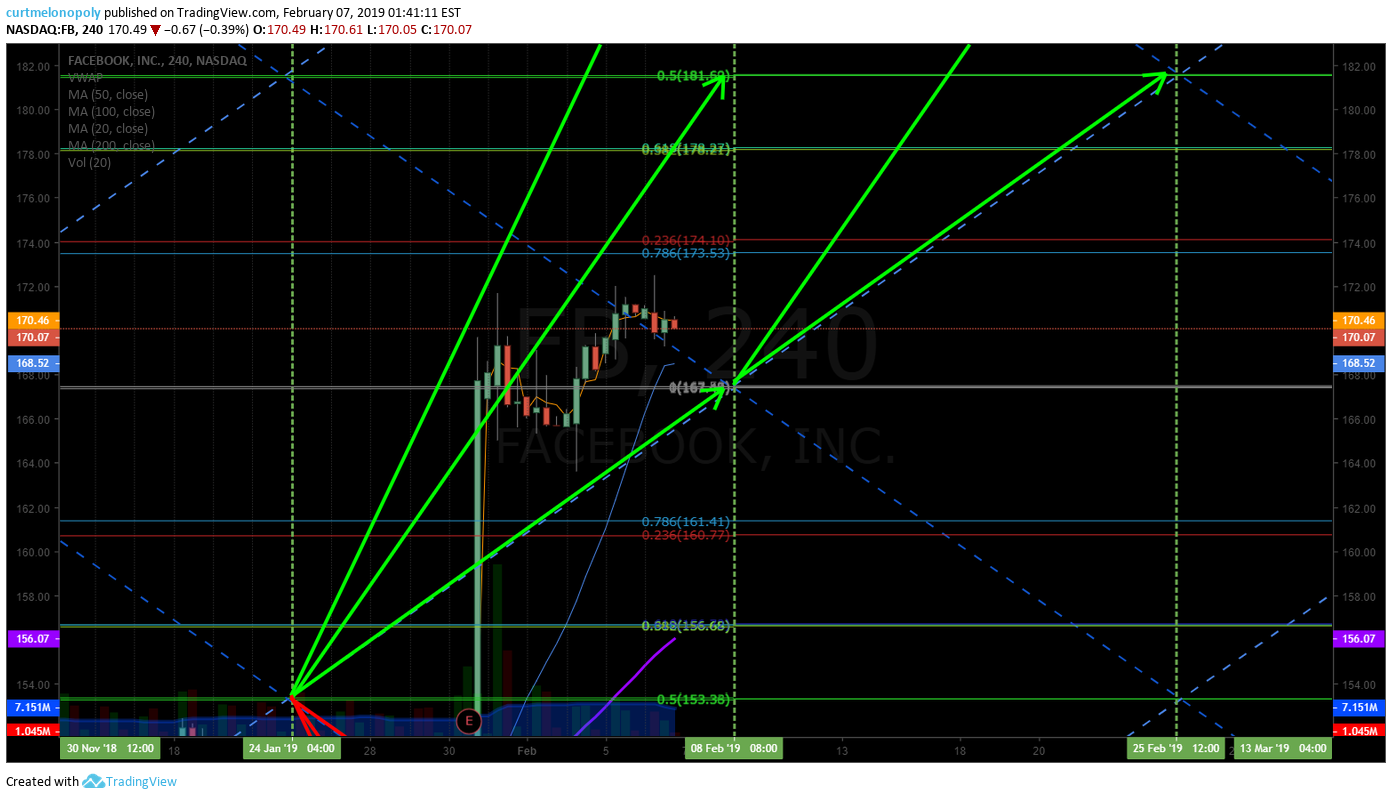
Feb 7 – FACEBOOK (FB) hitting first target from previous report, over 174.00 targets 181.50 then 195.00 $FB.

Feb 7 – ADVANCED MICRO (AMD) hit the upside price target early from last report, over 24.16 then 25.30 targets 29.

Feb 7 – BP Try and ignore chart noise and focus on price targets, over 44.30 targets 48, 57.50, 67 #swingtrading $BP
This is a really strong structure for a run in to Oct 2019 at minimum. 57.50 is my personal bias and I’ll be taking a long over 44.30. Price needs to hold 44.30 to make it work. Closed Wednesday 43.04.

Feb 7 – Crude Oil Swing Trade Set-Up. Try and ignore noise on chart, focus on upside downside price targets when oil price trades out of structure.
I really like this crude oil swing trade set-up. Will be watching very closely. Where price leaves the structure is still unknown and I will update the set-up at that point in time. If it runs up I’ll short $DWT again and if not I’ll long $DWT for the swing.

Feb 7 – EXXON (XOM) holding initial position, will trim in to target add above for continuation $XOM.

Feb 6 – ARROWHEAD PHARMA (ARWR) Holding this long term starter swing position in to earnings – on watch for adds $ARWR.
https://twitter.com/SwingAlerts_CT/status/1093191421048299521

Feb 6 – FIREEYE (FEYE) FireEye over 19.30 is a long to 22.50 test and under is a short to 17.59 then 16.20. $FEYE
https://twitter.com/SwingAlerts_CT/status/1093203230073503745

Email or DM me on Twitter anytime with thoughts or questions!
Cheers!
Curtis
Subscribe to Swing Trading Service:
Swing Trading Bundle (Swing Trading Newsletter and Live Swing Trading Alerts).
Swing Trading Newsletter (Weekly Newsletter Published for Traders).
Real-Time Swing Trading Alerts (Private Member on Twitter Feed and more recently by way of Email).
One-on-One Trade Coaching (Via Skype or In-Person).
Free Mailing List(s):
Join Email List for Free Trade Charting Trade Set-ups, Deals, Podcasts and Public Webinars.
Free Swing Trading Periodical Contact Form (Complimentary Swing Trade Set-Ups to Email)
Public Chat:
Visit our Free Public Chat Room on Discord.
Article Topics; Compound Trading, Swing, Trading, Stocks, Signals, Earnings, Video, Time Cycle, $TWTR, $FB, $AMD, $ARWR, $FEYE, $XOM, $BP, OIL
How I Day Trade Crude Oil Short | Downside Break (Waterfall) | Oil Trading Strategies (w/video)
Crude Oil Day Trading Session From Oil Trading Room – Trading Set-up Short Waterfall Strategy.
If you want to learn how to day trade crude oil, or if you want to win more often and already are an oil day trader this post with live video from our oil trading room will provide you with insight to how I day trade crude oil.
The planning and preparation I perform prior to every trade (such as reviewing support and resistance on all time frames and charting), the signals I watch for and what the water-fall short trade set-up looks like and specifically how to day trade the price action.
This is a very detailed video and I highly recommend oil traders study it for maximum consistency to your trading gains.
Voice broadcast starts at 1:23 on video.
At start of this video there are announcements about what we are doing (our staff work in progress) and general view of markets and how the trade of equities (swing trades) is affected by nearby resistance on oil charting.
Topics of announcements include the coding updates for the machine trading, status of algorithm reports, the huge month in our oil trading last month (up 63% in one month), trade alerts, digital platform for our clients to watch machine trade real-time, swing trade timing for equity and various algorithm model swing trade positioning in this time cycle, why the machine trading can beat my overall return performance by 10 times, coding of other algorithm models, the publishing of the rule-set modules for oil trading (mechanical human executed & machine traded, intra-day swings, longer term swings and daytrading).
The Pull Back In Oil Trade.
At 9:20 I discuss the trade action in oil as we trade near key resistance in oil. We should see 53 and possibly 52’s and even more down.
Trade Signals to Watch For Positioning Swing Trades, Intra-Day Swings and Day Trading..
When trade hits support for a proper bounce we know when machines are in trade because the trade action becomes really clean within the models. This predictable trade action provides a signal for when to start longer swing trade entries, helps us with intra day swing trades within the EPIC trading model and provides for precise day trading on the one minute model.
Trend Line Support on Watch.
At 10:30 on video the basing trend-line on the 4 hour chart is reviewed as support. Conclusion of this pull back in oil should come soon. I am expecting at latest Monday or Tuesday of next week.
Watch for violent trade up / down (stops taken out), most likely down first so I am positioning my bias for that scenario first. Likely a sharp down and then sharp up and then the mid point between the two points should be the decision area.
Tomorrow is EIA so this could be your timing or likely before end of week is likely for the spike up and down and then the pivot decision goes in to Sunday night futures.
https://www.tradingview.com/chart/WTICOUSD/kn9o1TRw-4-hr-concept/

One Minute Crude Oil Day Trading Model.
At 12:48 I discuss trade on the one minute day trading model. The problem in trade as we get close to key resistance decision is trade becomes sloppy. So I show you how to trade the model if you need to trade and you don’t want to wait for the decision on oil trade trend direction.
The indicators are late so you have to act on price prior.
How to Trade a Key Intra-Day Break to Down Side (Waterfall) or Upside. The Oil Day Trade Starts Live on Video Here.
At 14:00 the intra-day possible break to downside in trade is discussed.
Planning and Preparation for Your Day Trade – Know Your Key Support Area on Charting Prior to Entering a Trade.
- When trade on the one minute charting looks like a break to downside (or upside) is possible I first go to the EPIC model for key support or resistance. 53.52 is at mid quad on model, so that is support to watch.
- At 16:24 on video 53.00 is a support on the daily chart (a Fibonacci support on the oil daily chart and the 20 MA support).
- 51.13 is next support and 57.31 for Feb 20 is the upside scenario.
- My bias is pull back and then go again.
- 53.00 – 55.50 is a likely pivot area until a conclusion occurs in this trade area.
-

Oil trading room screen shot shows 53.00 support daily chart Fibonacci oil daily chart and 20 MA - At 18:00 on the video the weekly oil chart is reviewed.
- The price extension support and resistance, the 20 MA 57.00 and 200 MA 52.30 (as your broad trading range) and trend lines on the weekly charting is reviewed. 53.26 price extension is serious support and price under that is an obvious short.
Know Where the Price Targets Are for the Machines.
- Discussed is the end of week and EIA price targets on the EPIC algorithm model. The algorithmic channel and quad support and resistance areas.
Preparing My Short Order Day Trade in Oil Live on Trading Room Video.
- At 20:00 on video I get my trading execution ready.
The Trade Pattern Set-up (Signal).
At 20:30 on video – When you see this pattern (trade signal) on the one minute charting model be very careful to cut your trade fast if the machines kick in the other direction (long).
Trade When Signals Are Most Predictable.
I prefer trading oil when the trend is clear and the machines are in it. Reports say over 80% of oil traders lose. This is largely why. Trade gets sloppy and then frustrates the trader.
Money in crude oil trading is made in the trend. Near resistance trading can mind mess you.
This is why I close my DWT short swing trade when we got near key resistance.
Winning is Important.
Not only is losing bad for your account but it is even more important for your mind. Your subconscious needs to know it wins. The subconscious is powerful.
Day Trading Model.
Location of trading boxes around three pivot areas of the one minute crude oil day trading chart model.
24:00 on video pivot resistance is discussed.

I am short bias to 53, 52.75 then 51.20 is possible.
Indicator Signals.
At 24:45 on the one minute you have stochastic RSI increasing and price that is basing, typically that means down next or even a possible waterfall short trade set-up.
The Risk-Reward (the Math of the Trade) On a Down-Side Break Set-up.
At 25:20 I start to discuss the math of the trade. You can take the short side trade and if price turns on you then you take a maximum cut of 16 ticks on the trade, but if price gets you on the right side and continues to confirm short then your win will be much bigger return.
Short Trade Executed – Play by Play.
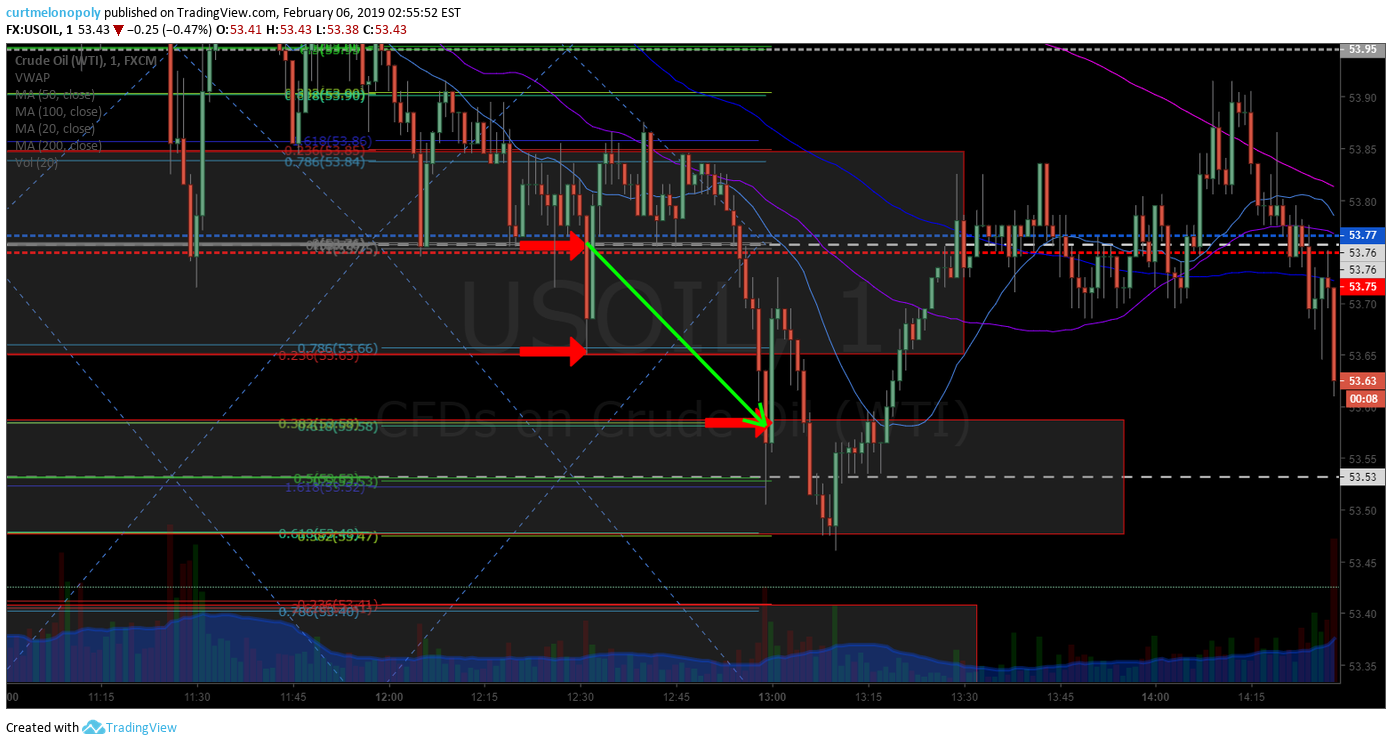
At 25:42 on the video at 53.77 my short trade execution is done live.
Location on crude oil chart of short trade entry for day trade on chart below.

Short crude oil trade alert screen shot of member Twitter alert feed is shown below at 53.77.

At 26.42 on video the buys came in at the Fibonacci support on the one minute model shown (red arrow).
At 26.50 buy side trades are testing the 20 MA resistance on 1 minute chart.
At 28:34 on video trade is over the 20 MA trading 53.83 hit resistance on the pivot on the 1 min just under 50 MA.
Indicators are turning up now. Started to look like a reversal trade but I stayed with the plan because trend on the day was down and I didn’t want to be chopped up.
Trade hit 53.87 before it turned back down (so I was 10 ticks off side at that point). Technically trade got a penny or two over trading box resistance but I held because the bulls needed to have big buys and momentum to kick in to fight the daily trend which was pressure in trade.
At 32.35 the 4 hour chart is reviewed and my target for the risk reward to down side. The reward potential was much better in my thinking.
The EPIC model confirms also.
At 33:40 the weekly chart shows a good risk reward also.
Protecting you capital is key and trading for risk reward on trend for the time frame.
30 minute candle turn timing is discussed.
The pivot test continues.
At 39:13 on the video the technical area of key support for the day trade is reviewed. 53.58 is the next Fib down so you want trade to break under that and hold under 53.58 and if it doesn’t you’re best closing the trade for a scalp. This is purely a math play. You will win 50% and win you do win you’ll either get a decent scalp or a larger 5 x risk reward win.
This is purely a math play. You will win 50% and win you do win you’ll either get a decent scalp or a larger 5 x risk reward win.
At 42:47 volatility VIX is reviewed and how I want volatility to start rising intra-day.
At 45:28 the importance of trading in a zen state vs. frustration is discussed.
At 46:00 trading on bias based on technical set-ups and protecting your capital (accepting it quickly when you are wrong) is key to trading success.
At 48.00 the inverse head and shoulders that technicians on Twitter were talking about is discussed relative to the risk reward on the 30 minute chart price target.
The price target for the short oil trade is shared in the oil trading chat room private server.

How I Knew Where to Close the Short Oil Trade for a Win.
At 53:15 on the video is top of the hour with price falling and trade was under the key support resistance 54.59 and we needed it to hold under for staying in the trade short.
The price action here on the video is important to watch close here if you want to learn how to do this.
At 57:00 on video I explain that you could short again here, I didn’t, but price did come off and it would have been a decent short trade.
Trade did not stay under resistance at pivot so I closed the oil short trade for a win.

If You Want a Win Rate 90%+ DayTrading Crude Oil – I Highly Recommend Listening to this Part of The Video – IT IS KEY.
I continue to comment on how the trade continues to set up discussing the technical areas to watch.
If you want to learn about specifically where your support and resistance areas are on the one middle model BE SURE TO WATCH THE VIDEO HERE (from 57:00 minutes on video forward).
If you watch the price action and my commentary you will see how precise the machines trade the one minute model – THIS WILL HELP YOU TIME YOUR ENTRIES AND WHEN TO CLOSE. VERY IMPORTANT.
Below is a screen shot of the oil trade alert feed – closing the trade for a win.

Below is the Trade Executed Live in Oil Trading Room.
Peace and best,
Curt
Email me with any questions you may have [email protected].
Recent Learning Posts and Videos (most are premium member locked posts).
Feb 4 – January 2019 Oil Trading Alert P/L.
Jan 31 – Day Trade Timing Strategies for Crude Oil Trade Around Time Cycles and EIA.
Jan 29 – Trading the Main Support and Resistance on EPIC Algorithm Model. How to Post.
100 Tick Move | Crude Oil Day Trading Strategies | Trade Model Support and Resistance.
Jan 27 – Premium Member Private Post (Weekly Reporting & Guidance).
Oil Trade Strategies | Day Trading Crude Oil | Premium Member Weekly Guidance.
Jan 22 – Compounding Gains Day Trading Crude Oil.
Not Just Concept: Day Trading Crude Oil 10K – 1 Million in 24 Mos at 10 Ticks Day (Compound Gains).
Jan 20 – Weekly Crude Oil Trading Strategy Guidance Private Post for Premium Members.
Oil Trade Strategy | Day Trading Crude Oil Futures | Premium Weekly Guidance.
Jan 19 – A detailed inside look at our day traders’ strategies in crude oil day trading room.
How I Day Trade Crude Oil +90% Win Rate | Friday’s 158 Tick Move | The Strategy We Used To Trade It.
If you have any questions send me a note please!
Best and peace!
Curt
PS Remember to protect capital at all cost, cut losers fast and know that when you win you really win. Use the 1 min charting model for entry timing, cut losers fast and re-enter if you have to. Do that until you learn how to be a regular win-side trader.
Further Learning:
If you would like to learn more, click here and visit our Crude Oil Trading Academy page for complimentary oil trading knowledge – posts from our top crude oil traders that includes learning systems, blog posts and videos.
Welcome to NYMEX WTI Light Sweet Crude Oil Futures.
Subscribe to Oil Trading Platform:
Standalone Oil Algorithm Newsletter (member charting sent out weekly).
Real-Time Oil Trading Alerts (Private Twitter feed).
Oil Trading Room / Algorithm Newsletter / Alert Bundle (includes weekly newsletter, trading room, charting and real-time trading alerts on Twitter).
Commercial / Institutional Multi User License (for professional trading groups).
One-on-One Trade Coaching (Via Skype or in person).
Click here to find all information and pricing on Oil Newsletter, Trading Chat Room, Oil Alerts and more.
Curtis Melonopoly (@curtmelonopoly) is rated Top 250 Stock exchanges authority, covering also Mathematical finance and Economy of the United States
Article Topics: Day Trading, Crude, Oil, How To, Trade, Oil Trading Room, Strategy, USOIL, WTI, CL_F, USO
Follow:
Oil Trading Profit/Loss Jan 2019 | +63.05% +63,049.00 41 Wins 3 Losses 93% Win Rate Large Account | Crude Oil Trade Alerts
Large Account Crude Oil Trading Alerts Profit Loss for January 2019.
January Oil Trade Profit / Loss Summary. The profit on our oil trading alerted trades is achieving excellent return for us and our alert clients.
After months of back testing on all time frames and our trading process is now getting locked in for machine trading and manually executed trading for both day trading and swing trading crude oil futures contracts. As such, we will start publishing profit loss reporting for the near term. This will be a series of documents from here forward.
About. We trade many accounts for many different reasons. We are coding software to machine trade on various rule-sets on various time-frames. We are also developing rule-sets (process driven trading) for our traders that have no intention of using our software, that prefer to execute trades manually.
Account Size, Trade Size. Below is the large account profit/loss and the follow up document to this is the small account for the same time period. The large account trades 10 contract size and the small account trades 1 contract size.
It is much more difficult to build a small crude oil futures trading account at 1 contract size than it is to trade and build on a larger 10 contract size account. The returns are significantly different. Studying the two profit/loss statements will help you understand why (small account statement will be released soon). Small accounts have to be traded differently.
Win Rate. Our win side percentage is now consistently well over 90%. Live alerted, recorded in the trading room and permanently logged in our library for members to learn our process of trade and verify, executed live in oil trading room with live voice broadcast and screen sharing with charting, and guidance discussion in the oil trading chat room server on Discord.
Returns. Is it possible to double accounts every 30 days? Review the trade alerts below and decide for yourself.
The Goal is to Provide a Winning Oil Trade Process Specific to Your Risk Threshold and Style. Currently, our focus is assisting our client members with an oil day-trading process and a swing trading process that is easy to learn, reproduce, executed manually that provides a high probability of success.
The day-trading method being used currently is on a one minute time frame chart model that also references the primary EPIC Oil Algorithm model that is a 30 minute chart model and also other time-frame models are used (such as 4 hour, daily, weekly, monthly etc) for consideration to trade size as it applies to key resistance and support areas in the trade of crude oil. Refer to our rule-set (to be published soon) and/or client reports for more detail.
The alerts below can be cross-referenced to the time of day in our oil trading discord chart server and much more learning / data gleaned. There is significant charting of models and guidance to the trades in that server. The learning trader has a massive resource to draw on by methodically studying and cross referencing the data from the alert feed, the server, videos and regular reporting circulars (that will now include rule-set modules).
Our Trade Alerts and Development of The Process is Transparent, Recorded, Time Stamped. The development of the rule-set(s), charting and guidance we provide our trading clients is transparently shared by our staff in our client private Discord oil chart server (the oil trading chat server is included in our oil trading bundle).
The trade alerts below are the whole of the alerts for the month. None have been removed. Various guidance is not included to keep the document as short as possible.
The actual trades are executed by our lead trader and/or software development staff live in our live trading room with live voice broadcast and screen share charting etc.
The oil trade alerts are deployed on a private member oil trade alert Twitter feed (the alerts are provided as a stand-alone service or as a part of the trading bundle with oil chat and weekly reporting).
The various oil trading services are detailed here (click).
Simple Risk Threshold Tool. The intent of producing a profit / loss over view (as you see below) is specifically for our clients to easily determine which method of trade (day trading, short term swing trades (intra day), swing trading, trend trading etc) best suits their trading style and goals.
As such, the profit / loss summary below uses rounded figures (derived with simplicity in mind) for each entry for ease of calculation for trading plan development. Our actual accounts include many more trades, below we only represent the trades we have alerted to our member base – we include below only that which affects the profit / loss of our member clients. Our accounts are private.
Our lead trader (our associate traders) will, at any given time, operate a variety of accounts representing compound trading, swing trading, momentum trading and testing for algorithms and more. This may or may not include cash / leverage accounts, commodity accounts, crypto exchange accounts, paper trade accounts and various algorithmic back testing and simulation accounts and shares the P&L and trade entries and exits in a transparent manner to ensure success (or lack therein) of the algorithms or trade accounts is for the purpose of trader and program development initiatives. https://compoundtrading.com/disclosure-disclaimer/
Instruments of Trade. All quotes on our trade alerts are referencing price on FX USOIL WTI and traded on continuous CL futures contracts unless otherwise noted. This is to provide our clients one charting source to refer to as there are many instruments available to trade crude oil. Our algorithm models are developed on and charted on FX USOIL WTI on Trading View (the working models).
Trade Alert Language. The letter “M” denotes a machine trade, otherwise the trade is by our lead trader manually executed. If HFT is noted in the alert, this type of trade (machine executed) can have many high frequency trades in and out of the position. We note this for clients so they are aware but we do not alert every high frequency trade as this would not help our clients on this type of platform. In the near future we will have a manner in which our clients will be able to view the machine trade high frequency trade on a digital platform live.
Trading Style of Lead Trader / Risk Threshold / Goals and Associated Returns. It is important for viewers to know that the lead trader is executing trades with the highest possible probability of win side trade with the lowest amount of risk. A review of the private oil member server discussion will quickly bring to light for any trader that anyone with a slightly higher risk threshold than our lead trader will see returns much higher. Review our feed and determine for yourself, but it is readily transparent that if a trader can accept a 10% loss for significantly higher return trades that much greater return than what you will review below is not just possible but probable – as long as you cut fast when a trade has broken down.
We are a Data Provider Primarily to Serious Retail traders and Private Trading Firms (Commercial Enterprise). We provide service to retail, commercial enterprise (private trading firms) and institutional members. The institutional and commercial enterprise clients primarily utilize our live trading room for their trade alerts. We also provide a direct alert feed for each member client at the commercial / institutional level that also includes per user licensing, training, modified charting structures, support services and more. Our retail clients use our Twitter feed, some use our Discord chat and some the live trading room. Most are subscribed to the bundle service (weekly reporting, oil trading room, Twitter feed as a bundle).
Our Trading Firm Structure. We sell data and we trade our own accounts, we do not trade a fund account of any type or manner or on behalf of anyone or any firm. We are not investment advisers, we are data providers. Many of our commercial enterprise clients do however trade on behalf of their clients or as a part of a fund arrangement. In short, they use our data (charting, alerts and soon machine learning software) to execute trades. We can refer you to any of these enterprises if you are sourcing this type of service.
Proprietary Data. Below we leave out critical direction, methods and process driven explanation as we are entering a new phase in our development. Soon (prior to end of February) we will be contracting our clients to non disclosure, non compete and other forms of contract relations to protect our membership and stake holders on whole.
Price Increases (non existing clients). Price increases will be announced before the end of February 2019. Existing member / client fees do not escalate as we develop our platform as long as the subscription does not lapse. It is our early adopter promise.
Time Zones. The time stamp on Twitter, in Discord, in Trading Room and / or on various screen shots will either be Eastern New York or one hour later (as our lead trader is currently in the Dominican Republic).
Is it possible to double accounts every 30 days – 60 days? Review the trade alerts below and decide for yourself.
Oil Trade Alert #1. High Frequency Machine Trading Alert.
Context for this trade is also on alert feed (not shown here to keep this document from being the size of a book), in the private discord oil chat room server, documented on the live trading room video (that provides more specific detail to each execution than the alert feed below that is missing execution data) and combined with lead trader alerts in alert # 2 below. The coding team advises the clients that HFT alerts are primarily for guidance because there are many trades that cannot be alerted because of the frequency (however, we are coding a digital platform for our clients to view these HFT machine executions live). So in short, until such a platform is developed and deployed the clients can use the guidance to get their trade entry and resistance / supports but not follow the frequency and exact trades. The guidance on the alert feed has been getting better as the month went on (January) and will get more specific as we move forward in time, but it will never be precise (the Twitter platform isn’t built for HFT alerting, the live trading room does work much better however). SO in short, our clients need to use HFT alerts as a guide for their own strategy. The lead trader alerts are easier for the Twitter feed alert subscriber to follow than the machine trades.
Also important to note below, the executions compiled below I have derived directly from the trade account (Jen), so there will be times that the actual execution will be a few ticks different than the alerted price on various media sources of our platform (Twitter, live trading room coverage, oil chat room server, etc). And finally, you will find in some instance data missing from the alert feed simply because the lead trader is busy, but any missing data can be verified on live video log and/or in discord chat record.
Profit / Loss Summary:
10 Contract Size
49.41 L trim 49.76 30% = 1050.00
49.41 L trim 49.73 30% = 990.00
49.41 L trim 49.71 30% = 900.00
49.41 L stopped 49.42 10 % = 10.00
Profit / Loss = 2,950.00
Live Twitter Oil Trade Alert Feed Screen Captures.
49.41 long high frequency program – machine crude oil trade alert for a high frequency program.

M – Machine program will trim 49.79 to 49.86 stops for close 49.42.

Oil Trade Alert #2. Lead Trader Alerted Long Trade. Manually Executed Trades.
Lead trader was looking for a break of resistance and a squeeze in intra-day trade as described in alert.
Profit / Loss Summary:
10 Contract Size
49.40 L trim 49.59 50% = 950.00
49.40 L trim 49.73 40% = 1320.00
49.40 L stop 49.49 10% = 90.00
Profit / Loss = 2,360.00
Live Twitter Oil Trade Alert Feed Screen Captures.
Long 49.40 for break and squeeze RR high — CURT, lead trader crude oil trade alert.

Trim 49.59 50% – CURT, lead trader oil trading alert to trim trade.

The remaining executions were alerted in the Discord chat room and live traded in trading room and recorded and available on YouTube for members.
Oil Trade Alert #3. Lead Trader Alerted Short Trade with Possible Reversal.
This short side trade alert came with an advisory that if it failed and reversed the lead trader would reverse at a certain price.
Profit / Loss Summary:
10 Contract Size
51.21 Short to 51.27 at reversal = – 600.00
51.27 Long to 51.60 = 3300.00
Profit / Loss = 2,700.00
Live Twitter Oil Trade Alert Feed Screen Captures.


Oil Trade Alert #4. Lead Trader Long Trade With Price Targets.
Trade # 4 on the month was a long alert with specific price targets at 51.87 then 52.07 from an entry at 51.67.
Profit / Loss Summary:
10 Contract Size
51.67 Long to 51.87 = 1000.00
51.67 Long to 52.06 = 1950.00
Profit / Loss = 2,950.00
Live Twitter Oil Trade Alert Feed Screen Captures.


Oil Trade Alert #5. Short Crude Oil Day Trade Alert.
Trade # 5 was a simple 20 point day trade scalp.
Profit / Loss Summary:
10 Contract Size
52.45 Short to 52.21 = 2400.00
Profit / Loss = 2,400.00
Live Twitter Oil Trade Alert Feed Screen Captures.


Oil Trade Alert #6. Short Crude Oil Day Trade Alert with Caution.
Trade # 6 was a day trade two point entry alert with a caution to be careful.
Profit / Loss Summary:
10 Contract Size (five each entry)
51.98 Short to 51.87 = 550.00
52.05 Short to 51.87 = 900.00
Profit / Loss = 1,450.00
Live Twitter Oil Trade Alert Feed Screen Captures.


Oil Trade Alert #7. Long trade with poor action, closed small profit.
Trade # 7 was quick, trade action was poor.
Profit / Loss Summary:
10 Contract Size
51.97 Long to 52.01 = 400.00
Profit / Loss = 400.00
Live Twitter Oil Trade Alert Feed Screen Captures.


Oil Trade Alert #8. Long machine driven trade alert with 50% trim and close.
Trade # 8 was a simple and clean machine traded oil alert.
Profit / Loss Summary:
10 Contract Size
51.75 Long to 52.04 = 1450.00
51.75 Long to 51.94 = 950.00
Profit / Loss = 2400.00
Live Twitter Oil Trade Alert Feed Screen Captures.


Oil Trade Alert #9, 10 and 11 on one screen capture from feed – small quick trades.
Trades on the month # 9, 10, and 11 were quick scalps intra-day while the lead trader was trying to get a direction of trade going on the day so we have included them in one screen capture below from the live Twitter oil alert feed.
Profit / Loss Summary:
10 Contract Size
52.14 Long to 52.25 =
Profit / Loss = 1100.00
51.85 Long to 51.94 =
Profit / Loss = 900.00
52.91 Long to 52.92 =
Profit / Loss = 100.00
Live Twitter Oil Trade Alert Feed Screen Captures.

Oil Trade Alert #12 was a long side trade by the lead trader.
The open long on the trade, the trim, and the closing for a winning trade is on one screen shot below.
Profit / Loss Summary:
10 Contract Size
51.25 Long to 51.43 = 850.00
51.25 Long to 51.65 = 2000.00
Profit / Loss = 2850.00
Live Twitter Oil Trade Alert Feed Screen Captures.

Oil Trade Alert #13 Short Trade in Overnight Trading.
Alert # 13 on the month was an overnight futures session trade by our lead trader to the short side. It took some time but it paid off.
Profit / Loss Summary:
10 Contract Size
51.07 Short to 50.74 = 3300.00
Profit / Loss = 3300.00
Live Twitter Oil Trade Alert Feed Screen Captures.


Oil Trade Alert #14, 15, 16. Scalp Trades.
Alert # 14, 15, 16 on the month are three trade alerts on one screen image because they were small scalp trades as lad trade was trying to find direction in oil trade intra-day.
Profit / Loss Summary:
10 Contract Size
51.15 Short to 51.13 = 200.00
51.18 Short to 51.11 = 700.00
51.90 Long to 51.93 = 300.00
Profit / Loss = 1200.00
Live Twitter Oil Trade Alert Feed Screen Captures.

Oil Trade Alert #17 and 18. Lead Trader and Machine Trading Software Reversal Trade Win.
Alert # 17 and 18 are a flurry of oil trade alerts that include a reversal for a win with lead trader and the machine trading software alerting executions also.
Profit / Loss Summary:
10 Contract Size
Lead Trader Trades Executed.
51.20 Short to 51.03 = 519.00
51.20 Short to 51.30 = – 700.00
51.30 Long to 51.53 = 690.00
51.30 Long to 51.63 = 990.00
51.30 Long to 51.66 = 1800.00
Profit / Loss = 3299.00
Machine Software Trades Executed.
51.36 Long to 51.53 = 510.00
51.36 Long to 51.56 = 600.00
51.36 Long to 51.47 = 440.00
Profit / Loss = 1550.00
Live Twitter Oil Trade Alert Feed Screen Captures.


Oil Trade Alert #19. Lead Trader Pre-market in to Regular Market Open.
Alert # 19 is a series of trade alerts for crude oil in pre-market in to regular market open.
Profit / Loss Summary:
10 Contract Size
Lead Trader Trades Executed.
Long 52.67 to 52.93 = 1300.00
Long 52.67 to 53.08 = 1200.00
Long 52.67 to 53.03 = 1080.00
Profit / Loss = 3580.00

Oil Trade Alert #20, 21, 22. Daytrading Crude Oil Alerts.
Alerts # 20, 21, 22 is a screen shot of live trade alert feed lead trader trading crude oil day trading snipes to get trend for day.
Profit / Loss Summary:
10 Contract Size
Lead Trader Trades Executed.
Long 54.02 to 54.07 = 500.00
Long 53.76 to 53.85 = 900.00
Long 53.77 to 53.87 = 1000.00
Profit / Loss = 2400.00

Oil Trade Alert #23 and 24. A Small Loss and a Day-trade Win.
Alerts # 23 and 24 The first loss on trade alerts is shown here and a small winning oil trade alert.
Profit / Loss Summary:
10 Contract Size
Lead Trader Trades Executed.
Long 53.85 to 54.00 = 1500.00
Sold 53.91 to 53.93 = – 200.00
Profit / Loss = 1300.00

Oil Trade Alert #25 and 26. Another Small Gain (flat) and a Day-trade Win.
Alerts # 25 and 26 Next on oil trade alert feed a small gain (basically flat) and a short trade winning day trade.
Profit / Loss Summary:
10 Contract Size
Lead Trader Trades Executed.
Long 54.20 to 54.21 = 100.00
Sold 52.75 to 52.66 = 270.00
Sold 52.75 to 52.60 = 600.00
Sold 52.75 to 52.59 = 480.00
Profit / Loss = 1450.00

Oil Trade Alert #27. Clean Win on this Day Trade Oil Alert.
Alert # 27 on the oil trading alert feed a lead trader clean win on a long trade.
Profit / Loss Summary:
10 Contract Size
Lead Trader Trades Executed.
Long 52.05 to 52.24 = 950.00
Long 52.05 to 52.27 = 670.00
Long 52.05 to 52.29 = 690.00
Profit / Loss = 2410.00

Oil Trade Alert #28. Clean Day Trade Win on this Alert.
# 28 trade alert is a long side upside break on 1 minute oil model our traders use.
Profit / Loss Summary:
10 Contract Size
Lead Trader Trades Executed.
Long 53.06 to 53.31 = 2500.00
Profit / Loss = 2500.00

Oil Trade Alert #29. Sniping Long Day Trade.
# 29 is a small daytrade snipe long by our lead trader on crude oil trading alert feed.
Profit / Loss Summary:
10 Contract Size
Lead Trader Trades Executed.
Long 53.13 to 53.22 = 900.00
Profit / Loss = 900.00

Oil Trade Alerts #30 and 31. Flat trades with a special report coming for the one.
# 30 and 31 – Next two alerts on the oil feed are flats and the one became high frequency (manually traded high frequency) that a special report is due out on. When the report comes out (it is an intensive video of many trades) I will link that report to this here.
Profit / Loss Summary:
10 Contract Size
Lead Trader Trades Executed.
Profit / Loss = 0

Oil Trade Alerts #32, 33, 34.
# 32, 33, 34 – Next 3 oil trades are post EIA and one is good the others are tight tests on the alert feed.
Profit / Loss Summary:
10 Contract Size
Lead Trader Trades Executed.
Long 52.96 to 52.70 = 2600.00
Long 52.71 to 52.68 = 300.00
Long 52.77 to 52.77 = 00.00
Profit / Loss = 2900.00

Oil Trade Alerts #35. Small loss on a day trade.
# 35 – This oil trade alert is for a small loss intra day.
Profit / Loss Summary:
10 Contract Size
Lead Trader Trades Executed.
Long 53.32 to 53.24 = – 800.00
Profit / Loss = – 800.00

Oil Trade Alerts #36, 37. One loss one win.
# 36 and #37 – More day trading crude oil alerts with one loss and one winning trade.
Profit / Loss Summary:
10 Contract Size
Lead Trader Trades Executed.
Long 52.12 to 52.00 = – 1200.00
Long 52.47 to 52.62 = 1500.00
Profit / Loss = 300.00

Oil Trade Alert #38. Two daytrade wins.
# 38 Next are two long daytrade oil alerts both winning trades for snipe trades.
Profit / Loss Summary:
10 Contract Size
Lead Trader Trades Executed.
Long 52.72 to 52.84 = 600.00
Long 52.72 to 52.88 = 900.00
Long 52.88 to 53 = 1200.00
Profit / Loss = 2700.00

Oil Trade Alert #39. Nice win.
# 39 This was an excellent crude oil day trade alert for a nice win. Screen shot.
Profit / Loss Summary:
10 Contract Size
Lead Trader Trades Executed.
Long 53.32 to 53.41 = 270.00
Long 53.32 to 53.50 = 1260.00
Profit / Loss = 1530.00

Oil Trade Alert #40. Clean Day Trade on the Model.
# 40 Another winning oil trade alert. Nice simple gains on intra day trading of the model.
Profit / Loss Summary:
10 Contract Size
Lead Trader Trades Executed.
Long 53.59 to 53.75 = 800.00
Long 53.59 to 53.91 = 1600.00
Profit / Loss = 2400.00

Oil Trade Alert #41. Small win.
# 41 Next trade on alert feed is a small snipe intra day.
Profit / Loss Summary:
10 Contract Size
Lead Trader Trades Executed.
Long 54.24 to 54.29 = 500.00
Profit / Loss = 500.00

Oil Trade Alert #42, 43, 44. $XOM Earnings Win, DWT Short Swing Trade Win, Daytrade Win.
# 42, 43, 44 – The next 3 alerts are $XOM long in to earnings that went exceptionally well, DWT close short swing (nearly doubled), long day trade crude oil.
Profit / Loss Summary:
10 Contract Size
Lead Trader Trades Executed.
Long 55.00 to 55.23 = 1150.00
Long 55.00 to 55.22 = 1100.00
Profit / Loss = 2250.00
Short DWT 13.55 to 8.73 @ 1000 = 4820.00
Profit / Loss = 4820.00
Short DWT 13.55 to 8.73 closed, nice trade and it followed the plan for the price target. #swingtrading #crudeoil #OOTT $CL_F $USO $WTI $UWT $DWT
Short DWT 13.55 to 8.73 closed, nice trade and it followed the plan for the price target. #swingtrading #crudeoil #OOTT $CL_F $USO $WTI $UWT $DWT pic.twitter.com/Uhw4eRs2Jn
— Melonopoly (@curtmelonopoly) January 31, 2019
$XOM long 72.60 Thurs in to earnings, Fri HOD 76.49, Closed Session Fri 75.92. #swingtrading #earnings #OOTT #Oil #Gas #TradeAlerts
$XOM long 72.60 Thurs in to earnings, Fri HOD 76.49, Closed Session Fri 75.92. #swingtrading #earnings #OOTT #Oil #Gas #TradeAlerts pic.twitter.com/rniElaV24G
— Melonopoly (@curtmelonopoly) February 2, 2019

Remember, for each of these trade there is a process. This process can be learned, reproduced and executed at will. We have a video library on YouTube, private oil chat room on Discord, live trading room, live alert feeds and numerous reports that come out regularly.
There is no fluke in this winning process. It is very systematic and predictable. All you have to do is put the time in to it to study it and practice it and reap the reward. We have done the heavy lifting in advance for you.
Conclusion.
One Month Statistics:
Trade Account Increase = +63.05%
Trade Account Profit = $63,049.00
Wins = 41
Losses = 3
Win rate = 93%
Subscribe to Oil Trading Platform:
Standalone Oil Algorithm Newsletter (member charting sent out weekly).
Real-Time Oil Trading Alerts (Private Twitter feed).
Oil Trading Room / Algorithm Newsletter / Alert Bundle (includes weekly newsletter, trading room, charting and real-time trading alerts on Twitter).
Commercial / Institutional Multi User License (for professional trading groups).
One-on-One Trade Coaching (Via Skype or in person).
Click here to find all information and pricing on Oil Newsletter, Trading Chat Room, Oil Alerts and more.
Curtis Melonopoly (@curtmelonopoly) is rated Top 250 Stock exchanges authority, covering also Mathematical finance and Economy of the United States
Article Topics: Crude, Oil, Trade, Trading, Alerts, Profit, Loss, Futures, USOIL, WTI, CL_F, USO
Follow:
Trading Strategy for Crude Oil Futures | Video | Intra-Day Timing, EIA, Time Cycle, Model Resistance & Support
Crude Oil Day Trade Strategies (Live Video from Oil Trading Room with Alerts) for EIA, Market Open, Model Resistance, Time Cycles.
This video does not have any high flying trades, what it does have is important lessons for day trading crude oil and understanding how to use the oil trading models to your advantage. It also discusses in detail the time cycles and what to expect in trade action.
#oil #trading #strategies
Voice broadcast starts at 13:30 on oil trading room video.
January 30, 2019 Oil Trading Room Live Session Summary Notes.
13:30 premarket for regular market open comments about important resistance on EPIC Algorithm model and where trade should settle intra-day (at top of quad or mid quad) in advance of EIA petroleum report at 10:30.
14:30 comment to not buying the “pop” in price as I expected crude oil trade to calm in advance of EIA report timing. The resistance hidden pivot (yellow horizontal line on chart) is discussed.
15:00 Comments toward time cycle inflection on global markets (including crude oil) over next 3 or 4 days is discussed. We could inflect up or down on other side of time cycle peak. 55s is very possible (even a blow off in to 56 is possible) as an inflection up over next few days and a double extension up could happen. Time cycle in to mid May 2019 is the main pocket of trade sizing timing. See special report guidance in to May 2019 for crude oil.
Time cycle from end of Dec to now was difficult to trade with swing trade sizing but the next time cycle I can’t miss (the one starting in next few days in to mid May).
18:40 looking for whether price trade can get above pivot and structure a base for a trade on the model.
At 37:37 I comment to stagnant trade not being a surprise in to EIA and that I was looking for a slight short 20 to 30 points in to EIA. Trading 54.00 intra-day.
By 1:13:37 on oil trading room video you can see price did come off as expected.
At 1:17:30 EIA is in just under a minute. The model support and resistance is explained.
1:18:40 the one minute model has resistance in trade just over-head (chart not shown).
1:19:20 I announce the EIA petroleum report results and comment that generally trade should be bullish. At 1:20:00 price hits near top of quad.
For a number of weeks we’ve been targeting 55s Jan 31 to Feb 3 so this could be what finishes the trajectory on that time cycle peak.
Screen capture of oil trading room… “could be final move in to 55s if open is strong.”

1:21:40 I am long at 54.24 for a trade above 1 minute support and EPIC model support. Test size trade long crude oil.
EPIC Crude Oil Trade Alert feed screen capture showing trade alerts for trade on the day. You can see that earlier in the day in overnight futures trade that I was actively trading for decent profit.

Resistance 54.32 is noted as key resistance for the trade and the top of the quad and a comment to not getting to excited because of the various resistance points nearby.
1:23:27 we get a touch to the resistance. The test of resistance is commented to. 54.59 upside price target discussed if resistance is breached. Price did in fact hit that on the day later.
Resistance at mid point of trading box on the 1 minute model is discussed. At 1:26:00 on video I close the trade for a small gain at 54.29. Wasn’t interested in dealing with the resistance.
Remember at this point I am still holding DWT short from a number of days ago. The entry short was 13.57 and it hit 8s intra-day. Hoping for 7s before closing.
1:28:15 I show on the model the upside scenario and channel resistance being likely.
1:28:40 I discuss the recent sell off in crude oil in to 41s and our call to 55s in to this time cycle peak is discussed and why this area of trade is low risk reward. Also discussed is the type of trade action to expect in to the peak of the cycle in to Jan 31 – Feb 3.
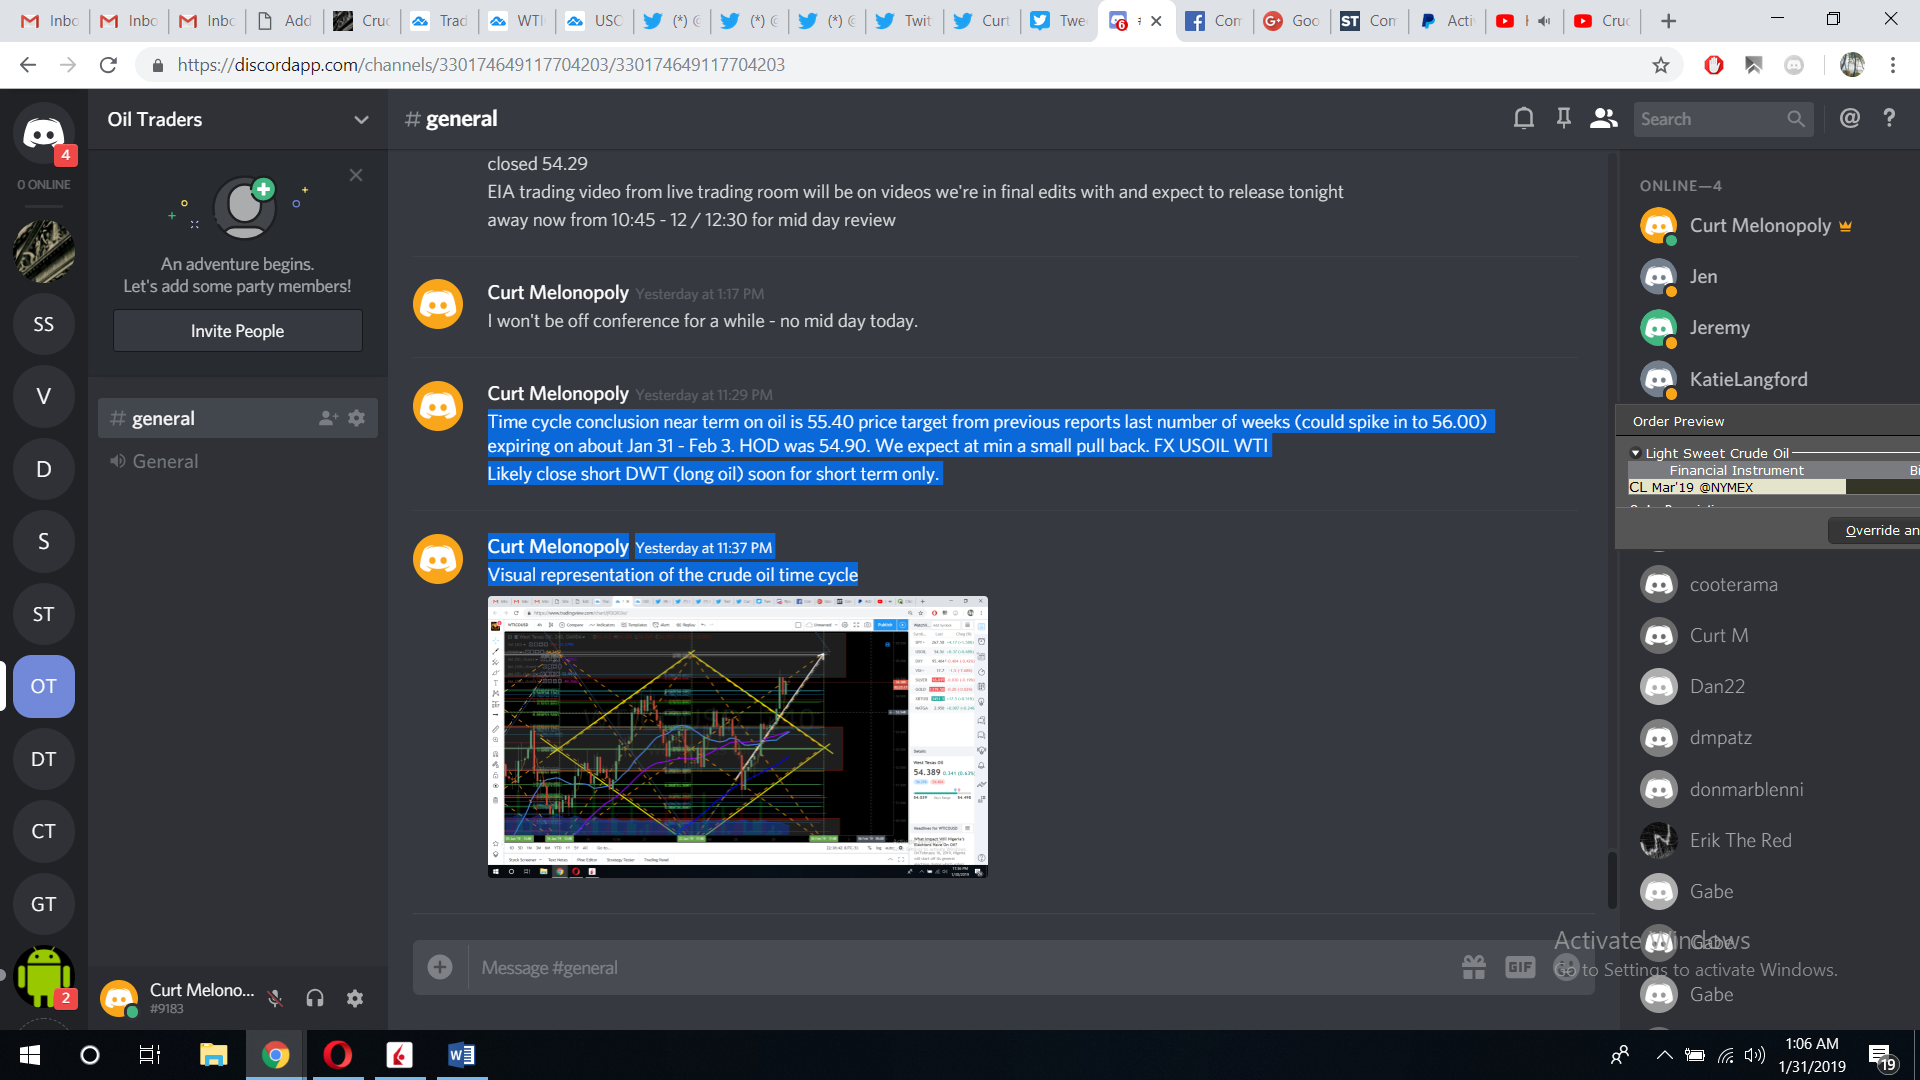
Later in day I reiterate the time cycle peak in crude oil with price target guidance and visual representation of the time cycle and price target on oil chart model for our member strategy.
Time cycle conclusion near term on oil is 55.40 price target from previous reports last number of weeks (could spike in to 56.00) expiring on about Jan 31 – Feb 3. HOD was 54.90. We expect at min a small pull back. FX USOIL WTI
Likely close short DWT (long oil) soon for short term only.
Curt Melonopoly Yesterday at 11:37 PM
Visual representation of the crude oil time cycle
Screen capture from oil trading chat room discussing trading strategies for time cycle peak and price target.

THE TAKEAWAYS – Main Oil Trading Strategies Learned on Video:
Just because oil was bullish in to the market open and normally that would mean a buy trigger – it doesn’t always mean buy.
– In this instance it was Wednesday and the timing of EIA coming in one hour after open had me hold off my long trade because trade normally softens in advance of EIA. Bulls and bears stand-off. Also, there was a key pivot resistance on the oil chart model in play. For these reasons and more the trade set-up was not ideal for risk reward. It wasn’t a high probability long trade.
– Know your resistance and support when trading and get out quick when resistance becomes real like with my EIA trade on this video.
It is highly recommended you review recent reporting, discord room chat (regular guidance is posted in the oil chat room private server) and the various videos that are released on a regular basis.
Recent Learning Posts and Videos (most are premium member locked posts).
Jan 29 – Trading the Main Support and Resistance on EPIC Algorithm Model. How to Post.
100 Tick Move | Crude Oil Day Trading Strategies | Trade Model Support and Resistance.
Jan 27 – Premium Member Private Post (Weekly Reporting & Guidance).
Oil Trade Strategies | Day Trading Crude Oil | Premium Member Weekly Guidance.
Jan 22 – Compounding Gains Day trading Crude Oil.
Not Just Concept: Day Trading Crude Oil 10K – 1 Million in 24 Mos at 10 Ticks Day (Compound Gains).
Jan 20 – Weekly Crude Oil Trading Strategy Guidance Private Post for Premium Members.
Oil Trade Strategy | Day Trading Crude Oil Futures | Premium Weekly Guidance.
Jan 19 – A detailed inside look at our day traders’ strategies in crude oil day trading room.
How I Day Trade Crude Oil +90% Win Rate | Friday’s 158 Tick Move | The Strategy We Used To Trade It.
Jan 18 – By far one of the most important videos for day trading crude oil since our inception;
How I Day Trade Crude Oil on One Minute Chart | Trading Signals | Alerts (with video).
Jan 14 – Oil day traders need to see this article;
Crude Oil Day Trading Strategy | Oil Trading Room Video | Lead Trader Guidance.
If you have any questions send me a note please!
Best and peace!
Curt
PS Remember to protect capital at all cost, cut losers fast and know that when you win you really win. Use the 1 min charting model for entry timing, cut losers fast and re-enter if you have to. Do that until you learn how to be a regular win-side trader.
Further Learning:
If you would like to learn more, click here and visit our Crude Oil Trading Academy page for complimentary oil trading knowledge – posts from our top crude oil traders that includes learning systems, blog posts and videos.
Welcome to NYMEX WTI Light Sweet Crude Oil Futures.
Subscribe to Oil Trading Platform:
Standalone Oil Algorithm Newsletter (member charting sent out weekly).
Real-Time Oil Trading Alerts (Private Twitter feed).
Oil Trading Room / Algorithm Newsletter / Alert Bundle (includes weekly newsletter, trading room, charting and real-time trading alerts on Twitter).
Commercial / Institutional Multi User License (for professional trading groups).
One-on-One Trade Coaching (Via Skype or in person).
Click here to find all information and pricing on Oil Newsletter, Trading Chat Room, Oil Alerts and more.
Curtis Melonopoly (@curtmelonopoly) is rated Top 250 Stock exchanges authority, covering also Mathematical finance and Economy of the United States
Article Topics: Day Trading, Crude, Oil, Futures, Oil Trading Room, Strategy, Price Targets, Time Cycles, USOIL, WTI, CL_F, USO
Follow: