Skip to content

Compound Trading Group

  • About
  • White Paper
  • Returns
  • News
    • NOTICE of Online Information Meetings
  • Order
    • Terms
  • About
  • White Paper
  • Returns
  • News
    • NOTICE of Online Information Meetings
  • Order
    • Terms

Tag Archives: Strategy

  1.   »  
  2. Tag Archives: Strategy

Tag: Strategy

Trading Strategies: Crude Oil WTI USOIL, Bitcoin BTC, SP500 SPY, Volatility VIX, Arrowhead ARWR …

Trading Strategies: Crude Oil WTI USOIL, Bitcoin BTC, SP500 SPY, Volatility VIX, Arrowhead ARWR …

November 29, 2018February 5, 2019 Curt MelonopolySwing Trading, Trading Plan$ARWR, $BTC, $CL_F, $USOIL, $WTI, BITCOIN, Crude, DWT, Oil, SP500, SPY, Strategy, Trade Alerts, TVIX, VIX, Volatility

Trading Strategy Webinar Hosted Nov 28, 2018 with Trade Alerts and Charting

Audio starts at 3:58 on video.

Quick trade strategy review for crude oil, Bitcoin, SP500, Volatility and ARWR trades.

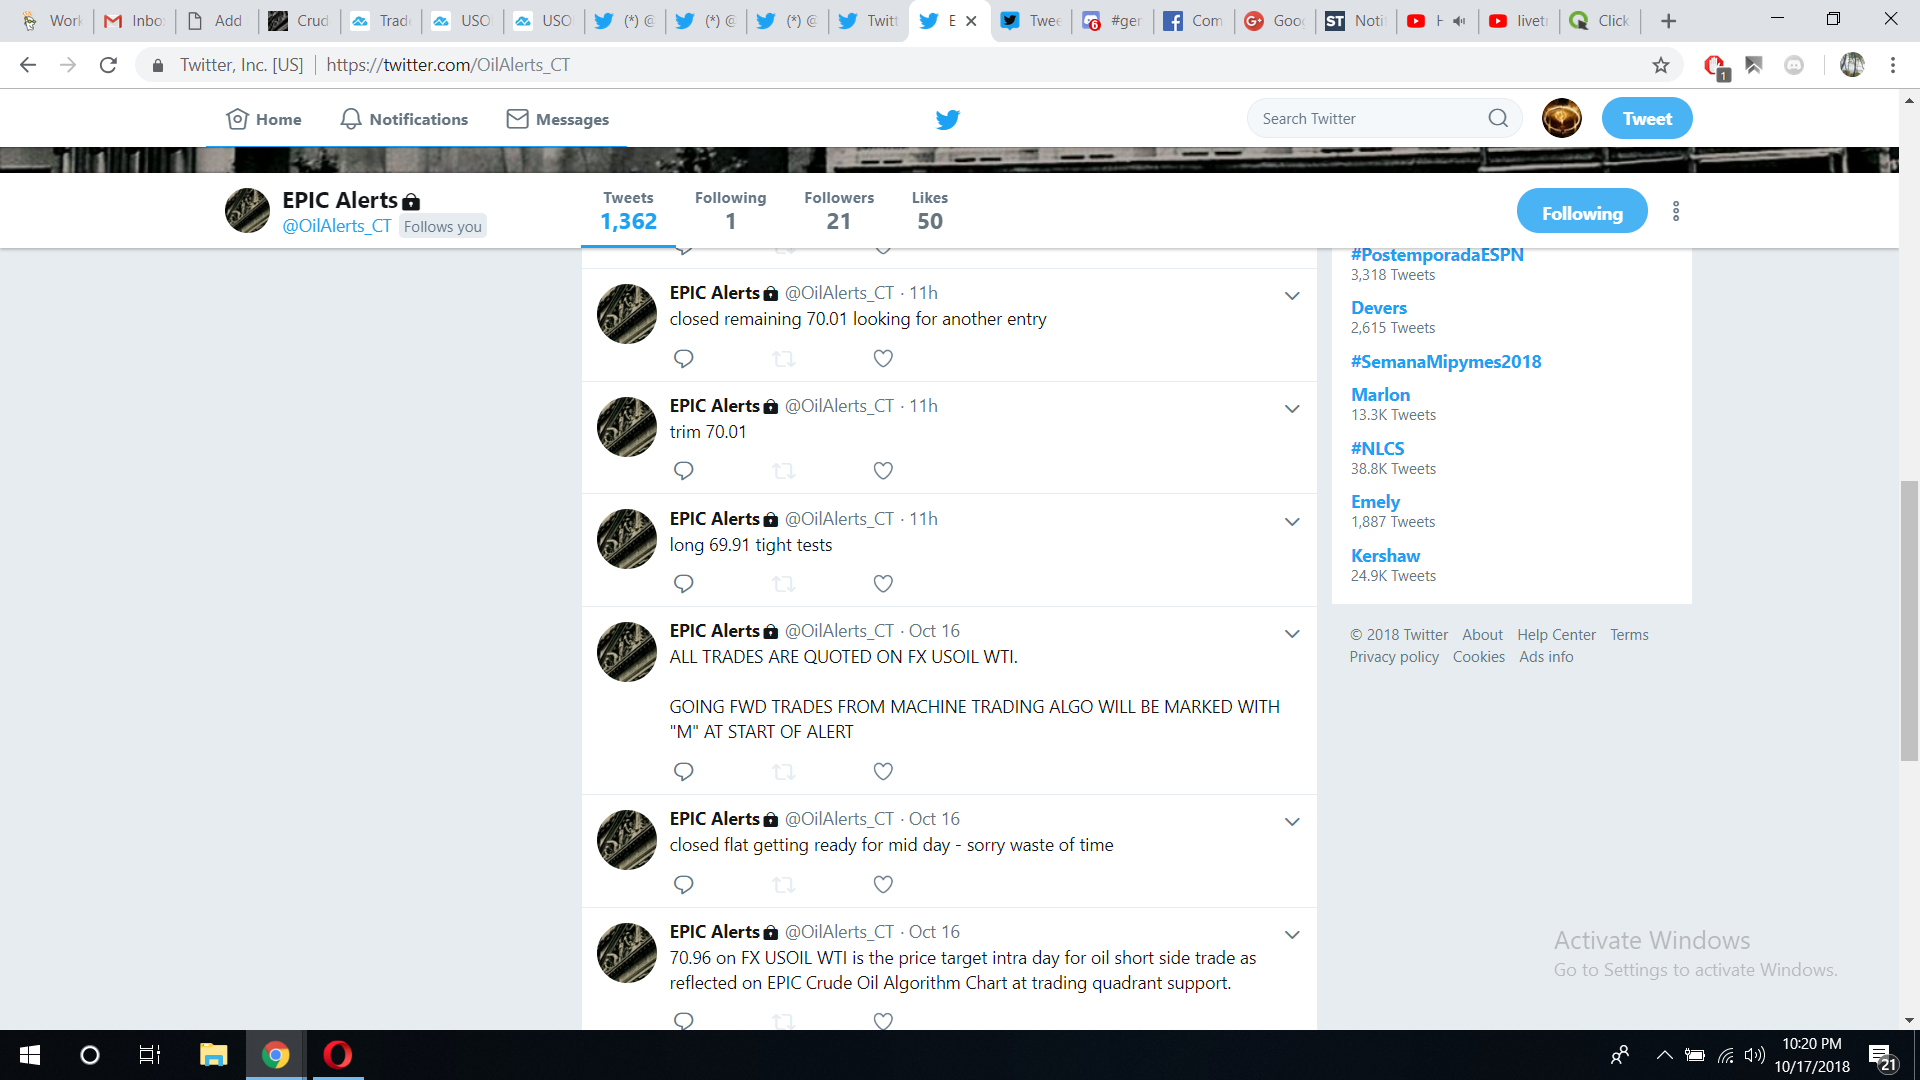
Short $DWT starter position 13.59 trading intra day 13.05 with price target 8.62. We will see how it goes. Trading 13.03 intra-day. Looking for a snap back trade to upside in crude to 50% of recent sell-off.

Daily chart resistance 52.15 area.

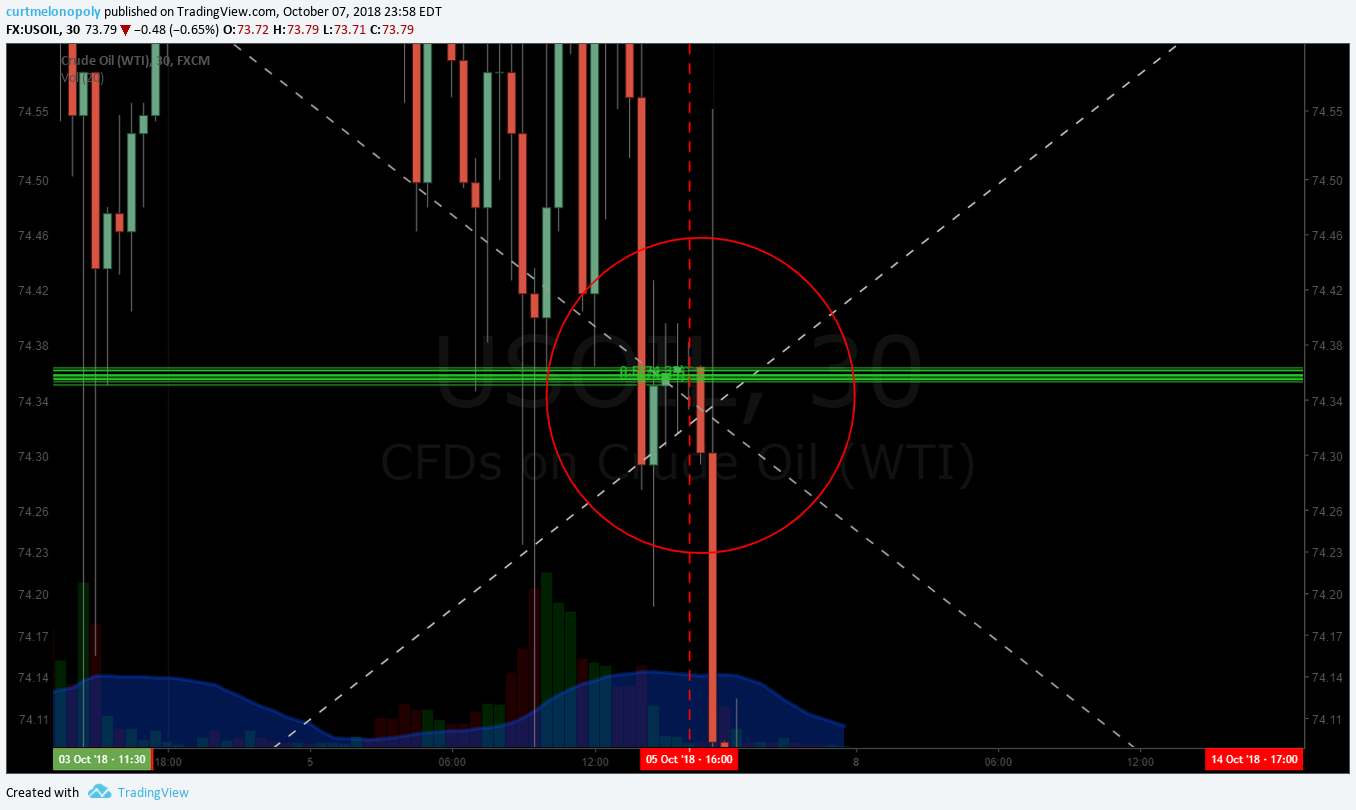
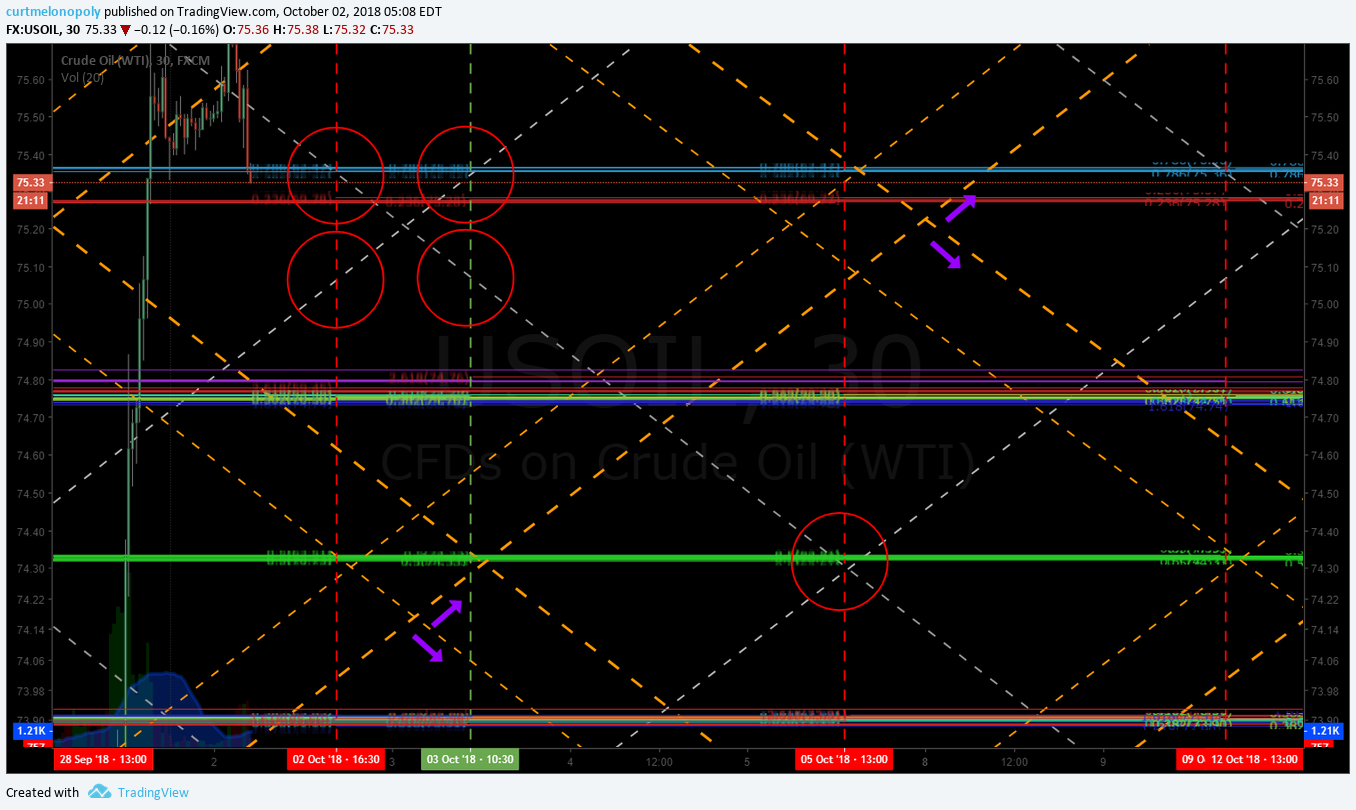
In overnight trade now oil is off trading 49.77 on USOIL WTI at 4:50 AM Eastern. The small bounce so far in overnight after the sell off was at trend-line support on the spigot chart our coders are using for legging in to trade sizing.

As for this starter position short $DWT, holding for now, it is a small position so far. Putin is supportive of Saudi Arabia and if there is a cut in production oil will turn up fast. I’m not marrying the trade either way.

Intra day you could short at top of quad area with 52.40 – .50 resistance.

8:25 Bitcoin BTC – we are looking for a turn in to Christmas being aware of the road bump in market time cycles that has a volatility time cycle (monthly) coming due Dec 5. On Bitcoin we are watching the trend-line chart resistance.

9:23 SP500 $SPY – looking for a possible long SPY in to Dec 20 time cycle peak, however, there is a smaller time cycle peak in VIX on Dec 5 we have to avoid, if that wasn’t there we’d already be long SPY. At this point we are watching.

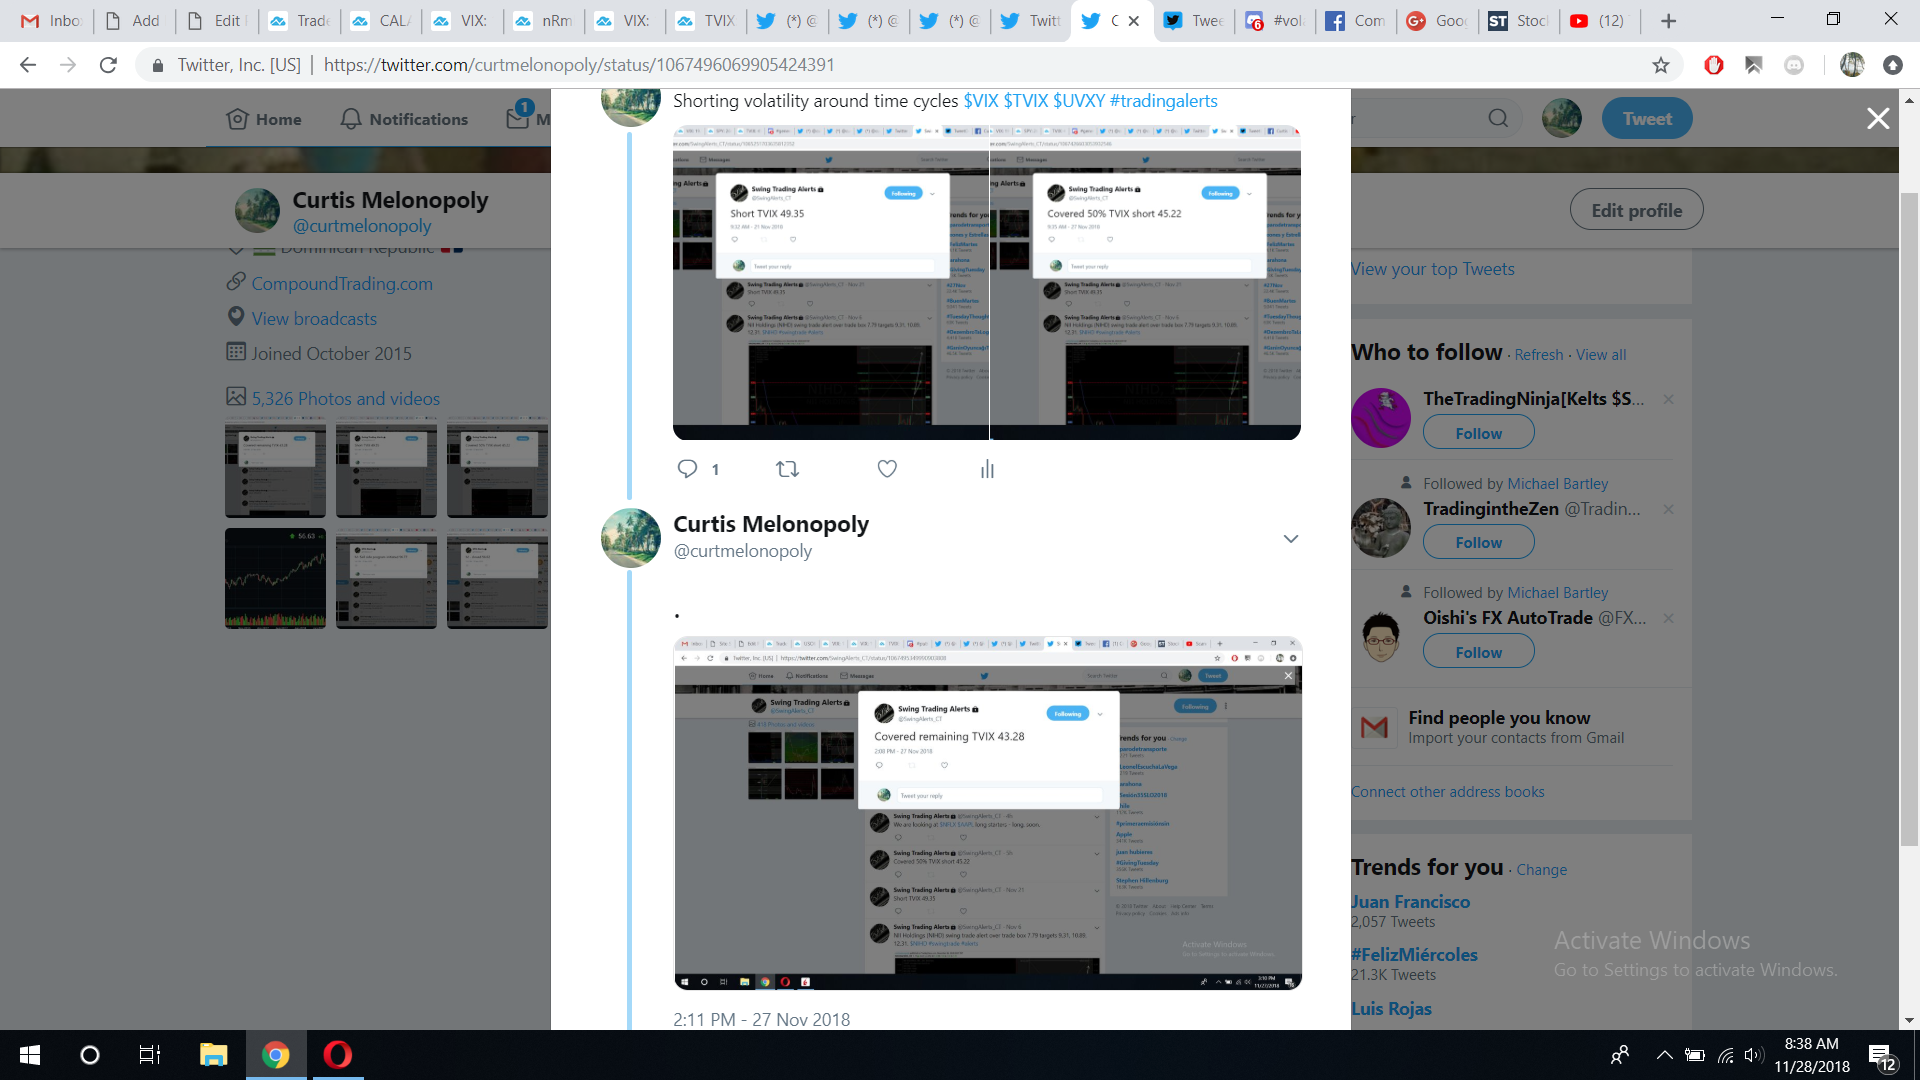
10:43 Volatility $VIX $UVXY $TVIX We covered our volatility short. Went short TVIX 49.35 covered 50% 45.22 and the remaining at 43.28. Watching support near on VIX at 50 MA (20, 100, 200 also under price) and lower Bollinger bands. Will likely be long in to Dec 5 time VIX specific cycle and short thereafter in to Dec 20 SPY time cycle peak.

11:10 ARROWHEAD $ARWR Last number of days has seen a bounce off the 200 MA, we are monitoring our initial position long.

There is a swing trading report due out today.

Thursday Mid day I will review many swing trades (pending market conditions). We expect to enter most swing trades between now and Tuesday next week. End of day Friday and pre-market is typical for me.

Thanks.

Read More

Protected: Gold Algorithm Trade Report (Rosie) Fri Nov 16 $GC_F $XAUUSD $GLD $GDX $NUGT $DUST

November 16, 2018 RosietheAlgo GLDRosie the Gold Algo Chart Report$DGLD, $DUST, $GDX, $JDST, $JNUG, $NUGT, $UGLD, $XAUUSD, Algorithm, Chart, GLD, Gold, Miners, Strategy, Trading

This content is password protected. To view it please enter your password below:

Read More
The Best Crude Oil Day Trading Signal Available | It Happened Again Today for 153 Tick Gain Intra-Day.

The Best Crude Oil Day Trading Signal Available | It Happened Again Today for 153 Tick Gain Intra-Day.

October 30, 2018November 7, 2018 Curt MelonopolyCrude Oil Trading Strategy$CL_F, $USO, $USOIL, $WTI, Best, Crude, Day-trading, Oil, Signals, Strategy

Yes, You Read That Right, This Crude Oil Signal Sees 153 Tick Day Trade Win in Crude Oil.

And the best part – it is a winning alert signal approximately 90% of the time. Back-tested and proven.

You can investigate the validity of my claim by studying our oil newsletter (algorithm model posts) – we make them public – they are unlocked historically).

On my last crude oil trading strategy report two days ago (October 28) I wrote;

“I wouldn’t be surprised at this point to see a bounce in price, however, the weekly wedge support now becomes resistance. If price breaches the previous support (now resistance) then trades should be ready for a retest of previous support before possible higher”.

Today there was an intra-day 153 tick move in trade of crude oil for a fantastic day trading set-up. The signals on the algorithm model were very clear.

Unfortunately for us I was in a business conference meeting and our tech (Jeremy) was on a conference with a broker programming one of the last Python API’s for the machine trading platform – we didn’t execute on the signal for a trade.

But that doesn’t mean we didn’t know the set-up was in play.

The oil trading algorithm report explains this very set-up in detail (members receive the report weekly) and the set-up was signaled to members in the oil trading room.

Rich (a long time member at Compound Trading) at 9:39 AM alerted the crude oil trade signal for the day-trade long in the oil trading room on Discord.

Below is a snap-shot (screen shot) of the chat in the oil chat room.

crude, oil, trade, alert, signal, trading room
Rich (a long time member at Compound Trading) at 939 AM alerted crude oil trade signal day-trade in oil trading room.

Here’s how the trade set-up was in play:

Crude oil sold off heavy in to open. It then sells off through the quadrant support on the oil algorithm but in to the main swing trading support range on the algorithm. Oil trade bottomed at 65.31 of FX USOIL WTI at 9:15 AM (white arrow on chart below).

On the 1 minute chart below at 10:46 AM trade pops (green arrow on chart) out of tight consolidation (after popping at support on the model) and runs to a high of day at 12:07 PM to 66.84.

Rich’s signal alert above in the oil chat room was for trade to hit 67.10 by Wednesday morning (at time of writing it is late Tuesday night and that target hasn’t hit yet but is very possible at the time he quoted possible for tomorrow morning).

crude, oil, sell-off, open
Crude oil sells off in to open, bottoms 65.31 915 AM, 1046 AM pops out of consolidation, high of day 1207 PM 66.84 #crudeoil #trading

Crude oil trade high of day was 66.84 at 12:07 PM near trend-line resistance on 1 minute oil chart for a 153 tick gain – what a daytrade!

crude, oil, chart, HOD
Crude oil high of day 66.84 1207 PM near trendline on 1 minute oil chart. #crude #oil #trading

Above were two conventional one minute oil charts to show you what happened on the day. Below are screen shots of the oil algorithm and how clear the signals were for the trade.

Crude oil trade touches main swing trading support on EPIC Crude Oil Trading Algorithm and bounces (gray thick horizontal line on the chart and yellow arrow).

crude, oil, algorithm, support, trade
Crude oil trade touches main swing trading support on EPIC Crude Oil Trading Algorithm and bounces #crude #oil #algorithm #trading

The next day-trading signal and further confirmation for a long position on the day was the 10:30 AM 30 minute candle when trade bounced perfect off the machine trading support line (yellow diagonal line on chart and green arrow).

intraday, oil, trade, support
The next daytrading signal was the 1030 AM 30 minute candle bounced perfect off machine trading support line.

Then the signal to close the long crude oil day-trade was much clearer and precise – it was when the price of crude oil hit the key intra-day resistance on the EPIC Crude Oil Algorithm charting highlighted with a red arrow on the chart below.

daytrade, crude, oil, signal, close
The signal to close the long crude oil daytrade was when price hit the key intraday resistance on EPIC Crude Oil Algorithm. #daytrading #crude #oil

As in the previous report I continue in this bias, “until there is a bounce, retrace and confirmed reversal the bias is short at resistance. The opposite will be true when a reversal is confirmed”. 

But nothing beats this best of class trade signal for crude oil traders (I repeat from my previous post);

“Bottom line, the EPIC Crude Oil Algorithm continues to reward those that take long positions at support (channel support and quad support) and short at resistance areas of the algorithmic trading model. This will be my focus and I know the machine trading tech(s) will be focused primarily to those areas of trade also”.

Our oil algorithm is now near two years old and has proven time and time again that it provides the most predictable oil trading signals I have been able to find on the market, and this specific signal (outlined in this article) is the most predictable best crude oil signal of them all.

Where can you find a trading set-up that executes for a win at 150+ ticks intra-day in crude oil trade with a probability of approximately 90%? Test it and tell me I’m wrong.

One trade a month pays 1500.00 per month at 1 oil futures contract size.

Follow this link for a detailed description of my longer term crude oil trading strategy review at this post.

Increase Your Crude Oil Trading With These Tools.

  • There is a link below to our oil trading academy page that has a number of links to articles on our site,.
  • You can book private online trade coaching via Skype.
  • Join our live trading room.
  • Sign on to our oil trading alert feed subscription, (alerts are on a private member Twitter feed).
  • Sign on to our weekly algorithm reporting that provides the algorithm model, conventional charting, guidance for the week etc.
  • Attend a trading boot camp (in person or online).
  • Request via email the videos of our most recent trading boot camp or the master class series videos (both sets are approximately 20 hours each). They are available only by email request at this time by emailing info@compoundtrading.com. Soon they will be posted to our shop on website.

Thanks

Curt

Any questions let me know!

Further Reading to Help You Trade Oil:

Find more posts like this one on our Oil Trading Academy Page – links to numerous oil trade strategy reports.

Welcome to NYMEX WTI Light Sweet Crude Oil Futures.

Subscribe to Our Oil Trading Platform:

Standalone Oil Algorithm Newsletter (member charting sent out weekly).

Real-Time Oil Trading Alerts (Private Twitter feed).

Oil Trading Room / Algorithm Newsletter / Alert Bundle (includes weekly newsletter, trading room, charting and real-time trading alerts on Twitter).

Commercial / Institutional Multi User License (for professional trading groups).

One-on-One Trade Coaching (Via Skype or in person).

Click here to find all information and pricing on Oil Newsletter, Trading Chat Room, Oil Alerts and more.

Curtis Melonopoly (@curtmelonopoly) is rated Top 250 Stock exchanges authority, covering also Mathematical finance and Economy of the United States

Article Topics: Best, Crude, Oil, Day Trading, Signals, Strategy, USOIL, WTI, CL_F, USO

Follow:

Tweets by EPICtheAlgo

Read More
Crude Oil Trading Strategy | Technical Analysis & Guidance

Crude Oil Trading Strategy | Technical Analysis & Guidance

October 28, 2018February 5, 2019 Curt MelonopolyCrude Oil Trading StrategyAlerts, analysis, Crude, Oil, Strategy, Technical, Trading, Trading Room

A Quick Article With Charting for my Oil Trading Strategies for the Week.

Continued sell-off last week seen oil trade below the multi – week uptrend and trade dropped below support on the weekly wedge chart that I have been sharing.

I wouldn’t be surprised at this point to see a bounce in price, however, the weekly wedge support now becomes resistance. If price breaches the previous support (now resistance) then trades should be ready for a retest of previous support before possible higher.

crude, oil, weekly, chart
Continued sell-off last week seen oil trade below the multi – week uptrend and trade dropped below support on the weekly wedge chart that I have been sharing.

On the monthly oil chart, price ended the week near the 200 MA support within range of recent monthly candles. Watch the support area.

crude, oil, monthly, chart
On the monthly oil chart, price ended the week near the 200 MA support within range of recent monthly candles. Watch the support area.

On the one minute crude oil chart in late trade Friday there were wild price swings (some reporting sweepers, specifically in $XOP). This could be an attempt to a floor in price by a hedge fund or other large money pool.

crude, oil, sweepers
On the one minute crude oil chart in late trade Friday there were wild price swings (some reporting sweepers, specifically in $XOP).

On the daily chart price ended the week right above the 200 MA and above the primary pivot marked on the chart. The MACD is nearing a bottom to FYI.

crude, oil, daily, chart
On the daily chart price ended the week right above the 200 MA and above the primary pivot marked on the chart.

On the 4 hour crude oil chart we are using as a test model for trimming and adding to positions trade ended near resistance. This is an untested non back tested chart.

crude, oil, chart, support, resistance
On the 4 hour crude oil chart we are using as a test model for trimming and adding to positions trade ended near resistance.

On the weekly pivot charting trade was working near support as with other charts.

crude, oil, pivot, charting
On the weekly pivot charting trade was working near support as with other charts.

Bottom line, the EPIC Crude Oil Algorithm continues to reward those that take long positions at support (channel support and quad support) and short at resistance areas of the algorithmic trading model. This will be my focus and I know the machine trading tech(s) will be focused primarily to those areas of trade also.

Until there is a bounce, retrace and confirmed reversal the bias is short at resistance. The opposite will be true when a reversal is confirmed. 

“Bottom line, the EPIC Crude Oil Algorithm continues to reward…”

crude, oil, algorithm
Bottom line, the EPIC Oil Algorithm continues to reward those that take long positions at support

The machine trade crude oil alert from last week was perfect to the penny at an intra-day top – I would expect the machine trading alerts to increase in intensity this week.

crude, oil, trade, alert
Machine trade in oil top tick hit perfect 67.62 to penny HOD, trimmed added numerous all win side and closed 90% 66.83. Nice trade.

I’ll be in the oil trading room most of the week as I expect a big week in oil trade with the test areas in play.

Follow this link for a detailed description of my longer term crude oil trading strategy review at this post.

Increase Your Crude Oil Trading With These Tools.

  • There is a link below to our oil trading academy page that has a number of links to articles on our site,.
  • You can book private online trade coaching via Skype.
  • Join our live trading room.
  • Sign on to our oil trading alert feed subscription, (alerts are on a private member Twitter feed).
  • Sign on to our weekly algorithm reporting that provides the algorithm model, conventional charting, guidance for the week etc.
  • Attend a trading boot camp (in person or online).
  • Request via email the videos of our most recent trading boot camp or the master class series videos (both sets are approximately 20 hours each). They are available only by email request at this time by emailing info@compoundtrading.com. Soon they will be posted to our shop on website.

Thanks

Curt

Any questions let me know!

Further Reading to Help You Trade Oil:

Find more posts like this one on our Oil Trading Academy Page – links to numerous oil trade strategy reports.

Welcome to NYMEX WTI Light Sweet Crude Oil Futures.

Subscribe to Our Oil Trading Platform:

Standalone Oil Algorithm Newsletter (member charting sent out weekly).

Real-Time Oil Trading Alerts (Private Twitter feed).

Oil Trading Room / Algorithm Newsletter / Alert Bundle (includes weekly newsletter, trading room, charting and real-time trading alerts on Twitter).

Commercial / Institutional Multi User License (for professional trading groups).

One-on-One Trade Coaching (Via Skype or in person).

Click here to find all information and pricing on Oil Newsletter, Trading Chat Room, Oil Alerts and more.

Curtis Melonopoly (@curtmelonopoly) is rated Top 250 Stock exchanges authority, covering also Mathematical finance and Economy of the United States

Article Topics: Crude, Oil, Trading, Strategy, Technical, Analysis, Alerts, Trading Room, USOIL, WTI, CL_F, USO

Follow:

Tweets by EPICtheAlgo


Read More
Crude Oil Trading Strategy: Career Trade Set-Up. Technical Analysis Trading Room w/ Video

Crude Oil Trading Strategy: Career Trade Set-Up. Technical Analysis Trading Room w/ Video

October 23, 2018February 5, 2019 Curt MelonopolyCrude Oil Trading StrategyAlerts, analysis, Crude, Oil, room, Strategy, Technical, Trading, Trading Room

A Career Trade In Crude Oil Is Setting Up. My Personal Oil Trading Strategy Near Term.

This article reviews the oil trade technical set-ups reviewed Monday in the Oil Trading Room for the near term, intra-day (daytrading), swing trading and my thesis (strategy) for a career trade setting up.

With mid-term elections near, President Trump wanting the price of oil lower (economy related), the recent Saudi geopolitical problems and other geopolitical pressure it seems a perfect storm for oil shorts is brewing.

It is my thesis that there is a very real possibility that shorts will get caught (as mid term elections near or shortly thereafter) and the price of crude oil could rebound out of the pressure and run in to early 2019 in a bullish fashion.

If that doesn’t happen I’ll follow the trend down and provide our members with the technical analysis for the scenario, but I think shorts are going to get caught on wrong side of the trade in to 2019.

#Crude #Oil #Trading #Strategy FX: $USOIL $WTI $CL_F $USO 

Oil Trading Room Video – Technical Analysis of Oil Trade Strategies Near Term and in to Next Six Months.

Voice broadcast starts at 2:30 on video.

Summary of Video Transcript – Lead Trader Technical Analysis for Strategy:

The video is very detailed, the summary below doesn’t cover a lot of what was discussed on the video so if you are trading oil be sure to watch the video as it is a very in depth look at the charting and more.

Oil trading 69.05 at noon Monday during review.

Review of our crude oil trade and trade alerts in to the regular market open:

We were short crude oil 68.85 in to open. We covered 68.58 75% of the position and then the final 25% we covered the trade at 68.50.

Below are the screen shots of the Oil Trade Alerts from private member Oil Twitter Alert Feed.

Screen shot, oil, crude, trade, alerts
Nailed the Crude Oil Short in Trading Room at Open USOIL WTI $USO $CL_F $UWTI $DWTI #Oil #Trade #Alerts

Below is a screen shot of EPIC Oil Algorithm charting that shows the short oil trade entry (green arrow) and the areas of the chart where we covered the trade.

chart, trade, alert, oil,
Crude oil trade alerts on EPIC Algorithm chart for Oil Trading Room #Oil #Trade #Alerts

Below the chart from the oil trading room shows the obvious short and long positions that could be traded on the algorithm model (also what the machine trading is programmed to execute oil trades with).

oil, trading, room, chart
White arrows on chart from Oil Trading Room show obvious trades on the algorithm. USOIL WTI CL_F USO #Oiltradingroom

At 4:00 on video I discuss the machine coding progress and the obvious trades on the oil algorithm charting and how clean that trading has been in the trading range on the model.

At 4:45 in the the Oil Trading Room there was a member comment pointed out that is very true for trading the model with success.

“Trade the model until it breaks, take you lumps when it does.”

I have been looking for an area to re-short in to the week and I just haven’t executed but there was an excellent area of the charting to do that.

At 6:00 on the video a question in the private oil trading room on Discord is answered with reference to the wide swing trading ranges on the model.

ifitworksYesterday at 10:29 AM
@Curt Melonopoly do you are you able to back test any data for how the market reacts(probability) stays around the grey line before it makes a decision to change trend. if that makes any sense?

At that point in the video I explain how we are coding the oil algorithm for machine trading and more specifically the swing trading range at the grey horizontal main pivots on the charting.

At 8:00 areas to short oil and the down channel in oil trade is reviewed on the algorithmic model and charting.

A member call for intra-day oil trade from the oil trading room is also discussed;

RichYesterday at 12:12 PM
If it holds here at 68.95 should be a good opportunity to go long to 69.30

At 10:44 hidden pivots on the charting are discussed and trend lines for trade.

At 11:00 the Trend Line charting is discussed. A very good chart to watch. Support and resistance is strong.

At 11:20 the Symmetry charting is reviewed. It looks like oil trade is going to return to its natural order. What to expect going forward in trade is reviewed and historical advantages.

At 12:30 the trading box on the daily oil charting is reviewed. Down trend waves are reviewed. 70.85 is very likely intra-day on the chart. The 200 MA test is likely.

At 13:00 on the video is the weekly wedge charting reviewed and how trade in oil is playing out almost perfect to the time cycle and price. 68.38 (approximate) is the area near the bottom of the quad to watch. The upside thesis is reviewed here for trade between now and early 2019. AND YES I know they aren’t the “primaries” haha – lots going on in the brain while in a trading day.

At 15:00 200 MA 67.05 on monthly chart is reviewed. This is in large part why I don’t think we will sell off heavy.

Either way I want a big move in crude oil trade in to Christmas, I want a career trade and that is what I will be watching for.

In to the end of the video the 4 hour chart for crude oil is reviewed showing the trend line support areas of the charting and I review some possible “tells” on the oil chart.

It’s important to watch the video to get the support areas in a sell-off – if 68.50 is lost in trade it’s 67.00’s and so on.

Trading Strategy in Summary

This is how I think the shorts are going to get caught. The decision area (support in trade) is similar on all the charts. The technical set-up and thesis that shorts will get caught off-side is reviewed here. I think there is going to be a sell-ff that will freak out the long positions and the shorts will be caught in a compressed situation after mid terms.

Increase Your Crude Oil Trading With These Tools.

  • There is a link below to our oil trading academy page that has a number of links to articles on our site,.
  • You can book private online trade coaching via Skype.
  • Join our live trading room.
  • Sign on to our oil trading alert feed subscription, (alerts are on a private member Twitter feed).
  • Sign on to our weekly algorithm reporting that provides the algorithm model, conventional charting, guidance for the week etc.
  • Attend a trading boot camp (in person or online).
  • Request via email the videos of our most recent trading boot camp or the master class series videos (both sets are approximately 20 hours each). They are available only by email request at this time by emailing info@compoundtrading.com. Soon they will be posted to our shop on website.

Thanks

Curt

Any questions let me know!

Further Reading to Help You Trade Oil:

Find more posts like this one on our Oil Trading Academy Page – links to numerous oil trade strategy reports.

Welcome to NYMEX WTI Light Sweet Crude Oil Futures.

Subscribe to Our Oil Trading Platform:

Standalone Oil Algorithm Newsletter (member charting sent out weekly).

Real-Time Oil Trading Alerts (Private Twitter feed).

Oil Trading Room / Algorithm Newsletter / Alert Bundle (includes weekly newsletter, trading room, charting and real-time trading alerts on Twitter).

Commercial / Institutional Multi User License (for professional trading groups).

One-on-One Trade Coaching (Via Skype or in person).

Click here to find all information and pricing on Oil Newsletter, Trading Chat Room, Oil Alerts and more.

Curtis Melonopoly (@curtmelonopoly) is rated Top 250 Stock exchanges authority, covering also Mathematical finance and Economy of the United States

Article Topics: Crude, Oil, Trading, Trading Room, Strategy, Technical, Analysis, Alerts, USOIL, WTI, CL_F, USO

Follow:

Tweets by EPICtheAlgo


Read More

Protected: Gold Algorithm Trade Report (Rosie) Sun Oct 21 $GC_F $XAUUSD $GLD $GDX $NUGT $DUST

October 21, 2018 RosietheAlgo GLDRosie the Gold Algo Chart Report$DGLD, $DUST, $GDX, $JDST, $JNUG, $NUGT, $UGLD, $XAUUSD, Algorithm, Chart, GLD, Gold, Miners, Strategy, Trading

This content is password protected. To view it please enter your password below:

Read More
Crude Oil Algorithmic Trading: A Simple Strategy That Wins – Real Life Example.

Crude Oil Algorithmic Trading: A Simple Strategy That Wins – Real Life Example.

October 20, 2018October 21, 2018 Curt MelonopolyCrude Oil Trading Algorithm (EPIC), Crude Oil Trading Strategy, General Complimentary NewslettersAlgorithmic, Crude Oil, Daytrading, Oil, Strategy, Trading, Trading Room

A Real-Life Simple to Reproduce, Consistent Example of a Winning Crude Oil Day Trading Strategy From Our Lead Trader.

How Algorithmic Trading Can Help You Win Consistently (from our trading room on Friday). Man and Machine.

Day trading crude oil futures is not easy… but it is at the same time. The most difficult for me is executing trades based on what I know is right – the most probable winning trade set-ups for buy/sell signals as provided by our algorithmic oil trading model.

This is why I always tell our clients to study the rule-set and use trade alerts only for a heads-up and to use your own trading plan based on your understanding, sizing, comfort area etc. Behind the alerts is a real trader too (at least as it applies to my alerts, our machine trading alerts are a different story going forward).

The buy/signals provided by our algorithm provide structured day trading that increases my win rate greatly – but only when I respect the rules of the model.

I have published a number of articles now detailing the basic rules of the model to assist traders with a better win rate. My personal win rate went from (at best) 60% to approximately 90% (it fluctuates between 80%-95% on an annual basis – there is an ebb and flow). All time stamped live trade alerts.

In our oil trading room last Friday I was triggering trades as was our machine trading technician – man vs. machine (again).

The bottom line: the machine (without effort) won (following the rule-set), and I won – that is until I got greedy.

Both the machine trading technician and I were triggering long side positions near the same time in to the Friday regular market open (my long entries were adds to the previous night futures trade I was already in).

The trade worked well and when the trade met its price target area of the algorithmic model structure (resistance) the machine trade trimmed and then closed on some pull-back and I closed completely.

But I started looking for a further break-out above the algorithmic model signal of resistance as provided by EPIC the Crude Oil Algorithm (after I already had a winning trade). This was the error.

But I started looking for a further break-out above the algorithmic model signal of resistance as provided by EPIC the Crude Oil Algorithm (after I already had a winning trade).

So yes, my day was affected negatively (not that bad because I recovered some by trading bounces during the intra-day reversal sell off), but not good because my trading day could have been very positive vs. negative / stressful on the day.

There is a low stress easier way – just follow the rules of the model. The algorithmic trading model provides a consistent, simple, highly profitable structure for day trading (and even swing trading) crude oil.

Below I explain what I did right and what I did wrong, how easy it is to trade crude oil using proven strategies (with EPIC Oil Algorithm) and how easy it is to get greedy – hopefully my real-life experience helps your trading.

#CrudeOil #AlgorithmicTrading #TradingStrategy FX: $USOIL $WTI $CL_F $USO 

The Trade Details (actual screen shots of the alert feed, charting and commentary).

Below is the initial alert (screen shot from our trade alert feed on Twitter) by our oil machine trading technician at 9:17 AM on Friday October 19, 2018. The technician alerted a trade signal long machine buy program in to the regular market open at 69.25 on the algorithmic charting.

Our algorithmic charting is produced on crude oil FX USOIL WTI and this can be used for trading oil futures CL, ETNs / ETFs such as United States Oil Fund (USO), SCO, UCO, UWTI, DWTI and more.

algorithmic, trading, buy, program, oil
Crude Oil Trade Alert (screen shot) – Machine Trade Buy program initiated in to open 69.25 917 AM – 19 Oct 2018.

At 9:20 PM October 18, 2018 in futures trade the night prior (Thursday night) I alerted to the feed a long side trade entry at 68.93 as a test trade for the break of upside resistance area. So at this point I was in at 68.93 long and the technician was in the trade at 69.25 the next morning.

Oil Trade Alert (Lead Trader) Screen Shot. Long test 68.93 tight, break res upside test 920 PM – 18 Oct 2018

Less than one minute later (after the technician alerted) I was alerting adds to my existing trade (we were obviously loading our trades and alerts at near the exact same time).

oil ,trade, alert, market open
Oil trade alert (screen shot) Adds in to open – lead trader (watch open, will close fast if it fails but it does look like it will squeeze possibly).

The Buy Signals Triggering a Long Oil Trade Alert:

On a conventional crude oil 1 minute chart for FX USOIL WTI, the long side trade entry alert signal sent out to members of our oil trading service was based on a number of signals that combined (in momentum and confirmed with the algorithm model) provide high probability to a winning day trade – the signals are as follows:

  1. Intra day trade in to regular market open breached the Fibonacci trend-line resistance (grey dotted line),
  2. Trade breached the trading box to the upside (red box on chart),
  3. The Squeeze Momentum Indicator turned green again,
  4. The MACD turned up again,
  5. The Stochastic RSI had turned back up after near bottom (the closer to bottom the better in most instances),
  6. Trade was above the 200 MA (moving average) having just retested its support (pink on chart),
  7. Trade was above VWAP (orange on chart),
  8. Trade was above the intra-day trend support line (yellow line on chart).
  9. Positive buy flow volume was increasing in to open (volume bars on chart with blue highlights),
  10. The momentum of trade was subsequently on the bullish side,
  11. The algorithmic model was also in agreement (shown below and to understand the model takes some study).
crude, oil, chart, trading, signals
On conventional USOIL WTI chart, trade entry based on Fib, trading box, SQZMOM, MACD, Stoch RSI, 200 MA, VWAP, vol, momentum.

On the crude oil algorithmic charting model the following reasons were in play to confirm the long trade:

  1. The upside price target area on the chart that had a time cycle concluding on Friday at 1:00 PM (see white arrow on chart) was most probable considering the fact that trade was above the mid trading quadrant horizontal support line (thick grey horizontal line). Which in this instance was also a primary support line for the wider time-frame for swing trading oil (which makes it a significant support area on the chart).
  2. In futures trade the night before, oil trade had broke to the upside of the mid quad resistance area (grey horizontal line as described above and shown on chart below).
  3. There was a hidden pivot (not shown on the algorithm charting but highlighted here for demonstration purposes in bright yellow – horizontal dotted yellow line on chart). The idea being that if trade momentum was turned up in to open that this hidden pivot was likely to be breached to the upside and would then become yet another support confirming the bias to the upside target on the model.

The algorithmic charting model price target described above is the “easy” trade signal I refer to in the title of this post. At any given time of trade intra-day we can provide the most probable price target for the coming time cycle conclusions. I won’t go in to detail here (that is a completely different article). You can read our other oil trading posts, become a member, watch our videos on how to use the oil algorithm, get some trade coaching or attend a boot camp for more details to this process.

The algorithmic charting model price target described above is the “easy” trade signal I refer to in the title of this post.

Another thought (off-topic a tad), consider the trading quadrant – there were four or five excellent long and short entry points on the model at the quad wall resistance and support areas. This week our machine trading technician is alerting to the EPIC Private Member Twitter Feed those trades (I will also continue as normal). 

AND if you look at my original long entry the night prior in futures trade, that trade signal is an even easier trade signal – price was breaching the mid pivot on the trading quad of the model (gray line) which is also the wide swing trading support and resistance area of the charting.

algorithmic, trading, crude, oil, alert. chart
On algorithmic oil charting trade was based on momentum in to pivot with most probable price target up.

I then provided our members with the trade strategy (guidance) with price targets at 69.70, 69.78 and 69.80 at 9:24 AM (right after the market opened). The price targets are where there are resistance areas of the algorithm chart provided above.

daytrade, oil, alert
Crude oil trading alert twitter feed screen shot – price targets for daytrade 69.70, 69.78, 69.80 in upside scenario.

At 9:35 AM I provided further trade strategy / guidance explaining that I was looking for a reversal in the recent trend of crude oil trade (I had distributed a 4 hour chart to our membership by email the night before that I reference in the alert).

oil, trade, alert, perspective
Perspective – reversal trade scenario, if it fails extreme caution to next level down 4 hour chart (yellow TL).

At 9:40 I publish the 4 hour oil chart with intra day trade and the two trend line support areas of the chart I was watching. Providing trade guidance that if the current support was lost in trade that we were likely turning down to the next support area on the chart in the 67’s.

oil, chart
If this area fails 67s are in play #crude #oil #tradealerts FX $USOIL $WTI $CL_F $USO.

Below is the 4 hour USOIL WTI chart provided to members that shows the general trend line support area of crude oil trade.

premarket, trading, plan, crude, oil
Crude oil lines on 4 hour chart FX $USOIL $WTI $CL_F $USO #Oil #OOTT.

At 9:42 AM Oct 19, 2018 (25 minutes after the trade alert long oil) the machine trading alert was posted to the Twitter feed with guidance to trim at 69.58 in trade and then possibly add to the long position at 69.58 (obviously if the indicators provided a buy signal).

machine, trading, crude oil, alert, buy
Machine Oil Trade Alert – Trims initiate 69.58 with adds on intra day pull backs 942 AM – 19 Oct 2018.

The reason for the trade alert issued to members to trim long positions on oil algorithm was that trade intra-day was nearing the Fibonacci trend-line resistance area on chart model (trading quadrant wall). Trade was also nearing the peak of the algorithm trading range intra-day (the apex of the model.) These are the same reasons I exited my long trade as provided below in the next section.

Notice on the chart below trade had hit 69.75’s and the trade alert (as above) price targets for the trade strategy for the day in crude oil based on the algorithmic model were published as “price targets for day trade 69.70, 69.78, 69.80 in upside scenario.”

resistance, oil, trade, algorithm
Reason for trim trade alert on oil algorithm – Fibonacci trendline resistance area on chart model.

At 9:45 AM I closed my trade at 69.57. Not a bad trade considering my entries at long crude oil at 68.93 with adds in 69.25’s. A 45 tick trade average in oil is a decent day trade (450.00 on 1 contract or in this instance about 4x that).

oil, trade, alert
Oil trade alert – Closed 69.57 will re-renter on pull back in price or squeeze.

At 9:58 the technician trade closed on a pull back (the other half of the trade) at 69.43 – a 26 tick average. A decent trade profit, especially considering it lasted just over 30 minutes and it was low stress. It took me 12 hours to close a 45 tick trade and the tech 35 minutes to close a 26 tick trade – obviously the technician’s use of time was more efficient.

It gets worse for me though, because I thought I’d try and get a break upside primary resistance on the algorithmic oil charting. The technician followed a simple rule-set (wait for trade to prove out and then enter) and didn’t follow me in to my trade (he can’t because he is obligated to a specific rule-set for triggering trades).

oil, machine, trading, alert
Oil machine trading alert – Stop adjusted to 69.43 USOIL WTI CL_F.

The additional trade I entered I won’t detail here with screen shots etc, but I will say that it turned against me almost immediately and I should have exited the trade immediately.

As oil sold off some intra-day I held my position and added on a bounce and sold on the bounce and chiseled my way to a small loss – but a loss nonetheless. It was a waste of time.

The two primary mistakes I made in my second trade:

  1. I entered a long trade at the resistance of the algorithmic trading model. That is not a correct way to position a trade. I closed the previous trade properly but did not start the new trade properly.
  2. When intra day trade went against my position I should have closed for a small loss, but I did not.

There are other details and reasons for the trading decisions that were made, however, for simplicity and to keep this instructional post to a digestible size I will leave it here.

To increase your crude oil trading skill-set we have a number of tools you can use.

  • There is a link below to our oil trading academy page that has a number of links to articles on our site,.
  • You can book private online trade coaching via Skype.
  • Join our live trading room.
  • Sign on to our oil trading alert feed subscription, (alerts are on a private member Twitter feed).
  • Sign on to our weekly algorithm reporting that provides the algorithm model, conventional charting, guidance for the week etc.
  • Attend a trading boot camp (in person or online).
  • Request via email the videos of our most recent trading boot camp or the master class series videos (both sets are approximately 20 hours each). They are available only by email request at this time by emailing info@compoundtrading.com. Soon they will be posted to our shop on website.

Thanks

Curt

Any questions let me know!

Further Reading On Our Website That Will Help You Trade Oil Successfully:

Find more posts like this one on our Oil Trading Academy Page – there you will find links to numerous oil trade strategy reports.

Subscribe to Our Oil Trading Platform:

Standalone Oil Algorithm Newsletter (member charting sent out weekly).

Real-Time Oil Trading Alerts (Private Twitter feed).

Oil Trading Room / Algorithm Newsletter / Alert Bundle (includes weekly newsletter, trading room, charting and real-time trading alerts on Twitter).

Commercial / Institutional Multi User License (for professional trading groups).

One-on-One Trade Coaching (Via Skype or in person).

Click here to find all information and pricing on Oil Newsletter, Trading Chat Room, Oil Alerts and more.

Curtis Melonopoly (@curtmelonopoly) is rated Top 250 Stock exchanges authority, covering also Mathematical finance and Economy of the United States

Follow:

Tweets by EPICtheAlgo

Article Topics: Crude Oil, Algorithmic, Trading, Strategy, Day trading,Trading Room, Alerts, Signals, USOIL, WTI, CL_F, USO 

Read More
Daytrading Crude Oil: Buy Sell Signals Strategy for Intra-day Sell Off Reversal.

Daytrading Crude Oil: Buy Sell Signals Strategy for Intra-day Sell Off Reversal.

October 17, 2018October 27, 2018 Curt MelonopolyCrude Oil Trading Strategy, Day Trading$CL_F, $USO, $USOIL, $WTI, Alerts, Crude Oil, Daytrading, Signals, Strategy, Trading Room

Crude Oil Day Trading Strategies From Our Oil Trading Room Video Footage.

If there is one thing we have seen time and time again in our crude oil futures daytrading room (see previous articles) is that our EPIC Oil Algorithm model and day traders can pin-point the buy sell signals for the reversal for intra-day trend to capture a reversal in trade.

The focus of this post is to teach you how to find the intra-day bottom when daytrading crude oil. Step by step the lead trader explains what signals to watch for to simplify the process and ensure your winning strategy.

It is important to learn how to catch the bottom of sell-offs to increase your ROI on trades and capture the next move. You may have to enter a number of trades with tight stops to get a position that is set for the move, but it is worth the time if you learn how.

#DaytradingOil #OilTradingStrategy #TradeReversal # FX: $USOIL $WTI $CL_F $USO 

Main Points of Trade Strategy Covered in this Article:

  • Day trading oil signals covered in the video and post below:
    • EPIC Crude Oil Algorithm Charting.
    • Conventional Oil Charting.
    • Charting Indicators; Moving averages, squeeze momentum, MACD.
    • Time Cycles.
    • Price Targets (intra-day and weekly).
    • Trading Boxes.
    • Charting Time Frames.
    • Order Volume.
  • Short cover rally intra-day.
  • Entries around the edge of range.

Video Date and Description: October 17, 2018 10:25 AM – EIA Petroleum Report Live Trading Session.

Voice broadcast starts at 2:10 minutes on video.

Video Transcript Summary Highlights:

At 2:20 on video FX USOIL WTI trading 70.73 at the beginning of the session, trading on top of support at top of trading box at down side channel support.

The down channel in trade is confirming per the most recent guidance in recent reports and I am expecting that in to end of October and then up in to Christmas.

Resistance points on algorithmic model short side is most probable for winning in down trend (retracement) – areas to short pointed out on charting at 3:05 on video.

Bias was a long intra-day when report was released, but there was a surprise build today.

I usually don’t trade the first 5 mins after the EIA crude inventory numbers are released.

Example of EIA report data as posted on EPIC’s Twitter Feed:

#WeeklyPetroleumStatusReport for week ending 10/12/18 posted https://go.usa.gov/xPRx3 #oil #gasoline #diesel #heatingoil #propane #OOTT

https://twitter.com/EPICtheAlgo/status/1052567708473032704

3:40: On the oil algorithm there is a buy trigger signal intra-day at 69.97 at the mid channel support test for a daytrade.

3:50: Symmetry chart has a buy signal at 70.19 at top of oil trading box.

4:08 Trade on monthly chart is still between the 100 MA and 200 MA and I expect a break to upside or downside early November and my bias is to upside.

4:14 On the weekly wedge chart 70.00 watch very close at top of trading box, end of October time-cycle peak to bottom of wedge on chart 68.42 – that is possible.

4:45 On the daily oil chart trade intra-day is right at the pivot. 50 MA is just under price and to the upside the price intra-day was rejected at the pivot.

Don’t miss the last report on oil trade guidance I provided that guides on signals from now in to early 2019 on all charting.

5:10 Charting trend lines reviewed with time cycle peak early December in 76.00 region.

7:20 on video #EIA report comes out.

7:27 the sell-off on oil is apparent in trade with stops in oil getting taken out.

I start reviewing oil charting at this point on video for various supports to possibly take a position long.

8:50 6.5 million barrel build in crude oil inventories is discussed. 69.50 possible low in oil trade is discussed here.

9:40 Trading 73.00. Any long positions be sure to keep your position with tight stops until down to the 69.50 support range.

Top of trading box on the weekly wedge support at 69.99 is considered.

11:15 Watching chart indicators; MACD, Squeeze Momentum and Stochastic RSI on 1 minute time frame here as price is getting in to the first signal for a possible buy zone daytrade at support.

11:40 I explain that I am looking for a short cover rally for the oil daytrade and then shorting the resistance. As shorts cover price goes up, this occurs when the sell-off on the day comes to an end as oil shorts cover positions.

11:50 I explain that trade is down 3% on the day and that this is typically the area of the short covering and reversal intra-day.

12:40 As price bounces I start to look toward the upside 20 MA resistance on the 1 minute chart.

13:35 I provide guidance that we are possibly looking at 69.00 area and even 68.46 on the wedge chart.

14:50 My daytrade plan for support area and resistance areas and the intra day time cycle confirmation of up or down channel for trade is reviewed on the oil algorithm charting.

17:10 Watching the possible buy zone and 1 min chart for squeeze momentum to turn.

20:20 We are watching the pressure in oil trade in to the bottom of the trading box on the 1 minute chart and considering more stops to get ta’ken out if trade goes below the support on the trade box.

22:20 15 minute candle expires (important point of time to watch trade closely). The bottom of the trading box then is lost.

23:50 I discuss the problem created with governments manipulate price in markets (such as Trump with oil) and what will likely happen with the price of oil when the anomaly will cause a sever snap back trade in oil (also referenced earlier in video). Essentially the structure of the natural trading range of a financial instrument is manipulated.

26:00 oil starts to trade up and I’m watching for the 20 MA upside resistance test.

27:00 I explain that many traders would have taken the buy signal at the mid channel line on the chart and that I likely should have.

28:10 After 20 MA resistance has occurred and price is on the way back down to the next support and I explain where that is and that it is my possible buy area on chart.

29:25 The buy side for oil comes in and I explain that I’ve now missed two buy triggers.

42:00 I am long crude oil futures at 69.91.

44:19 I explain the 5 min candles and a place to trim the position at top of the trading box and alerting that I have trimmed my long position at 70.01 and advise that the 50 MA on the 1 min is coming. Ten minute candle expiry on watch.

45.40 I alert that there is resistance heavy intra day 70.28 range.

46.55 I close the remainder of the daytrade and look for another entry.

Below is the screen shot of my trade alert for the day trade in crude oil on the long side and my closing the position. This reflects what it looks like when you try and catch the reversal on intra-day trading.

daytrading, crude, oil ,signals
Daytrading Crude Oil – Screen Shot of Oil Trade Alerts Feed with signals for long oil trade and closing trade.

There is more to the video, with various discussion on daytrading crude oil with what signals to watch for and there is another trade on the video also.

See video for more on related discussions.

Below is the guidance in given to the oil trading room with charts at the start of futures trading later that day.

Price targets for 900 AM Oct 18 price cycle completion intraday crude oil trade.

price, targets, signals, day trade, oil
Daytrading Crude Oil – Price targets for 900 AM Oct 18 price cycle completion intraday crude oil trade. #daytrading #crude #oil

Buy sell trade signals at each highlighted trendline (yellow) on chart.

buy, sell, trade, signals, crude, oil
Daytrading Crude Oil – Buy sell trade signals at each highlighted trendline (yellow) on chart #crude #oil #daytrading

Signals for end of week price targets. Upper target bias – lead trader.

daytrading, crude, oil, signals, weekly
Daytrading Crude Oil – Signals for end of week price targets. Upper target bias – lead trader. #Crude #Oil #Daytrading

Thanks

Curt

Any questions let me know!

Further Reading:

5 Steps to Making a Profit in Crude Oil Trading.

https://www.investopedia.com/articles/investing/100515/learn-how-trade-crude-oil-5-steps.asp

What is a ‘Trade Signal’:
A trade signal is a trigger for action, either to buy or sell a security or other asset, generated by analysis. That analysis can be human generated using technical indicators, or it can be generated using mathematical algorithms based on market action, possibly in combination with other market factors such as economic indicators. https://www.investopedia.com/terms/t/trade-signal.asp

Other Crude Oil Trading Reports & Videos:

Learning to Trade Oil Links on our Site and/or YouTube.

Crude Oil Trading Strategies: This Is It. How To Trade Crude Oil’s Next Move.

Crude Oil Trading Strategy – How I Will be Trading Oil in to Time Cycles.

Oil Trading Room – Oil Trading Signals with Lead Trader (plus video).

Crude Oil Trading Room – Member Oil Trade Signals / Alerts for Trading the EIA Report (w/ video).

Oil Trade Alerts: How We Knew Where Oil Sell-Off Bottom Was in Advance. Crude Oil Trading Strategy.

Crude Oil Trading Face-Off Results “Pro Trader” (Man) vs. EPIC Oil Algorithm (Machine Trading Tech)

Oil Trading Alerts Live Video w EPIC Oil Algorithm #EIA Report #Oil #Trading #Algorithm #Alerts $USOIL $WTI $CL_F

“The Nut Hand” Today’s Huge Oil Trade Win. Exactly How It Was Done. How I Knew & How You Can Too.

CRITICAL Oil Trade. Weekly Timing. EPIC Oil Algorithm Channel $USOIL $WTI $CL_F $USO #OilTrading #EIA

Overnight Oil Trade | Trading Plan in Detail | EPIC Oil Algorithm $USOIL $WTI $CL_F #OIL $USO #Alerts

No Crystal Ball? Watch this… EPIC Oil Algorithm #EIA $USOIL $WTI #OIL $USO $CL_F #OOTT #Algo

Oil Trading Room – How to Use EPIC the Oil Algorithm June 21, 2017 (video).

Oil Trading Room – How to Use Oil Algorithm Chart & Recent Trades June 29, 2017 (video).

Here we unlock historical member reports at intervals after time cycles have expired for traders that are learning to trade oil. When you clock on link scroll down at landing page on blog section you will be transferred to so that you can get to reports that are unlocked over time: https://compoundtrading.com/category/epic-the-oil-algo-chart-report/

Subscribe:

Standalone Oil Algorithm Newsletter (member charting sent out weekly).

Real-Time Oil Trading Alerts (Private Twitter feed).

Oil Trading Room / Algorithm Newsletter / Alert Bundle (includes weekly newsletter, trading room, charting and real-time trading alerts on Twitter).

Commercial / Institutional Multi User License (for professional trading groups).

One-on-One Trade Coaching (Via Skype or in person).

Click here to find all information and pricing on Oil Newsletter, Trading Chat Room, Oil Alerts and more.

Connect:

Register to free email list for trade set-ups, webinars, special events: https://compoundtrading.com/contact/

Website: https://compoundtrading.com

Blog: https://compoundtrading.com/blog/

Free chat room: https://discord.gg/2HRTk6n

Subscribe: https://compoundtrading.com/overview-…

Twitter: https://twitter.com/CompoundTrading

Lead Trader: https://twitter.com/curtmelonopoly

Tradingview: https://www.tradingview.com/u/curtmel…

Facebook: https://www.facebook.com/compoundtrad…

StockTwits: https://stocktwits.com/compoundtrading

Email: https://info@compoundtrading.com

Curtis Melonopoly (@curtmelonopoly) is rated Top 250 Stock exchanges authority, covering also Mathematical finance and Economy of the United States

Follow:

Tweets by EPICtheAlgo

Article Topics: Daytrading, Crude Oil, Strategy,Trading Room, Alerts, Signals, USOIL, WTI, CL_F, USO 

Read More
Crude Oil Trading Strategy – How I Will be Trading Oil in to Time Cycles FX $USOIL $WTI $CL_F $USO

Crude Oil Trading Strategy – How I Will be Trading Oil in to Time Cycles FX $USOIL $WTI $CL_F $USO

October 8, 2018February 5, 2019 Curt MelonopolyCrude Oil Trading Algorithm (EPIC), Crude Oil Trading StrategyCrude, Oil, Strategy, Trading

Crude Oil Trade has been on a rally for some time. A retrace is in order, but how how far will oil retrace? What is my personal oil trading strategy? What is my bias – bullish or bearish in to time cycles?

To be clear, I am very bullish oil based on various geo-political set-ups or probabilities. That’s my fundamental bias – bullish oil, the reasons would take a book to explain and that’s not our focus here anyway. The focus here is to know the key areas of support and resistance on the primary time frames to trade oil this week for profit. So this post will focus on that and the regular EPIC oil algorithm report will be out soon.

Here’s my personal trading plan (strategy) for crude oil…

The recent run up in oil caught me off-guard, prior to the run-up I was on a multi-week winning streak. Where the change in streak for my trading occurred was when I changed time frames and algorithmic models – I was testing some machine trading models we are coding.

Anyway, that’s water under the bridge and I’m ready for the next.

Below is a break down of what I see coming in my personal oil trading strategy near term. First lets review a few crude oil charts on a few different time frames…

Crude oil weekly chart with key areas of support and resistance in trading box to watch.

The trading box on the weekly chart provides an upper resistance starting at around 75.30 and a lower support area starting at around 72.93.

The diagonal Fibonacci trend lines provide an up trend resistance at around 74.75 and down trend support nearing 73.50.

Neither is absolute (the trading box or Fib trend lines), but they are marks to watch. The way that crude oil trades is that every key decision is to be watched for a turn, you never know which will cause a turn so you make your move based on what has happened at each decision.

The weekly charting structure is a large structure and the trading box should be weighted significant in anyone’s trading plan.

https://www.tradingview.com/chart/USOIL/COmA2gkR-Crude-oil-weekly-chart-with-key-areas-of-support-and-resistance/

Crude, oil, trading, strategy, weekly, chart
Crude oil weekly chart with key areas of support and resistance in trading box to watch. #oiltradingstrategy

Crude oil daily chart with key resistance and support areas of trade on watch.

On the daily chart the trading box offers support starting at around 73.26 and has a range of support to about 73.00 which puts it about 7 cents off where the weekly chart trading box support is at (starts). Intra-day in Sunday night futures FX USOIL WTI is trading 73.69 and hit a low of day in this session so far at 73.53.

If oil rally’s again, the daily chart says 79.09 area is the start of significant resistance in the trading box range. If you reference 79.00 ish on the weekly chart that brings trade to the upper region of the Weekly charting resistance also. The two time-frames do not concur exact, but they are similar.

Also of note, the 20 MA is at 71.96 intra-day (an indicator to consider).

https://www.tradingview.com/chart/USOIL/SybRT1C2-Crude-oil-daily-chart-with-key-resistance-and-support-areas-of-t/

Crude, oil, daily, chart, trading, strategy
Crude oil daily chart with key resistance and support areas of trade on watch. #crudeoil #tradingstrategy

Symmetry on this daily chart structure says 80.00 Nov 28 and 86.70 Jan 25 are in play if rally re-starts. 

And yet another structure to consider… but only consider as it relates to symmetry possible. The channel may also be in play (white arrows). The rule of trade should be to EPIC’s oil algorithmic charting model, the charts included in this special report like this one are provided for consideration only.

https://www.tradingview.com/chart/USOIL/TAbzu73c-Symmetry-on-this-daily-structure-says-80-00-Nov-28-and-86-70-Jan/

Crude, oil, chart, symmetry
Symmetry on this daily structure says 80.00 Nov 28 and 86.70 Jan 25 are in play if rally re-starts. FX USOIL WTI

Trade in crude oil near algorithm channel support or resistance in up channel or down channel is an obvious area to start entries.

The support and resistance areas of the trading channels on the EPIC algorithm are the most obvious areas to secure a turn in trade – these I will be respecting and trading with as serious of focus as I can muster going forward. The support and resistance areas of the channels work. Take your entry, keep your stop tight because you can always re-enter. When trade is near support or resistance simply use a 5 minute time frame and time in accordance to intra day trade and use a stop, keep it tight, and re-enter as needed. Five small scrapes for a trade that can move through the quad range is a small price to pay.

https://www.tradingview.com/chart/USOIL/RqcrbPfq-Trade-in-crude-oil-near-algorithm-channel-support-or-resistance/

Trading, algorithm, support, resistance, oil, crude
Trade in crude oil near algorithm channel support or resistance in up channel or down channel is an obvious area to start entries

Last but not least there is significant range support near 72.53 on the crude oil algorithm model that I will respect in my trade plan.

Oil, support, algorithm
Last but not least there is significant range support near 72.53 on the crude oil algorithm model that I will respect in my trade plan

So what’s the bottom line to my crude oil trading strategy going forward?

It doesn’t matter how many time-frames you chart oil on there is no way to get the various time-frames to concur, oil is just that way. Because oil trade is that way it is critical to use a rules based process for your trade execution.

The most predictable way that I have found is to use the algorithm model support and resistance at the channel signals. If you respect those areas of the algorithm and viciously respect tight stops understanding that you can always re-renter then you will do well. If you let fear or bias play with your mind you will fail. How do I know? Trust me, I’ve been trading the algorithm model since inception and I can tell you without a doubt that respecting its structure works and not respecting it causes embarrassing losses. A rigid system of trade works.

Anything I can do to help you with your trading let me know.

Thanks

Curt

October 8, 2018 6:54 AM Crude Oil Trading Strategy (Intra-day) Update

Below is an updated crude oil algorithmic chart update with the oil daytrading range I am monitoring. Also noted are the price targets expected.

Intra-day Oil Trading Strategy FX USOIL WTI CL_F USO #oil #trading #strategy https://www.tradingview.com/chart/USOIL/8JOAcTlF-Intra-day-Oil-Trading-Strategy/

Oil, Trading, Strategy, Intraday
Intra-day Oil Trading Strategy FX USOIL WTI CL_F USO #oil #trading #strategy
Read More
Oil Trading Room – Oil Trading Signals with Lead Trader (plus video)

Oil Trading Room – Oil Trading Signals with Lead Trader (plus video)

October 3, 2018October 15, 2018 Epic the AlgoCrude Oil Trading RoomAlerts, Crude, Crude Oil, Oil, oil trading, Signals, Strategy, Trade, Trading Room

Crude oil trading room video of lead trader reviewing oil trading signals / oil trading strategy for this week.

#OilTradingRoom #OilTradingSignals #OilTradeAlerts FX $USOIL $WTI $CL_F $USO 

Transcript summary highlights:

October 2, 2018 12:02 PM Oil trading strategy for this week.

Voice broadcast doesn’t start until 6:00 on video.

Quick review for oil trading plan this week, first up is EPIC Oil Algorithm.

Price targets on EPIC Oil Algorithm model are in a cluster this week around API Tuesday 4:30 and Wednesday 10:30 and oil intra-day is trading within the price target cluster which doesn’t surprise me.

Last few weeks have been tough for me personally trading oil.

Oil is in parallel channel above where it was trading in the model. Oil is in bullish trend but I don’t trust trade divergent in a channel parallel to where it should be trading.

I have two different trading plans for trading oil this week – one for swing trading oil and one for intra-day trading oil.

Swing trading plan thesis is based on a long entry at or near the bottom of the channel in oil trade on the chart on video. Same thesis as last week and I missed my entry. I will be looking for a long with a stop and re-enter as I need to get positioning, it will be in size.

There are some comments at this point on the video to trading psychology reflecting on my own challenges getting positioning in oil trade.

The intra-day oil trading plan is simple and based on how oil has recently been squeezing, so if it squeezed again I’ll just go with it with stops and I won’t sit under pressure.

If I have to take some paper cuts I’ll take the paper cuts to get positioning (as with my swing trade plan also).

The second chart reviewed in the video is a weekly oil chart highlighting the wedge and some inlay Fibonacci quads with trend-lines. 74.23 Oct 22 is a downside scenario on that chart with 68.39 worst scenario same day, but when you weigh the recent trend up that isn’t likely. Upside trade resistance areas on FX USOIL WTI are at 76.84, 78.36, 79.64.

The charts below correspond to charts reviewed on the trading room video (previously published in weekly oil report).

Crude, oil, trading, algorithm
Crude Oil Trading Algorithm. Gen1.V5 (EPIC). Intra-day crude oil trade. Oct 2 410 AM FX $USOIL $WTI $USO $CL_F #Crude #Oil #Trading #Algorithm
Crude, oil, weekly, chart
Crude Oil Weekly Chart Wedge. Testing resistance points on chart intra-day. Oct 2 521 AM FX $USOIL $WTI $USO $CL_F #oiltradealerts

Other Crude Oil Trading Reports & Videos:

Learning to Trade Oil Links on our Site and/or YouTube.

Crude Oil Trading Room – Member Oil Trade Signals / Alerts for Trading the EIA Report (w/ video).

Oil Trade Alerts: How We Knew Where Oil Sell-Off Bottom Was in Advance. Crude Oil Trading Strategy.

Crude Oil Trading Face-Off Results “Pro Trader” (Man) vs. EPIC Oil Algorithm (Machine Trading Tech)

Oil Trading Alerts Live Video w EPIC Oil Algorithm #EIA Report #Oil #Trading #Algorithm #Alerts $USOIL $WTI $CL_F

“The Nut Hand” Today’s Huge Oil Trade Win. Exactly How It Was Done. How I Knew & How You Can Too.

CRITICAL Oil Trade. Weekly Timing. EPIC Oil Algorithm Channel $USOIL $WTI $CL_F $USO #OilTrading #EIA

Overnight Oil Trade | Trading Plan in Detail | EPIC Oil Algorithm $USOIL $WTI $CL_F #OIL $USO #Alerts

No Crystal Ball? Watch this… EPIC Oil Algorithm #EIA $USOIL $WTI #OIL $USO $CL_F #OOTT #Algo

Oil Trading Room – How to Use EPIC the Oil Algorithm June 21, 2017 (video).

Oil Trading Room – How to Use Oil Algorithm Chart & Recent Trades June 29, 2017 (video).

Here we unlock historical member reports at intervals after time cycles have expired for traders that are learning to trade oil. When you clock on link scroll down at landing page on blog section you will be transferred to so that you can get to reports that are unlocked over time: https://compoundtrading.com/category/epic-the-oil-algo-chart-report/

Subscribe:

Standalone Oil Algorithm Newsletter (member charting sent out weekly).

Real-Time Oil Trading Alerts (Private Twitter feed).

Oil Trading Room / Algorithm Newsletter / Alert Bundle (includes weekly newsletter, trading room, charting and real-time trading alerts on Twitter).

Commercial / Institutional Multi User License (for professional trading groups).

One-on-One Trade Coaching (Via Skype or in person).

Click here to find all information and pricing on Oil Newsletter, Trading Chat Room, Oil Alerts and more.

Connect:

Register to free email list for trade set-ups, webinars, special events: https://compoundtrading.com/contact/

Website: https://compoundtrading.com

Blog: https://compoundtrading.com/blog/

Free chat room: https://discord.gg/2HRTk6n

Subscribe: https://compoundtrading.com/overview-…

Twitter: https://twitter.com/CompoundTrading

Lead Trader: https://twitter.com/curtmelonopoly

Tradingview: https://www.tradingview.com/u/curtmel…

Facebook: https://www.facebook.com/compoundtrad…

StockTwits: https://stocktwits.com/compoundtrading

Email: https://info@compoundtrading.com

Curtis Melonopoly (@curtmelonopoly) is rated Top 250 Stock exchanges authority, covering also Mathematical finance and Economy of the United States

Follow:

Tweets by EPICtheAlgo

Article Topics: Crude Oil, Trading Room, Oil Trading, Alerts, Signals, Crude, Oil, Trade, Strategy

Read More

Posts navigation

Older posts
Newer posts
Proudly powered by WordPress | Theme: sharksdesign by reviewexchanger.
 

Loading Comments...