Skip to content

Compound Trading Group

  • About
  • White Paper
  • Returns
  • News
    • NOTICE of Online Information Meetings
  • Order
    • Terms
  • About
  • White Paper
  • Returns
  • News
    • NOTICE of Online Information Meetings
  • Order
    • Terms

Tag Archives: $AMD

  1.   »  
  2. Tag Archives: $AMD

Tag: $AMD

Swing Trading: Earnings Special Report | $AAPL, $AKS, $AMD, $AGN, $EXP #swingtrading #earnings

Swing Trading: Earnings Special Report | $AAPL, $AKS, $AMD, $AGN, $EXP #swingtrading #earnings

January 24, 2019April 14, 2019 Swing TraderSwing Trading$AAPL, $AGN, $AKS, $AMD, $EXP, earnings, Signals, Stocks, Swing, Trading

Trade Set Ups Video for Swing Trading Earnings Season Thursday January 24, 2019.

Swing Trading Stock Signals in this Report: $AAPL, $AKS, $AMD, $AGN, $EXP …

Email us at [email protected] anytime with questions about any of the swing trade set ups covered in this video. Market hours can be difficult to respond but we endeavor to get back to everyone after market each day.

Notices:

Welcome to a series of special reports during earnings season for our swing trading platform. There will be a significant number of these mini reports.

Until mid July 2018 we distributed one swing trading report (1 of 5 in rotation) with a mandate being one report per week (on average) cycling the five reports (that include over one hundred equities) every five weeks (approximately).

Commencing July 2018 we switched up our swing trading service rotation to also include reports for earnings season, special trade set-ups, themed reports and swing trade alerts direct to your email inbox.

After earnings season we will recommence the regular rotations.

When managing your trades with the weekly reports keep in mind that you will have to invest an hour or two a week to check the indicators mentioned for buy and sell triggers. I was asked recently why we do not usually (although we do sometimes) include precise entry and exit points. The reason is simple, they don’t work – those services have terrible results.

Swing trading success, even with a service, does require “some” maintenance on the part of the user, although the new live alert service will take much of that burden off the user as we know many of our users have busy lives. It is the indicators lining up that signal a trade long entry or an exit. In our case we rely heavily on the natural trading structure of the financial instrument; including the MACD on daily or weekly, Stochastic RSI, Moving Averages, trading boxes, quadrants, Fibonacci support and resistance, trend lines, trajectory / trend of trade, time-cycles and more.

Indicators we base trade entry and exits on are at times listed with each trade posted so any user that does even moderate trade management will know when the indicator(s) have turn with or against the trade (here again it is wise to have at least a basic understanding of trading structures because you need to be able to respond to your own trading rules based process).

It is critical that you attend to the maintenance of your signals at least once a week if not twice and set stops and preferably alarms so that intra-week you can enter / exit or add / trim as required.

If you need help with rules based swing trading technical analysis, a specific trading plan (entries, exits, adds or trims) or with a simple understanding of proper structured charting and/or trading structured set-ups you can book some trade coaching time and we will assist you with your trade planning as needed. You may find after a few hours of trade coaching that this is all you need to become a proficient profit side trader.

We can schedule private coaching online, you can attend a trading boot-camp (online or in person) or order the downloadable recordings of a recent trading boot-camp or master class series (each about 20 hours of training per event). For any of those options email us for details.

Below is a primer if you know none or very little about proper chart structures:

“I get a lot of Questions on How to Trade our Structured Chart Models, this video has 5 min starter explanation at 1:00 – 6:00 min”. https://www.youtube.com/watch?v=QrXbE7lojAg&t=3s … – Fibonacci Trend-lines, Trading structure/quads, Price targets, Main support resistance (buy sell triggers), Time cycles, Moving averages, Trading trims/adds.

Intra-week you can DM myself on Twitter (@curtmelonopoly), visit me on Discord (http://discord.gg/2HRTk6n) and private message me or email me ([email protected]) with specific questions regarding trades you are considering. You can also visit the main trading during the mid-day review and ask questions by text in the chat area of the room.

IF WE DON’T GET BACK TO YOU RIGHT AWAY it is usually because we are pressured with reporting deadlines or are in a trading session.

As live charts are made available below, click on link and open viewer. Then to use chart yourself click on share button at bottom right (near thumbs up) and then click “make it mine”.

Swing Trading Signals / Charts for Earnings Season.

Bloomberg Earnings Season Reporting Calendar List https://www.bloomberg.com/markets/earnings-calendar/us

AK STEEL (AKS) Swing Trading Earnings, Trade Set-Up with Support and Resistance Marked with White Arrows $AKS.

Jan 24 –

How Trump’s Steel Tariffs Could Play Out This Year https://marketrealist.com/2019/01/how-trumps-steel-tariffs-could-play-out-this-year?utm_source=yahoo&utm_medium=feed&yptr=yahoo

There are no clear price targets on the AKS chart, however, trading the range between key support and resistance post earnings could yeild result (key support and resistance at white arrows).

https://www.tradingview.com/chart/AKS/IPJ0vQgS-AK-STEEL-AKS-Swing-Trading-Earnings-Trade-Set-Up-with-Support/

AKS, AK Steel, Swing Trading
AK STEEL (AKS) Swing Trading Earnings, Trade Set-Up with Support and Resistance Marked with White Arrows $AKS #swingtrade

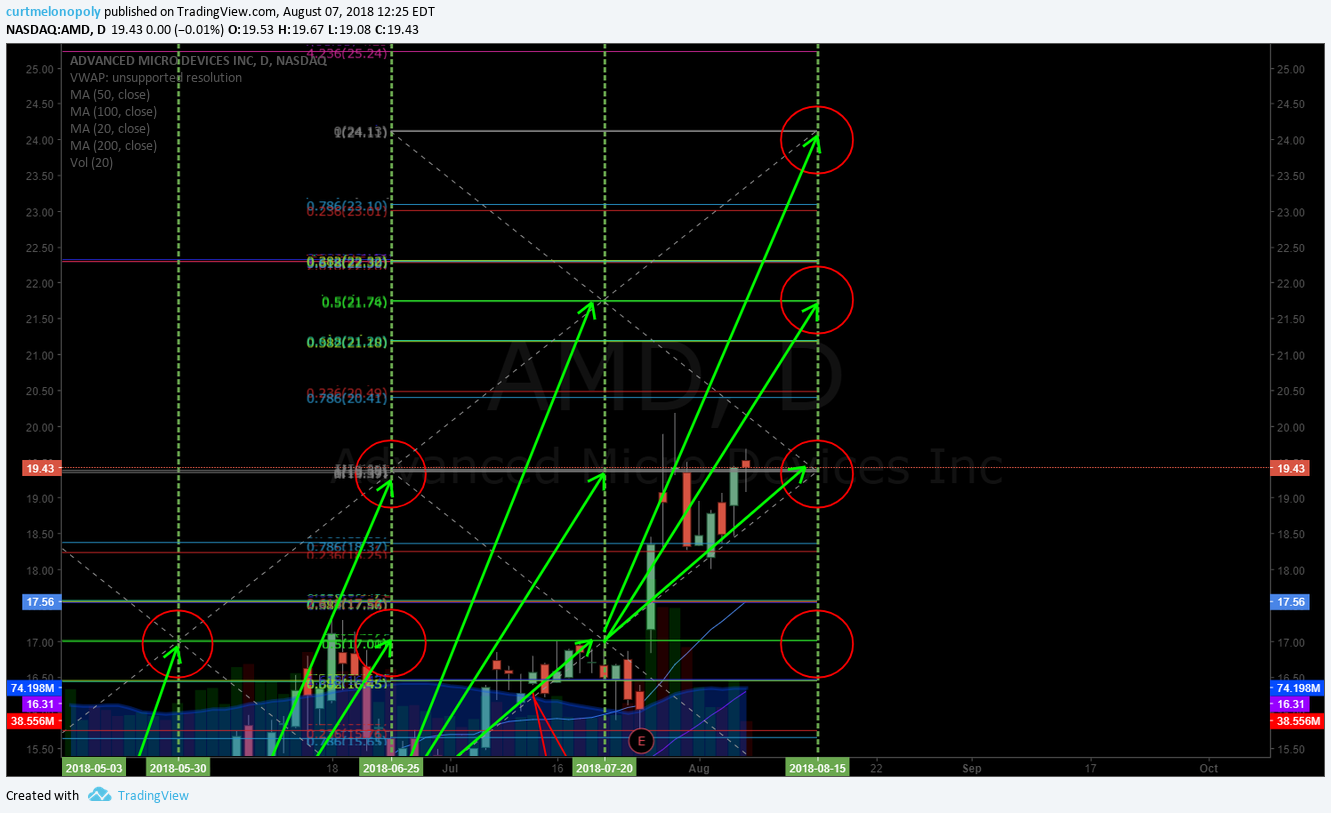
ADVANCED MICRO (AMD) swing trade long over 20.55 and short under 18.25 to price targets.

Jan 24 – 

Big Chip Earnings Preview: Intel, AMD Set To Report Amid Changing Competitive Landscape, Cycle Risk #swingtrading $AMD https://finance.yahoo.com/news/big-chip-earnings-preview-intel-171733038.html?soc_src=social-sh&soc_trk=tw

https://www.tradingview.com/chart/AMD/ui2Jne9O-ADVANCED-MICRO-AMD-swing-trade-long-over-20-55-and-short-under/

AMD, Advanced Micro, Swing trade
ADVANCED MICRO (AMD) swing trade long over 20.55 and short under 18.25 to price targets #swingtrade

ALLERGAN (AGN) Key areas of support and resistance noted on chart for post earnings swing $AGN.

Jan 24 – 

Bouncing back from collapse: Old Republic International Corporation (ORI), Allergan plc (AGN) #swingtrading $AGN https://finbulletin.com/2019/01/23/bouncing-back-from-collapse-old-republic-international-corporation-ori-allergan-plc-agn/

https://www.tradingview.com/chart/AGN/2hQKfFKG-ALLERGAN-AGN-Key-areas-of-support-and-resistance-noted-on-char/

AGN, Allergan, Swing trade
ALLERGAN (AGN) Key areas of support and resistance noted on chart for post earnings swing $AGN #swingtrading

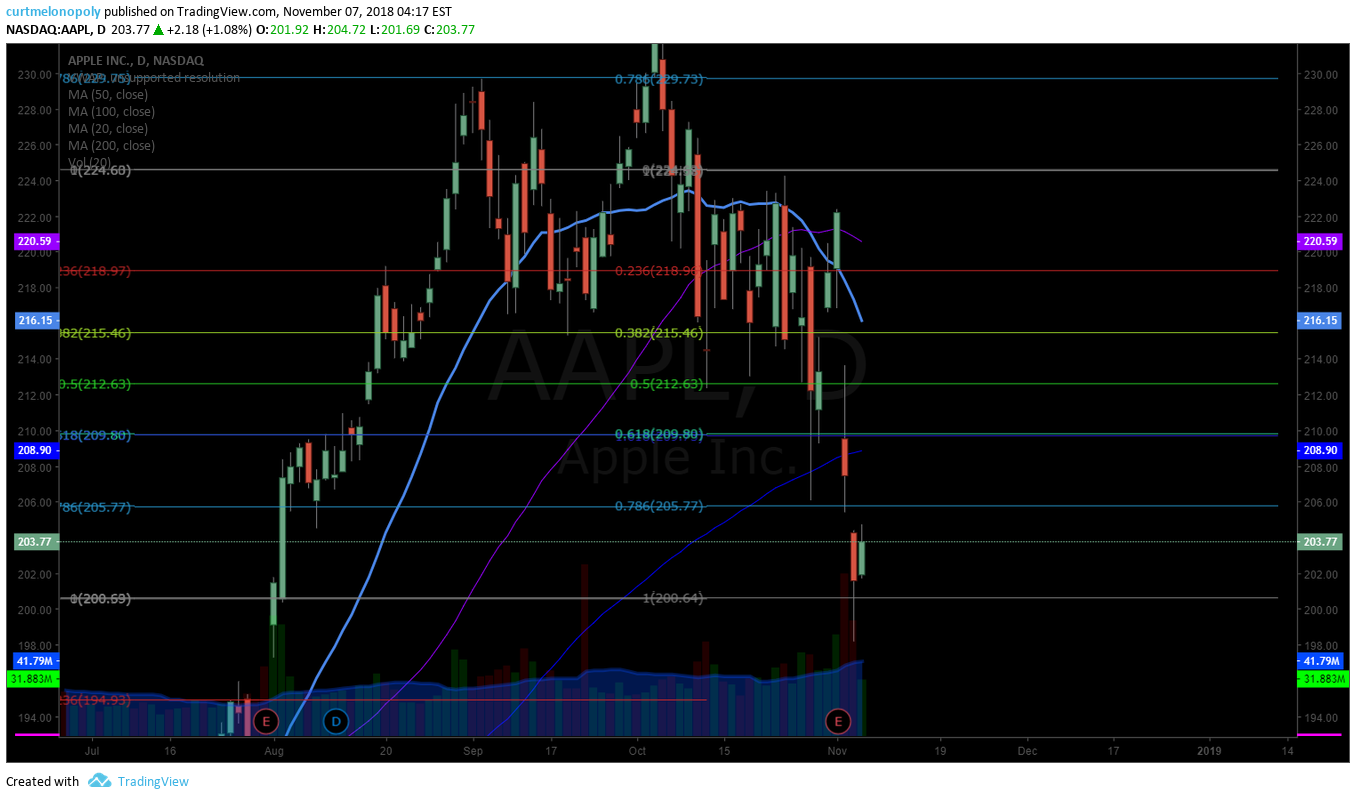
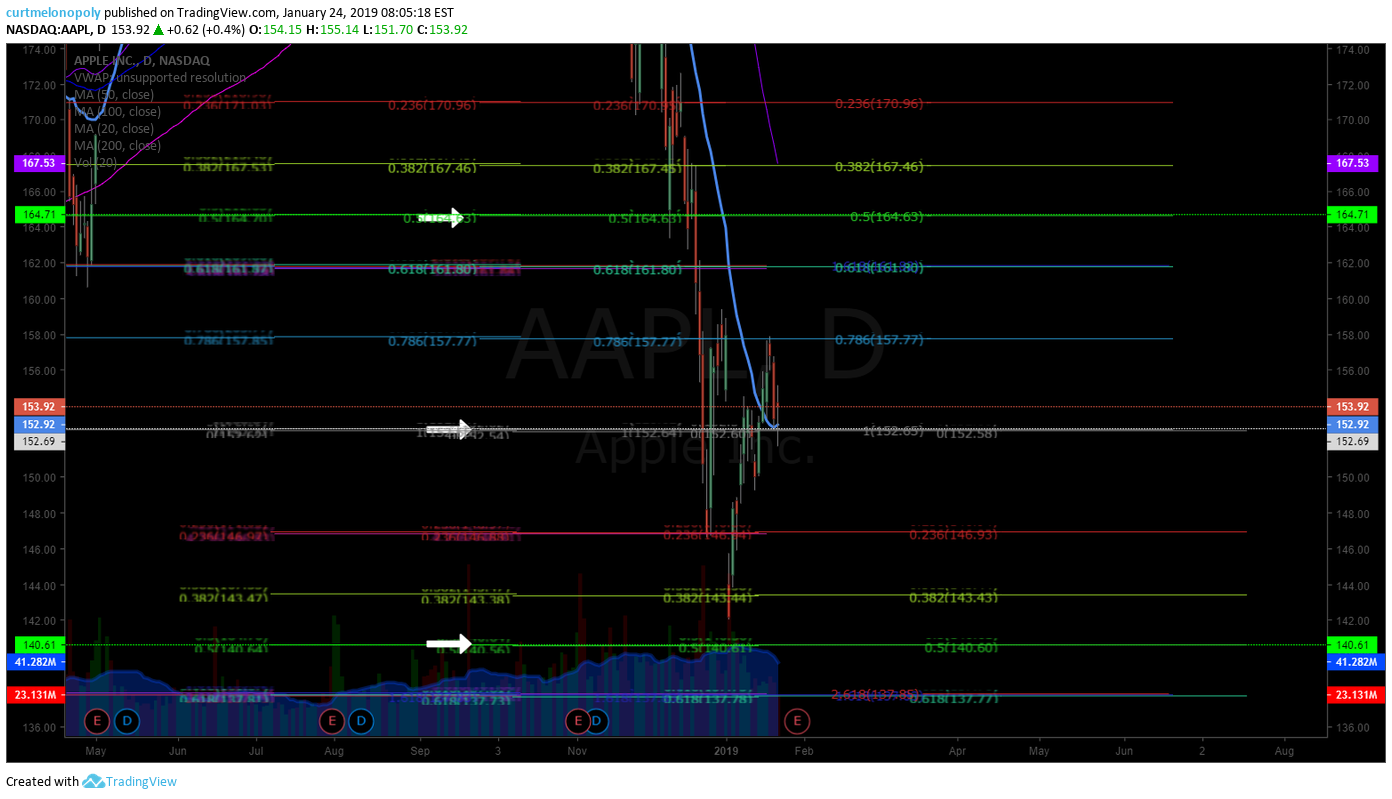
APPLE (AAPL) Trade premarket 154.40, over 152.58 long to 164.63 under short to 140.60. $AAPL #swingtrading #earnings

Jan 24 –

Support and resistance areas of the Apple Stock chart should be in play for next quarter.

https://www.tradingview.com/chart/AAPL/EvuAj8Jm-APPLE-AAPL-Trade-premarket-154-40-over-152-58-long-to-164-63/

AAPL, earnings, swing, trade, premarket
https://www.tradingview.com/chart/AAPL/EvuAj8Jm-APPLE-AAPL-Trade-premarket-154-40-over-152-58-long-to-164-63/

EAGLE MATERIALS (EXP) Nearing historical key diagonal Fib support areas for reversal trade set-up $EXP #swingtrading #earnings

Eagle Materials Schedules Third Quarter Fiscal 2019 Earnings Release and Conference Call with Senior Management 

https://finance.yahoo.com/news/eagle-materials-schedules-third-quarter-211500013.html?.tsrc=rss

Jan 24 – 

I will be looking for a reversal trade here to next resistance areas marked on chart. Trim in to them and add above according to rick tolerance and time frame.

A failure of key TL support is a divergent broken set-up and will be re-charted.

https://www.tradingview.com/chart/EXP/rZk9GDR6-EAGLE-MATERIALS-EXP-Nearing-historical-key-diagonal-Fib-suppor/

Eagle Materials, swing trade, earnings
EAGLE MATERIALS (EXP) Nearing historical key diagonal Fib support areas for reversal trade set-up $EXP #swingtrading #earnings

Email or DM me on Twitter anytime with thoughts or questions!

Cheers!

Curtis

Subscribe to Swing Trading Service:

Swing Trading Bundle (Swing Trading Newsletter and Live Swing Trading Alerts).

Swing Trading Newsletter (Weekly Newsletter Published for Traders).

Real-Time Swing Trading Alerts (Private Member on Twitter Feed and more recently by way of Email).

One-on-One Trade Coaching (Via Skype or In-Person).

Free Mailing List(s):

Join Email List for Free Trade Charting Trade Set-ups, Deals, Podcasts and Public Webinars.

Free Swing Trading Periodical Contact Form (Complimentary Swing Trade Set-Ups to Email)

Public Chat:

Visit our Free Public Chat Room on Discord.

Tweets by swingtrading_ct

Article Topics; Compound Trading, Swing, Trading, Stocks, Signals, Earnings, $AAPL, $AKS, $AMD, $AGN, $EXP

Read More
PreMarket Trading Report Wed Nov 28: #EIA, WTI, OPEC, Volatility Trade Closed, $AMD, $NVDA, $GPIC, $NTNX, $CRM …

PreMarket Trading Report Wed Nov 28: #EIA, WTI, OPEC, Volatility Trade Closed, $AMD, $NVDA, $GPIC, $NTNX, $CRM …

November 28, 2018December 30, 2018 Curt MelonopolyTrading Plan#EIA, $AMD, $CRM, $GPIC, $NTNX, $NVDA, $WTI, Day-trading, OPEC, Premarket, Stocks, Swing Trading, Trade Alerts, Trading Plan, Trading Room, Volatility Trade Closed

Compound Trading Premarket Trading Plan (Trade Alerts, Stock Market News & Chart Set-Ups) Wednesday November 28, 2018. 

In this premarket trading edition: #EIA, WTI, OPEC, Volatility Trade Closed, $AMD, $NVDA, $GPIC, $NTNX, $CRMand more.

Welcome to the morning Wall Street trading day session at Compound Trading Group.

Notices:

Notes in red text in this report are more recently important.

Scheduled Events / Platform Development / Team Work in Progress:

  • Nov 28 – Lead trader in attendance to live trading room at market open, EIA, mid day review and as required through the day and in futures trading.
  • Jen (office)Yesterday at 6:08 PM
    This week: Curtis, Jeremy (Sr. machine tech) and Katie (new machine tech) will be monitoring machine trades in oil on rotation near 24 hours a day (and going fwd). When trades are active the live trading room will be opened for EPIC and trading room members. During low liquidity hours trades will be nominal and more frequent in higher liquidity hours through each week. The first generation of the software is complete. There will be continuous updates. A rules based machine trade protocol will be published soon for members. The next to be coded is Bitcoin then SPY. Member reports are being processed now for the week also. Thank you — Jen.
  • Trade Coaching Boot Camp Cabarete Nov 30 – Dec 2, 2018 Winter Sessions Sell Out Fast (it is warm here after-all) so act fast if you plan to be here with us!  https://compoundtrading.com/trade-coaching-boot-camp-cabarete-nov-30-dec-2-2018/.
  • Team Work in Progress:
    • Rules based machine trading protocol for oil to be published soon.
    • Machine trading signals to be fed in to main trading room (initially manually then auto when api integration complete).
    • New pricing to be published representing next generation algorithm models (existing members no change).
    • Next generation algorithm models roll out (machine trading Gen 1).
    • Trading Profit and Loss to be Published for Q1, Q2, Q3 2018 (a report detailing trading / alert performance of our team).
    • Previously recorded Trading Boot Camp Event videos to become available on Compound Trading website.
    • Previously recorded Master Class Videos will become available for download on website.
    • New Trading Boot Camp Events to be announced
      • 1 day Bootcamps in November / December 2019 for each of the seven trading models and swing / daytrading – 8 in total to be announced (online only).
  • Sept 18 – Raw Trading Boot Camp Videos were emailed to members (new members inquire for copy).
  • Sept 18 – Previously recorded Master Class Series were emailed to members (new members inquire for copy).

Premarket Report: Per lead trader availability basis only (the pre-market reports are not published every market day – they are a way for our team to communicate with our member clients and update market conditions when time allows).

Private Member Discord Server Chat Rooms: BE SURE to get in to each private Discord server specific to your specific subscription type (bundles) – many of the updates as we go forward will be posted in there and detailed trading plans for alerted trades are often discussed by our lead trader in the rooms. This includes the SWING TRADING platform also. IF YOU NEED A LINK / INVITE email us.

https://twitter.com/CompoundTrading/status/880670140454637569

Real-time Trade Alerts:

Real-time Trade Alerts for Oil, Swing Trading, Day Trading, Bitcoin are available to subscribers by following specific alert Twitter feeds.

Oil Trading Alerts, Swing Trading Alerts, Day Trading Alerts, Bitcoin Trading Alerts.

Disclaimer / Disclosure, Terms of Use:

Subscribers: read disclaimer.

Blog / Video / Social Posts / Learn to Trade: 

#BitcoinTrading 101: A Beginner’s Guide to Getting Started $BTCUSD $XBTUSD $BTC https://compoundtrading.com/bitcointrading-101-beginners-guide-getting-started-btcusd-xbtusd-btc/ …

https://twitter.com/CompoundTrading/status/927397024315662336

How to Use EPIC Oil Algorithm: $USOIL, $WTI, $CL_F, $USO, $UCO, $SCO, $UWT, $DWT, #OIL, #OOTT: http://youtu.be/hawVV31G9bg?a via @YouTube

https://twitter.com/CompoundTrading/status/889148655785177088

How to Use ROSIE Gold Algorithm: #GOLD, $GLD, $XAUUSD, $GDX, $GDXJ, $NUGT, $DUST, $JNUG, $JDST

https://twitter.com/CompoundTrading/status/889147527278333952

Some Recent Chart / Trade Set-Up Reports: 

See YouTube, member email direct reports and blog for other recent videos or blog posts. Listed from most recent. Much of the premium member reporting posted below is delayed and may or may not require password.  

Nov 18 – Swing Trading Special Report Series (Part D) Sun Nov 18 NFLX, MTEM, PYX, XXII, PRQR, BOX, GTHX, SSW, HIIQ …

Nov 7 – Swing Trading Special Report Series (Part C) Nov 7 AAPL, BABA, AMD, EDIT, CARA, OSIS, BZUN, NIHD…

Oct 30 – The Best Crude Oil Day Trading Signal Available | It Happened Again Today for 153 Tick Gain Intra-Day.

Oct 29 – Swing Trading Special Report Series (Part B) Mon Oct 29 SQ, AGN, BOX, PRQR, NBEV, PYX, NFLX, BLDP, LEVB, DIS.

Oct 28 – Crude Oil Trading Strategy | Technical Analysis & Guidance.

Oct 23 – Crude Oil Trading Strategy: Career Trade Set-Up. Technical Analysis Trading Room w/ Video.

Oct 20 – Crude Oil Algorithmic Trading: A Simple Strategy That Wins – Real Life Example.

Oct 17 – Daytrading Crude Oil: Buy Sell Signals Strategy for Intra-day Sell Off Reversal.

Oct 15 – Crude Oil Trading Strategies: This Is It. How To Trade Crude Oil’s Next Move.

Oct 8 – Crude Oil Trading Strategy – How I Will be Trading Oil in to Time Cycles.

Oct 7 – How I Will Be Trading Bitcoin in to Increased Volatility (We Expect) Next Two Quarters.

Oct 4 – Day Trading: Trading Momentum Stocks With A Catalyst Using Technical Analysis. Case Example $ROKU.

Oct 2 – Swing Trading Alerts (w / video) VIX, Gold, Silver, Tesla $TSLA, $LEVB, $BTC, $EDIT, $PYX and more.

Oct 3 – Oil Trading Room – Oil Trading Signals with Lead Trader (plus video).

Sept 28 – Swing Trading. How to Swing Trade Using Technical Analysis. Our SQUARE $SQ Trade As Example #swingtrading

Recent Educational Articles / Videos:

I get a lot of Questions on How to Trade our Structured Chart Models, this video has 5 min starter explanation at 1:00 min-6:00 min. https://www.youtube.com/watch?v=QrXbE7lojAg&t=3s … – Fibonacci Trend-lines, Trading structure/quads, Price targets, Main support resistance (buy sell triggers), Time cycles, Moving averages, Trading trims/adds.

Trading Plan / Watch Lists. Morning Momentum / Gaps / News / PR / IPO / SEC Filings / Earnings Stocks on Watch: 

Watching time-cycle expiry / inflection for a direction in to next late Dec and then late Dec in to first quarter time cycle 2019.

There is a volatility time-cyle (monthly) coming in at Dec 5 so we are looking for a possible bounce in to that date and shortly thereafter.

Watching EIA closely today for structure in the current trading quad, it has been constructive of late.

Possible short $DWT on the day based on rise in premarket.

Per previous;

Nov 21 – Looking at possible retrace to .5 on oil (per last move), possible short in Natural Gas (DGAZ) and watching equities very close for supports to bounce and hold.

If you’re a newbie…. now is not the time to turn off…. now is the time to get in to your $STUDY sharpen your pencil and get to work. You’ll learn a lot and you’ll possibly catch a turn and change your financial life soon. You won’t get many opportunities like this. #premarket

If you're a newbie…. now is not the time to turn off…. now is the time to get in to your $STUDY sharpen your pencil and get to work. You'll learn a lot and you'll possibly catch a turn and change your financial life soon. You won't get many opportunities like this. #premarket

— Melonopoly (@curtmelonopoly) November 20, 2018

Time cycle dates expiring in markets for big moves…. started end of July, next Oct 10, Nov 11, mid Dec big in to Q1 19. Distributing trading models starting tonight for time frames in expectation for #Oil, #Gold, #Silver, #Bitcoin, #SP500, #Volatility, #USD It’s big, watch.

Further to that public Twitter post, over next two quarters I expect the equity markets to continue under serious pressure in to rates, after a technical retracement oil to skyrocket unless Trump can get a handle on the price somehow (trying with Saudi’s now), Dollar likely to spike hard for some time then fall off a cliff, volatility to increase, Gold and Silver get up and going soon and Crypto to fly. That’s my bias, thesis, trading plan in to next two quarters. Timing will be key. All of our reporting will reflect this near term and will also focus on key swing trading set-ups within themes.

Time cycle dates expiring in markets for big moves…. started end of July, next Oct 10, Nov 11, mid Dec big in to Q1 19. Distributing trading models starting tonight for time frames in expectation for #Oil, #Gold, #Silver, #Bitcoin, #SP500, #Volatility, #USD It's big, watch.

— Melonopoly (@curtmelonopoly) October 8, 2018

Market Observation:

Markets as of 7:51 AM: US Dollar $DXY trading 97.36, Oil FX $USOIL ($WTI) trading 51.45, Gold $GLD trading 1214.15, Silver $SLV trading 14.15, $SPY 269.70 (premarket trade), Bitcoin $BTC.X $BTCUSD $XBTUSD 4017.00 and $VIX trading 18.6.

Momentum Stocks / Gaps to Watch: 

22 Stocks Moving In Wednesday’s Pre-Market Session https://benzinga.com/z/12763192 $GPIC $NTNX $CRM $BURL $SWPH $JILL $SINA $WB $CHS $SMRT $TIF $SJM $GWPH $GNL

News: 

Wayfair shares soar premarket after company says direct retail sales rose 58% over holiday weekend.

AMD, Nvidia stocks rise after Mizuho says GPU prices are rebounding #swingtrading $AMD $NVDA

AMD, Nvidia stocks rise after Mizuho says GPU prices are rebounding #swingtrading $AMD $NVDA https://t.co/w5opqHarb8

— Swing Trading (@swingtrading_ct) November 28, 2018

Recent SEC Filings / Insiders:

Recent IPO’s:

Earnings:

$DKS Dick’s Sporting Goods’ stock surges after earnings beat, raised outlook https://on.mktw.net/2AuTNEz

Chico’s stock plummets toward 9 1/2-year low after earnings and sales miss, lowered outlook

#earnings for the week

$CRM $WB $SPLK $NTNX $DLTR $DKS $TIF $BURL $PANW $BOX $DSX $ZUO $BNS $JKS $SINA $GWPH $VEEV $ANF $CBRL $HIBB $KSHB $VMW $AMBA $HMLP $WDAY $DAVA $RY $SJM $GME $JILL $VJET $AMWD $ITRN $TD $PAGS $KNOP $TLYS $BKE $GSM $HPQ $TECD

http://eps.sh/cal

#earnings for the week $CRM $WB $SPLK $NTNX $DLTR $DKS $TIF $BURL $PANW $BOX $DSX $ZUO $BNS $JKS $SINA $GWPH $VEEV $ANF $CBRL $HIBB $KSHB $VMW $AMBA $HMLP $WDAY $DAVA $RY $SJM $GME $JILL $VJET $AMWD $ITRN $TD $PAGS $KNOP $TLYS $BKE $GSM $HPQ $TECD https://t.co/r57QUKKDXL https://t.co/jLnh9OtyI6

— Melonopoly (@curtmelonopoly) November 26, 2018

Trade Set-up Alerts, Charts & Reports. Recent / Current Holds, Trade Alerts, Open and Closed Trades:

Please refer to the date at top left of each chart (charts are often carried forward for some time). Trade alerts and stock chart set-ups should be traded as decision to decision process – when the trade set-up fails cut your position fast. Leg in to the winners at key resistance and support (at retracement or breach) and exit the losers fast based on technical support and resistance. Not all set-ups work, the purpose of technical analysis is to provide the framework for your trade (the chart structure enables the trader to set stops where a trade is a failed trade and leg in to winners and trim winners per the chart). The purpose of trade alerts is to bring awareness of the trade set-up in play but you have to execute the trade based on your trading strategy that should be harnessed in your rules based process.

There have been a few paper cuts executed on machine trading side in oil trade last few days – report will detail when released.

Volatility lower but we’re watching in to Dec 5 and lower supports near bollinger for possible bounce $VIX #volatility

VIX, volatility, chart, premarket
volatility lower but we’re watching in to Dec 5 and lower supports near bollinger for possible bounce $VIX #volatility

Volatility short TVIX trade went well. $VIX $TVIX Looking for a bounce in to Dec 5 #volatility #trading

Volatility, trade, alert, VIX
Volatility short TVIX trade went well. $VIX $TVIX Looking for a bounce in to Dec 5 #volatility #trading

TVIX premarket trading down. We are short Volatility from last Wednesday in 49s #premarket #volatility $VIX

TVIX, premarket, trade, alert, VIX, short
TVIX premarket trading down. We are short Volatility from last Wednesday in 49s #premarket #volatility $VIX

SP500 (SPY) Daily Chart MACD turned up but structure under pressure. $SPY $ES_F $SPXL $SPXS #SPY #SwingTrade

SP500, daily, chart
SP500 (SPY) Daily Chart MACD turned up but structure under pressure. $SPY $ES_F $SPXL $SPXS #SPY #SwingTrade

To catch a knife 🙂 Daytrading crude oil #OOTT #oiltradealerts $CL_F FX USOIL WTI $USO

To catch a knife 🙂 Daytrading crude oil #OOTT #oiltradealerts $CL_F FX USOIL WTI $USO pic.twitter.com/R8n63CV72i

— Melonopoly (@curtmelonopoly) November 13, 2018

The crude oil trade on the 1 minute chart, continue to watch the support levels signaled earlier. #crude #oiltradealerts

crude, oil, trading, alert
The crude oil trade on the 1 minute chart, continue to watch the support levels signaled earlier. #crude #oiltradealerts

if crude lets go here watch out…. yet again

if crude lets go here watch out…. yet again

— Melonopoly (@curtmelonopoly) November 13, 2018

Where can you find a trading setup that executes for a 150+ tick day trade in crude oil with back tested win side probability 90%. Test it and tell us we’re wrong. Member report below. $USOIL $WTI $CL_F #OIL #trading #OOTT

https://twitter.com/EPICtheAlgo/status/1057464025750138881

$TSLA #premarket jam. Closed 263.75 – 338.75 was a good one. Next! #swingtrade

$TSLA #premarket jam. Closed 263.75 – 338.75 was a good one. Next! #swingtrade pic.twitter.com/M4NDXkdoMi

— Melonopoly (@curtmelonopoly) October 29, 2018

Machine trade in oil top tick hit perfect 67.62 to penny HOD, trimmed added numerous all win side and closed 90% 66.83. Nice trade.

crude, oil, trade, alert
Machine trade in oil top tick hit perfect 67.62 to penny HOD, trimmed added numerous all win side and closed 90% 66.83. Nice trade.

Crude oil trade in to open yesterday: Nailed the Crude Oil Short in Trading Room at Open.

crude, oil, trade, alerts, short
Nailed the Crude Oil Short in Trading Room at Open USOIL WTI $USO $CL_F $UWTI $DWTI #Oil #Trade #Alerts

Trade alert this morning to trim Silver and add above: Trimming Silver 14.78 per price target will add above.

swing, trade, alert, silver
Trimming Silver 14.78 per price target will add above #swingtrading #alerts $SLV

Trade alert yesterday : Long Silver 14.63 target 14.78 tight stops.

trading, alerts, SLV
Long Silver 14.63 target 14.78 tight stops. #swingtrading #tradealerts #Silver

Daytrading Crude Oil – Screen Shot of Oil Trade Alerts Feed with signals for long oil trade and closing trade.

daytrading, crude, oil ,signals
Daytrading Crude Oil – Screen Shot of Oil Trade Alerts Feed with signals for long oil trade and closing trade.

TESLA (TSLA) daytrade with swing trade possible here to higher, we got some of that move at open. $TSLA #trading

TESLA (TSLA) daytrade with swing trade possible here to higher, we got some of that move at open. $TSLA #trading pic.twitter.com/6Kjglgconf

— Melonopoly (@curtmelonopoly) October 16, 2018

That spike in Sunday night oil futures open was interesting (on Saudi Trump news flow), caught me off guard but I got a piece of it $USOIL $WTI $CL_F $USO #OilTradeAlerts #OOTT

That spike in Sunday night oil futures open was interesting (on Saudi Trump news flow), caught me off guard but I got a piece of it $USOIL $WTI $CL_F $USO #OilTradeAlerts #OOTT pic.twitter.com/vlOAl0ze6A

— Melonopoly (@curtmelonopoly) October 16, 2018

Crude, oil, trading, alerts
That spike in Sunday night oil futures open was interesting (on Saudi Trump news flow), caught me off guard but I got a piece of it $USOIL $WTI $CL_F $USO #OilTradeAlerts #OOTT

Working the daytrade edges on SP500 $SPY #daytrading #tradealerts

Working the daytrade edges on SP500 $SPY #daytrading #tradealerts pic.twitter.com/tcbGIESXQF

— Melonopoly (@curtmelonopoly) October 9, 2018

Working the edges of volatility on daytrading time-frames today also $VIX $TVIX $UVXY #tradealerts #daytrading

Working the edges of volatility on daytrading time-frames today also $VIX $TVIX $UVXY #tradealerts #daytrading pic.twitter.com/1on7qS3aYJ

— Melonopoly (@curtmelonopoly) October 9, 2018

Example of knowing probability of time cycles (intra-day example). Look at the guidance in the oil trading room…. exact time of day and price of oil hit per guidance many hours earlier. Power of time cycles. FX $USOIL $WTI $CL_F $USO #oil #trading #algorithm

Example of knowing probability of time cycles (intra-day example). Look at the guidance in the oil trading room…. exact time of day and price of oil hit per guidance many hours earlier. Power of time cycles. FX $USOIL $WTI $CL_F $USO #oil #trading #algorithm pic.twitter.com/qa0HueviTl

— Melonopoly (@curtmelonopoly) October 9, 2018

This was an intra-day time cycle trade. I win when I respect time cycles, lose when I don’t. It is that simple.

This was an intra-day time cycle trade. I win when I respect time cycles, lose when I don't. It is that simple. https://t.co/k4HO2izAT7

— Melonopoly (@curtmelonopoly) October 9, 2018

$ROKU #daytrading #tradealerts

$ROKU #daytrading #tradealerts pic.twitter.com/RWXQcogTll

— Melonopoly (@curtmelonopoly) October 1, 2018

Market Outlook, Market News and Social Bits From Around the Internet:

Futures higher on hopes of trade breakthrough; Powell speech in focus

Futures higher on hopes of trade breakthrough; Powell speech in focus https://t.co/IPZPh7IrIf

— Reuters (@Reuters) November 28, 2018

If you are new to our trading service you should review recent blog posts, the Compound Trading YouTube Channel and at minimum our algorithm Twitter feeds because they do tell a story in terms of the market and how the inflections of the market determine our day to day trading. You will notice the algorithmic modelling has been undeniably accurate with many time-frames (intra-day, weeks and months out) so I myself have learned to respect the math (they have taken me from a 60% hit rate to 80%+ all publicly posted live trade alerts).

Momentum Stocks (Market Open and Intra-Day):

I do trade morning momo stocks, but I do avoid much of the day trading risk (preferring to daytrade only what is structurally set-up also on the swing trade side and to my advantage in the algorithmic model charting). I often avoid the first 30 minutes (gap and go) and trade momentum stocks or structured (per explanation in previous sentence) stocks later in day after a wash-out looking for a snap-back trade that can possibly also become a strong swing or longer term trade that I can leg in to. Just prior to open and shortly after open I post momentum stocks to the trade chat room (and Twitter and Stocktwits if I have time).

Some of my Favorite Intra-day Trading Set-Ups:

(1) Momentum Stock Wash-Outs for Snap Back, (2) Bad News Wash-outs on Stocks with High Institutional Ownership, (3) Getting on the Right Side of a Trend Change and scaling in my position and (4) Our Algorithm Charting Model Set-Ups.

The momentum stocks (from previous days and morning trade) I continue to watch through the day for indicators that allow a trade.

Morning Stock Watch-Lists for my Favorite Set-Ups:

(1) Pre-Market Gainers Watch-List: $GPIC $IPCI $CMCM $MBRX $UGAZ $CRMD $NTNX $PXS $CRM $GSM $BURL $ANY $AFSI $WB $INFY $BITA $UNG

(2) Pre-market Decliners Watch-List :

(3) Other Watch-List:

(4) Regular Algo Charting Watch-List: Gold $GC_F $GLD, Miners $GDX ($NUGT, $DUST, $JDST, $JNUG), Silver $SLV $SI_F ($USLV, $DSLV), Crude Oil FX: $USOIL $WTI ($UWT, $DWT, $USO, $UCO, $CL_F, $UWT, $DWT), Natural Gas $NG_F ($UGAZ, $DGAZ), S & P 500 $SPY $ES_F ($SPXL, $SPXS), US Dollar Index $DXY ($UUP), Volatility $VIX ($TVIX, $UVXY), $BTCUSD Bitcoin.

(5) Recent Upgrades: $DVA $SWKS $AZPN $SIVB $ZAYO $SAVE $OOMA $IMO $ONDK $ALK $AMX $TGP $SIVB $AZPN

Stifel upgrades $TGP from Hold to Buy

$AMZN: EVERCORE ISI RAISES PRICE TARGET TO $1990 FROM $1970

(6) Recent Downgrades: $BECN $WHR $EV $ECA $CME $TLP $TI $CBRL $CRNT $WHR


Stay tuned in Stock Chat Room for more pre-market stocks on watch.

Study:

For new readers, a review of our unlocked posts on our blog would help you get in to the story we are following with the securities listed in this newsletter.

Free scanners to find momentum stocks that you can easily review charts of for indicators that bring probability of your trade being successful up considerably. These are not useful for first 30 minute market open gap and go type plays (you need a good momentum scanner, level 2, and best to have hot-keys for the first 30 mins of gap and go trading)… but are very useful for intra day scalping and swing trading (start with trending stocks and then look at indicators intra for simple set-ups – study scan study scan study scan).

http://finviz.com/

https://finance.yahoo.com/screener/predefined/ec5bebb9-b7b2-4474-9e5c-3e258b61cbe6

http://www.highshortinterest.com/

http://www.gurufocus.com/short-stocks.php

http://www.3xetf.com/all/

http://www.etf.com/channels/gold-etfs

GL!

Curtis

Algorithm Twitter feeds can be found here: $BTC (@CryptotheAlgo) $WTI (@EPICtheAlgo), $VIX (@VexatiousVIX), $SPY (@FREEDOMtheAlgo), $GLD (@ROSIEtheAlgo), $SLV (@SuperNovaAlgo), $DXY (@DXYUSD_Index). Our Swing Trading Twitter feed is found here: https://twitter.com/swingtrading_ct. Our lead trader Twitter feed is here @curtmelonopoly

Article Topics: Premarket, Stocks, Trading Plan, Trade Alerts, Trading Room, Swing Trading, Day Trading, #EIA, WTI, OPEC, Volatility Trade Closed, $AMD, $NVDA, $GPIC, $NTNX, $CRM

Read More
Swing Trading Special Report Series (Part C) Nov 7 AAPL, BABA, AMD, EDIT, CARA, OSIS, BZUN, NIHD…

Swing Trading Special Report Series (Part C) Nov 7 AAPL, BABA, AMD, EDIT, CARA, OSIS, BZUN, NIHD…

November 7, 2018April 14, 2019 Swing TraderSwing Trading$AAPL, $AMD, $BABA, $BZUN, $CARA, $EDIT, $NIHD, $OSIS, Alerts, Signals, Stocks, Swing, Trading

Compound Trading Swing Trade Report Wednesday November 7, 2018 (Part C).

Swing Trading Signals and Stock Picks In this Issue: $AAPL, $BABA, $AMD, $EDIT, $CARA, $OSIS, $BZUN, $NIHD …     . 

Email us at [email protected] anytime with any questions about any of the swing trades listed below. Or, if we get bogged down private message Curtis in trade room or direct message him on Twitter. Market hours are tough but we endeavor to get back to everyone after market each day.

Notices:

Below is Part C of this special swing trading report series covering stocks that we have recently been trading or have been active stocks traded by our members and/or stocks that were recently covered at the Trade Coaching Boot Camp. Part A of this swing trading special series can be found here and Part B of the swing trade report here.

Basically we are consolidating all the most recent swing trade strategies in to a few reports prior to earnings season kicking in.

After this short series of reports we will return to the regular rotational reports and also introduce some themed swing trading reports (we have one for swing trading pot stocks, we are working on a financials report and an energy special report currently). 

Swing trading set-ups in this short series of reports will provide charting and trade signals for the following equities; FEYE, ROKU, SHOP, ARWR, TSLA, AGN, CRON, SQ, XBIO, FB, DIS, LEVB, NBEV, NIHD, BZUN, BLDP, AMD, OSIS, CARA, BABA, EDIT, AAPL, NFLX, MTEM, PYX, XXII, PRQR, BOX, GTHX, SSW, HIIQ, ATHM, ESPR, CALA, APVO, MOMO, GSUM, CLDR, FIT among others. If you have any swing trading charting requests send them to us on email. The first of the trading set-ups in this series are included below.

Until mid July 2018 we distributed one swing trading report (1 of 5 in rotation) with a mandate being one report per week on average cycling the five reports that include over one hundred equities every five weeks (approximately).

Commencing July 2018 we switched up our swing trading service to also include special reports for earnings season, special trade set-ups, and swing trade alerts direct to your email inbox. Per above, soon we will also be producing themed reports.

When managing your trades with the weekly reports keep in mind that you will have to invest an hour or two a week to check the indicators mentioned for buy and sell triggers. I was asked recently why we do not usually (although we do sometimes) include precise entry and exit points. The reason is simple, they don’t work – those services have terrible results.

Swing trading success, even with a service, does require “some” maintenance on the part of the user, although the new live alert service will take much of that burden off the user as we know many of our users have busy lives. It is the indicators lining up that signal a trade long entry or an exit. In our case we rely heavily on the natural trading structure of the financial instrument; including the MACD on daily or weekly, Stochastic RSI, Moving Averages, trading boxes, quadrants, Fibonacci support and resistance, trend lines, trajectory / trend of trade, time-cycles and more.

Indicators we base trade entry and exits on are at times listed with each trade posted so any user that does even moderate trade management will know when the indicator(s) have turn with or against the trade (here again it is wise to have at least a basic understanding of trading structures because you need to be able to respond to your own trading rules based process).

It is critical that you attend to the maintenance of your signals at least once a week if not twice and set stops and preferably alarms so that intra-week you can enter / exit or add / trim as required.

If you need help with rules based swing trading technical analysis, a specific trading plan (entries, exits, adds or trims) or with a simple understanding of proper structured charting and/or trading structured set-ups you can book some trade coaching time and we will assist you with your trade planning as needed. You may find after a few hours of trade coaching that this is all you need to become a proficient profit side trader.

We can schedule private coaching online, you can attend a trading boot-camp (online or in person) or order the downloadable recordings of a recent trading boot-camp or master class series (each about 20 hours of training per event). For any of those options email us for details.

Below is a primer if you know none or very little about proper chart structures:

“I get a lot of Questions on How to Trade our Structured Chart Models, this video has 5 min starter explanation at 1:00 – 6:00 min”. https://www.youtube.com/watch?v=QrXbE7lojAg&t=3s … – Fibonacci Trend-lines, Trading structure/quads, Price targets, Main support resistance (buy sell triggers), Time cycles, Moving averages, Trading trims/adds.

Intra-week you can DM myself on Twitter (@curtmelonopoly), visit me on Discord (http://discord.gg/2HRTk6n) and private message me or email me ([email protected]) with specific questions regarding trades you are considering. You can also visit the main trading during the mid-day review and ask questions by text in the chat area of the room.

IF WE DON’T GET BACK TO YOU RIGHT AWAY it is usually because we are pressured with reporting deadlines or are in a trading session.

Also, as live charts are made available below, click on link and open viewer. Then to use chart yourself click on share button at bottom right (near thumbs up) and then click “make it mine”.

Newer updates are in red type for ease of review.

Recent Compound Trading Videos and/ or Blog Posts for Swing Traders / Charting Set-Ups:

See You Tube for other recent video posts. Listed from most recent. For newer members, if you need a password for a locked historical post please email us your request.

Oct 28 – Crude Oil Trading Strategy | Technical Analysis & Guidance.

Oct 23 – Crude Oil Trading Strategy: Career Trade Set-Up. Technical Analysis Trading Room w/ Video.

Oct 20 – Crude Oil Algorithmic Trading: A Simple Strategy That Wins – Real Life Example.

Oct 17 – Daytrading Crude Oil: Buy Sell Signals Strategy for Intra-day Sell Off Reversal.

Oct 15 – Crude Oil Trading Strategies: This Is It. How To Trade Crude Oil’s Next Move.

Oct 8 – Crude Oil Trading Strategy – How I Will be Trading Oil in to Time Cycles.

Oct 7 – How I Will Be Trading Bitcoin in to Increased Volatility (We Expect) Next Two Quarters.

Oct 4 – Day Trading: Trading Momentum Stocks With A Catalyst Using Technical Analysis. Case Example $ROKU.

Oct 2 – Swing Trading Alerts (w / video) VIX, Gold, Silver, Tesla $TSLA, $LEVB, $BTC, $EDIT, $PYX and more.

Oct 3 – Oil Trading Room – Oil Trading Signals with Lead Trader (plus video).

Sept 28 – Swing Trading. How to Swing Trade Using Technical Analysis. Our SQUARE $SQ Trade As Example #swingtrading

Sept 26 – Trade Alerts | Day Trade & Swing Trades (w / video) Trading Square $SQ, $DIS, $NFLX, $AMD, OIL, $FB, $GOOGL and more.

Sept 25 – Crude Oil Trading Room – Member Oil Trade Signals / Alerts for Trading the EIA Report (w/ video)

Current Swing Trading Signals and Stock Charts.

NII Holdings (NIHD) swing trade alert over trade box 7.79 targets 9.31, 10.89, 12.31.

https://www.tradingview.com/chart/NIHD/E3AVpv2p-NII-Holdings-NIHD-swing-trade-alert-over-trade-box-7-79-target/

NIHD, swing, trade, alert
NII Holdings (NIHD) swing trade alert over trade box 7.79 targets 9.31, 10.89, 12.31. $NIHD #swingtrade #alerts

Why NII Holdings Stock Just Popped 19%
Rich Smith, The Motley Fool
Motley Fool November 2, 2018

https://finance.yahoo.com/news/why-nii-holdings-stock-just-204100872.html?.tsrc=rss

BAOZAN (BZUN) ER 15 days. Trading 44.58 over 46.75 targets 50.00, under 43.24 targets 37.08. 

https://www.tradingview.com/chart/BZUN/vLwlE21O-BAOZAN-BZUN-ER-15-days-Trading-44-58-over-46-75-targets-50-00/

BZUN, earnings, trade, alert
BAOZAN (BZUN) ER 15 days. Trading 44.58 over 46.75 targets 50.00, under 43.24 targets 37.08. $BZUN #tradealerts #earnings

3 Top Small-Cap Stocks to Buy in November https://finance.yahoo.com/news/3-top-small-cap-stocks-195600069.html?soc_src=social-sh&soc_trk=tw

ADVANCED MICRO (AMD) MACD turning up, bullish signal. Over 20.55 targets 24.15. Under 18.28 targets 14.67.

https://www.tradingview.com/chart/AMD/yfckuXxy-ADVANCED-MICRO-AMD-MACD-turning-up-bullish-signal-Over-20-55/

AMD, swingrading
AMD celebrates Election Day with a political rally of its own. https://on.mktw.net/2zvLWGk

OSI SYSTEMS (OSIS) MACD turn up on daily with symmetrical chart in play, bullish bias to upper target. 

https://www.tradingview.com/chart/OSIS/xEkcRW3H-OSI-SYSTEMS-OSIS-MACD-turn-up-on-daily-with-symmetrical-chart/

$OSIS, swingtrading, chart, symmetry
OSI SYSTEMS (OSIS) MACD turn up on daily with symmetrical chart in play, bullish biad to upper target. $OSIS #tradealerts #swingtrading

Edited Transcript of OSIS earnings conference call or presentation 25-Oct-18 8:30pm GMT

https://finance.yahoo.com/news/edited-transcript-osis-earnings-conference-041011066.html?.tsrc=rss

CARA THERAPEUTICS (CARA) Structured chart. Watching the 21.80 pivot area for next trade.

https://www.tradingview.com/chart/CARA/b4krodvQ-CARA-THERAPEUTICS-CARA-Structured-chart-Watching-the-21-80-pi/

CARA, chart
CARA THERAPEUTICS (CARA) Structured chart. Watching the 21.80 pivot area for next trade. $CARA #swingtrade

3 Top Small-Cap Stocks to Buy Right Now $CARA #swingtrading https://finance.yahoo.com/news/3-top-small-cap-stocks-135300031.html?soc_src=social-sh&soc_trk=tw

ALIBABA (BABA) trading at primary pivot on chart. On watch for a trade. 

https://www.tradingview.com/chart/BABA/SpOEEYln-ALIBABA-BABA-trading-at-primary-pibot-on-chart-On-watch-for-a/

BABA, swing trade, chart
ALIBABA (BABA) trading at primary pibot on chart. On watch for a trade. $BABA #swingtrade

Alibaba (BABA) Outpaces Stock Market Gains: What You Should Know.

https://finance.yahoo.com/news/alibaba-baba-outpaces-stock-market-224510428.html?.tsrc=rss

EDITAS MEDICINE (EDIT) on watch with earning. Symmetry likely continues.

https://www.tradingview.com/chart/EDIT/xxuKkjbR-EDITAS-MEDICINE-EDIT-on-watch-with-earning-Symmetry-likely-co/

EDIT, swing trade, on watch, earnings
EDITAS MEDICINE (EDIT) on watch with earning. Symmetry likely continues. $EDIT #swingtrade #earnings

 5 Drug/Biotech Stocks Set to Trump Estimates in Q3 Earnings $EDIT https://finance.yahoo.com/news/5-drug-biotech-stocks-set-125512591.html?soc_src=social-sh&soc_trk=tw

APPLE (AAPL) premarket trading 206.70 with resistance 209.80 212.63 next. More on chart.

https://www.tradingview.com/chart/AAPL/aU4tfZoc-APPLE-AAPL-premarket-trading-206-70-with-resistance-209-80-212/

APPLE, chart, premarket, swing trade
APPLE (AAPL) premarket trading 206.70 with resistance 209.80 212.63 next. More on chart. $AAPL #premarket #trading

Cramer: Charts suggest Apple’s stock could bottom this week and then soar to new highs $AAPL #swingtrading https://cnb.cx/2Per0OB

Email or DM me on Twitter anytime with thoughts or questions!

Cheers!

Curtis

Subscribe to Swing Trading Service:

Swing Trading Bundle (Swing Trading Newsletter and Live Swing Trading Alerts).

Swing Trading Newsletter (Weekly Newsletter Published for Traders).

Real-Time Swing Trading Alerts (Private Member on Twitter Feed and more recently by way of Email).

One-on-One Trade Coaching (Via Skype or In-Person).

Free Mailing List(s):

Join Email List for Free Trade Charting Trade Set-ups, Deals, Podcasts and Public Webinars.

Free Swing Trading Periodical Contact Form (Complimentary Swing Trade Set-Ups to Email)

Public Chat:

Visit our Free Public Chat Room on Discord.

Tweets by swingtrading_ct

Article Topics; Compound Trading, Swing, Trading, Stocks, Signals, Alerts, AAPL, BABA, AMD, EDIT, CARA, OSIS, BZUN, NIHD

Read More
PreMarket Trading Plan Wed Sept 26: EIA, Crude Oil, Fed, $ALDX, $SQ, $NKE, $SVMK, $GPRO, $DIS, $AMD more.

PreMarket Trading Plan Wed Sept 26: EIA, Crude Oil, Fed, $ALDX, $SQ, $NKE, $SVMK, $GPRO, $DIS, $AMD more.

September 26, 2018October 3, 2018 Curt MelonopolyTrading Plan#EIA, $ALDX, $AMD, $DIS, $GPRO, $NKE, $SQ, $SVMK, Crude Oil, Day-trading, Fed, Premarket, Stocks, Swing Trading, Trade Alerts, Trading Plan, Trading Room

Compound Trading Premarket Trading Plan (Trade Alerts, Stock Market News & Chart Set-Ups) Wednesday September 26, 2018. 

In this premarket trading edition: $ALDX, $SQ, $NKE, $SVMK, $DIS, $OSIS, $BLDP, $LEBV, $CRON, $NBEV, $NFLX, $FB, $SHOP, OIL, $EDIT, $BABA, $GTHX, $AGN, $ROKU, $CVM, $XXII, $MOMO, $SPY, $DXY, $BOX, $CARA, $PROQR, $XBIO, $AAPL, $ARWR, $VIX, $BTC and more.

Welcome to the morning Wall Street trading day session at Compound Trading Group.

Notices:

Notes in red text in this report are more recently important.

Scheduled Events:

  • Sept 26 – Lead trader booked for main trading room for market open, #EIA report crude oil trading at 10:30, mid day review and futures trading this evening (as available and as market demands).
  • September Live Trading Room Challenge, Coaching, News, Events, Q & A and More: information for existing members, those asking about our services and new on-boarding members
  • Main live trading room is open 24 hours a day (regular sessions and futures, with 1 hour breaks every 10 hours for server reboots) live recorded trading with Lead Trader. Exceptions include; Trade Coaching Boot Camps, special Trading Webinars or when the lead trader is not available.
  • In final edits for release this week;
    • New pricing published representing next generation algorithm models (existing members no change).
    • Next generation algorithm models roll out (machine trading Gen 1).
    • Trading Profit and Loss Published for Q1 and Q2 2018 (a report detailing trading / alert performance of our team).
    • Trading Boot Camp Event videos become available on Compound Trading website.
    • Previously recorded Master Class Videos will become available for download on website.
    • New Trading Boot Camp Events to be announced
      • 1 day Oil Trading Bootcamp (online only)
      • 1 day Swing Trading Bootcamp (online only)
      • 3 day Trading Bootcamp November 2018 (online or in person)
  • Sept 18 – Raw Trading Boot Camp Videos were emailed to members.
  • Sept 18 – Previously recorded Master Class Series were emailed to members.
  • Sept 14-16 Cabarete Trade Coaching Boot Camp went well, there are a series of post links on this landing page that detail what our itinerary was each day etc.
  • Machine Trade Coding Team Mandates: In current development and roll-out has commenced (1) Intelligent Assisted #IA Trading Platform (Code Algorithm Models), (2) Operate 24 Hour Crypto Trading Desk, (3) Alert Trade Set-ups to Member Alert Feeds (for all models) and (4) Machine Learning. 

Premarket Report: On lead trader availability basis only (the premarket reports are not published every market day).

Private Member Discord Server Chat Rooms: BE SURE to get in to each private Discord server specific to your specific subscription type (bundles) – many of the updates as we go forward will be posted in there and detailed trading plans for alerted trades are often discussed by our lead trader in the rooms. This includes the SWING TRADING platform also. IF YOU NEED A LINK / INVITE email us.

https://twitter.com/CompoundTrading/status/880670140454637569

Real-time Trade Alerts:

Real-time Trade Alerts for Oil, Swing Trading, Day Trading, Bitcoin are available to subscribers by following specific alert Twitter feeds.

Oil Trading Alerts, Swing Trading Alerts, Day Trading Alerts, Bitcoin Trading Alerts.

Disclaimer / Disclosure, Terms of Use:

Subscribers: read disclaimer.

Blog / Video / Social Posts / Learn to Trade: 

#BitcoinTrading 101: A Beginner’s Guide to Getting Started $BTCUSD $XBTUSD $BTC https://compoundtrading.com/bitcointrading-101-beginners-guide-getting-started-btcusd-xbtusd-btc/ …

https://twitter.com/CompoundTrading/status/927397024315662336

How to Use EPIC Oil Algorithm: $USOIL, $WTI, $CL_F, $USO, $UCO, $SCO, $UWT, $DWT, #OIL, #OOTT: http://youtu.be/hawVV31G9bg?a via @YouTube

https://twitter.com/CompoundTrading/status/889148655785177088

How to Use ROSIE Gold Algorithm: #GOLD, $GLD, $XAUUSD, $GDX, $GDXJ, $NUGT, $DUST, $JNUG, $JDST

https://twitter.com/CompoundTrading/status/889147527278333952

Some Recent Chart / Trade Set-Up Reports: 

See YouTube, member email direct reports and blog for other recent videos or blog posts. Listed from most recent. Much of the premium member reporting posted below is delayed and may or may not require password.  

Sept 26 – Protected: Trade Alerts | Day Trade & Swing Trades (w / video) Trading Square $SQ, $DIS, $NFLX, $AMD, OIL, $FB, $GOOGL and more.

Sept 25 – Protected: Crude Oil Trading Room – Member Oil Trade Signals / Alerts for Trading the EIA Report (w/ video)

Sept 19 – Protected: Best Trading Week in Months! Trade Alert Set-Ups: $NBEV, $CRON, Oil, $AAPL, $NFLX, $FB, $AMD, $BABA, $BLDP, $CARA, $EDIT, $BZUN and more.

Sept 18 – Protected: Trade Alerts (w/ video): $NBEV, $TLRY, $CGC, $CRON, $VKTX, $MOMO, $ROKU, $NVTA, $CRC, $THO, $DGLY, $YELP, $XXII, $CVM, $SHOP

Sept 17 – Protected: Trade Alerts (w/ video): $VIX $WTI $CL_F $PROQR $CARA $BOX $BABA $SSW $SPY $FB $SENS

Sept 12 – Protected: XENETIC BIOSCIENCES INC How to Trade XBIO Snap-back Swing Trade. $XBIO #swingtrading #tradealert

Sept 10 – Protected: Analyzing Bitcoin Chart Patterns: Bitcoin Trade Alert – What to Expect Near Term #Bitcoin #Trading $BTC $XBT $VIX

Sept 5 – Day Trading and Swing Trading CRONOS GROUP Inc. (CRON)

Aug 16 – Oil Trade Alerts: How We Knew Where Oil Sell-Off Bottom Was in Advance. Crude Oil Trading Strategy.

Aug 12 – Crude Oil Trading Face-Off Results “Pro Trader” (Man) vs. EPIC Oil Algorithm (Machine Trading Tech)

Aug 7 – Protected: Swing Trading Earnings Special Report (Members) Tues Aug 7 $DIS, $AMD, $AAPL, $WMT, $FB, $JKS, $EXP, $LTBR, $SPY, $DXY more.

Recent Educational Articles / Videos:

I get a lot of Q’s on How to Trade our models, this vid has 5 min explanation at 1:00 min-6:00 min. https://www.youtube.com/watch?v=QrXbE7lojAg&t=3s … – Fib Trendlines, Trading structure/quads, Price targets, Main support resistance (buy sell triggers), Time cycles, Moving averages, Trading trims/adds.

Trading Plan / Watch Lists. Morning Momentum / Gaps / News / PR / IPO / SEC Filings / Earnings Stocks on Watch: 

The Square $SQ trade from yesterday is going well, trading 96.30 in premarket today with a swing trade entry at 89.00 and looking for more legs in this trade (see Square $SQ feature post and video).

Today is EIA Petroleum Report day at 10:30 AM. Looking for a large swing trade in oil (see feature report sent to members last night).

Stocks making the biggest move premarket: NKE, IBM, MRK, KBH, SVMK & more https://www.cnbc.com/2018/09/26/stocks-making-the-biggest-move-premarket-nke-ibm-mrk-kbh-svmk–more.html

$SVMK Per CNBC;

SVMK – SVMK priced its initial public offering at $12 per share, above the expected range of $9 to $11 per share. The parent of SurveyMonkey also increased the size of its offering to 15 million shares from the original 13.5 million, and the IPO’s pricing gives the company a market value of $1.46 billion.

$NKE Per CNBC;

Nike – Nike reported quarterly profit of 67 cents per share, 4 cents a share above estimates. The athletic footwear and apparel maker’s revenue was just barely above Street forecasts. Nike benefited from strong consumer spending in the U.S. market, among other factors, but some analysts are concerned about what they consider weaker than expected profit margins.

$GRPO per CNBC;

GoPro – The stock was upgraded to “outperform” from “perform” at Oppenheimer, based on the high definition camera maker’s new product offerings and what the firm calls appropriate pricing.

Below are some trade position notes from the last week or so if you didn’t catch them;

Still watching the week set-up, I expect a significant oil size trade (swing and intra-day) very near, in a new Disney $DIS trade, the $XBIO set-up was awesome and there’s a number of others we are working on. I don’t see any reason why we won’t be able to push these set-ups out this evening after the markets close. There is so much going on right now in the markets (the ground is moving) that we have to start pushing this stuff out and get ready.

Doing some charting in premarket for $CLRB and $APDN – both very interesting set-ups IMO.

BTW the Bitcoin $BTC trade will be big soon, the charting is setting up, we will be updating members on the inflection move prior. We expect up, but we will be alerting the BTC set-up for both scenarios.

Have a swing trade in $CRON  that is going well, trimming and adding per chart model that has been a great help.

Have a swing trade in $BABA under water on 1 1/10 sizing entry, watching for adds.

Really like $FB snap-back set-up here, watching the 50 MA overhead on the chart model, it keeps paying every time we trade it.

Also really like $NFLX set-up here, it has been a regular and consistent pay day with the simple chart model dialed in.

Oil I’ve missed a few sweet spots this week but continue to watch, not every trader can be on top of every instrument 100% of the time (I keep telling myself haha). Anyway, I’ll start hitting it out of the park again with patience. Hopefully today a set-up on the EPIC model allows some size.

SHOPIFY $SHOP has been a great set-up for a possible break upside the quad time cycle peak, support has held well for traders that have taken longs on the set-up. It could blow through the top of that quad on the time cycle peak coming, if it does it will be a significant extension up.

$NBEV trade has been fantastic, paying the bills for sure. Chart resistance and support areas worked well. Trade alert was good on NBEV.

$GTHX is a tad wild but managed well it has been a good trade for us.

And $AGN of course continues to pay on large sizing with trims and adds from the charting and trade plans published over last number of weeks.

Watching $BKRS for a long, looks decent for a swing trade.

The videos this week and the boot camp trade set-up reviews have been right in the flow of the market. We’re working on the rest of the equities we follow now and will have them all out over the next few days. Today in mid-day review I will tackle some more of the set-ups.

Market Observation:

Markets as of 8:10 AM: US Dollar $DXY trading 94.14, Oil FX $USOIL ($WTI) trading 71.75, Gold $GLD trading 1198.21, Silver $SLV trading 14.43, $SPY 291.14 (premarket trade), Bitcoin $BTC.X $BTCUSD $XBTUSD 6378.00 and $VIX trading 11.9.

Momentum Stocks / Gaps to Watch: 

$ALDX Alderya’s stock rockets after positive trial results of mesothelioma treatment https://www.marketwatch.com/story/alderyas-stock-rockets-after-positive-trial-results-of-mesothelioma-treatment-2018-09-26?mod=BreakingNewsSecondary

28 Stocks Moving In Wednesday’s Pre-Market Session https://benzinga.com/z/12409271 $ALDX $IGC $VSTM $EGY $KBH $GPRO $VNDA $DGLY $CONE $TEN $NKE $CTAS

28 Stocks Moving In Wednesday's Pre-Market Session https://t.co/OO2rmEC8Mv $ALDX $IGC $VSTM $EGY $KBH $GPRO $VNDA $DGLY $CONE $TEN $NKE $CTAS

— Benzinga (@Benzinga) September 26, 2018

News: 

$TLRY Supreme Cannabis Signs $12M Guaranteed Supply Agreement with Tilray®Supreme Cannabis (SPRWF) and Tilray® enter into a twelve-month guaranteed supply agreement Supreme Cannabis (SPRWF) to supply 7ACRES premium dried cannabis to Tilray®

Recent SEC Filings / Insiders:

Recent IPO’s:

$SVMK SurveyMonkey IPO is bigger than expected https://www.marketwatch.com/story/surveymonkey-ipo-is-bigger-than-expected-2018-09-25?mod=mw_share_twitter

Elastic sets IPO terms to raise up to $203 million, to be valued at up to $2 billion

$BNGO REMINDER: Analyst IPO Quiet Period Expiration Today for BioNano Genomics

Ticketing company Eventbrite prices IPO at $23 to raise $230 million

Gritstone Oncology sets terms for IPO to raise up to $91.1 million

Qutoutiao prices IPO at $7 per ADS, raising $84 million

Earnings:

Actuant’s stock tumbles after earnings and sales beat but profit outlook falls short

#earnings for the week

$NKE $BB $KMX $RAD $KBH $JBL $ACET $FDS $MANU $BBBY $NEOG $ACN $CCL $INFO $ATU $MTN $WOR $CTAS $MKC $CAG $ASNA $AIR $OMN $CMD $FGP $PRGS $ESNC $ANGO $CAMP $FUL $DAC $ISR $SCHL

http://eps.sh/cal

#earnings for the week$NKE $BB $KMX $RAD $KBH $JBL $ACET $FDS $MANU $BBBY $NEOG $ACN $CCL $INFO $ATU $MTN $WOR $CTAS $MKC $CAG $ASNA $AIR $OMN $CMD $FGP $PRGS $ESNC $ANGO $CAMP $FUL $DAC $ISR $SCHL https://t.co/r57QUKKDXL https://t.co/pVka1Ud3QD

— Melonopoly (@curtmelonopoly) September 24, 2018

Trade Set-up Alerts, Charts & Reports. Recent / Current Holds, Trade Alerts, Open and Closed Trades:

Please refer to the date at top left of each chart (charts are often carried forward for some time). Trade alerts and stock chart set-ups should be traded as decision to decision process – when the trade set-up fails cut your position fast. Leg in to the winners at key resistance and support (at retracement or breach) and exit the losers fast based on technical support and resistance. Not all set-ups work, the purpose of technical analysis is to provide the framework for your trade (the chart structure enables the trader to set stops where a trade is a failed trade and leg in to winners and trim winners per the chart). The purpose of trade alerts is to bring awareness of the trade set-up in play but you have to execute the trade based on your trading strategy that should be harnessed in your rules based process.

$ALDX Premarket trading 12.60 up 27 percent Alderya’s stock rockets after positive trial results of mesothelioma treatment #premarket

ALDX, premarket, trading, plan, daytrading
$ALDX Premarket trading 12.60 up 27 percent Alderya’s stock rockets after positive trial results of mesothelioma treatment #premarket

DISNEY (DIS) swing trade trading HOD 114.70 with intra resistance, serious resistance at quad wall (dotted gray) next $DIS #swingtrading #tradealerts

DISNEY, $DIS, stock chart
DISNEY (DIS) swing trade trading HOD 114.70 with intra resistance, serious resistance at quad wall (dotted gray) next $DIS #swingtrading #tradealerts

SQUARE (SQ) swing trade alert going well. As trade nears previous highs on candles on 240 expect resistance until break-out. $SQ #tradealerts

Square, stock, chart
SQUARE (SQ) swing trade alert going well. As trade nears previous highs on candles on 240 expect resistance until break-out. $SQ #tradealerts

ADVANCED MICRO (AMD) hit key resistance at mid quad and came off now near a support, some members in this play toward price target #swingtrading #tradealerts

AMD, stock, chart
ADVANCED MICRO (AMD) hit key resistance at mid quad and came off now near a support, some members in this play toward price target #swingtrading #tradealerts

Screen shot of crude oil trading room, lead trader discussing oil trading signals and strategy in chat. #oiltradingroom

crude, oil, tradin, room
Screen shot of crude oil trading room, lead trader discussing oil trading signals and strategy in chat. #oiltradingroom

Screen Shot of Crude Oil Trading Room and the oil trading signals discussed by lead trader.

oil trading, room
Screen Shot of Crude Oil Trading Room and the oil trading signals discussed by lead trader.

Swing trade alert at 89.00 on Square $SQ today at market open. Chart shows the incredible trading in Square today. #swingtrade #tradealerts

$SQ, Square, stock, chart, swing, trade
Swing trade alert at 89.00 on Square $SQ today at market open. Chart shows the incredible trading in Square today. #swingtrade #tradealerts

$SQ opened strong today on upgrade, long 89.00 and we’ll be looking for more size / legs in this one. Closed the day at 95.95. #swingtrading #daytrading #tradealerts

$SQ opened strong today on upgrade, long 89.00 and we'll be looking for more size / legs in this one. Closed the day at 95.95. #swingtrading #daytrading #tradealerts pic.twitter.com/sYOmmRJ27s

— Melonopoly (@curtmelonopoly) September 26, 2018

As the media wars heat up, Chart Master Carter Worth sees one company as a buy: Disney $DIS #swingtrading

As the media wars heat up, Chart Master Carter Worth sees one company as a buy: Disney $DIS #swingtrading https://t.co/KiWbcjO7PO

— Swing Trading (@swingtrading_ct) September 25, 2018

Best Oil Stocks to Buy Now https://finance.yahoo.com/news/best-oil-stocks-buy-now-012433429.html?soc_src=social-sh&soc_trk=tw … 

Best Oil Stocks to Buy Now https://t.co/mh3568k1o0 via @YahooFinance

— Melonopoly (@curtmelonopoly) September 24, 2018

APPLE (AAPL) premarket bullish momentum with 20 MA test and 224.60 range buy sell trigger above $AAPL #swingtrading #tradealerts

APPLE, AAPL, stock, chart
APPLE (AAPL) premarket bullish momentum with 20 MA test and 224.60 range buy sell trigger above $AAPL #swingtrading #tradealerts

FACEBOOK (FB) premarket up over 50 MA on 240 min chart, watch 167.60 resistance overhead $FB #swingtrade #tradealerts

FB, trade, setup, swing, trade, chart
FACEBOOK (FB) premarket up over 50 MA on 240 min chart, watch 167.60 resistance overhead $FB #swingtrade #tradealerts

ALIBABA (BABA) bullish up 2% intra day, holding support of trading range well. Trim in to resistance add above. $BABA #tradealerts #swingtrade

BABA, swing, trade, chart
ALIBABA (BABA) bullish up 2% intra day, holding support of trading range well. Trim in to resistance add above. $BABA #tradealerts #swingtrade

CARA THERAPEUTICS (CARA) Nice swing trade from trading bootcamp in to next leg at resistance intra day $CARA #swingtrade #tradealert

CARA, swing, trade, chart
CARA THERAPEUTICS (CARA) Nice swing trade from trading bootcamp in to next leg at resistance intra day $CARA #swingtrade #tradealert

OSI SYSTEMS (OSIS) Trading 77.55 testing 50 MA and key Fib resistance, over targets 84.21 Dec 28, 18 $OSIS #tradealerts #swingtrading

OSIS, stock, chart
OSI SYSTEMS (OSIS) Trading 77.55 testing 50 MA and key Fib resistance, over targets 84.21 Dec 28, 18 $OSIS #tradealerts #swingtrading

BALLARD POWER (BLDP) Five out of five of the last major time cycles price reversed, Oct 10 is next time cycle peak. $BLDP #swingtrading #tradealerts

BLDP, Ballard, chart, swing, trade
BALLARD POWER (BLDP) Five out of five of the last major time cycles price reversed, Oct 10 is next time cycle peak. $BLDP #swingtrading #tradealerts

LEVEL BRANDS (LEVB) trading 6.54 premarket long in to 8.09 price target, 6.16 area support. $LEVB #daytrading #swingtrade

LEVB, swing, trade, chart
LEVEL BRANDS (LEVB) trading 6.54 premarket long in to 8.09 price target, 6.16 area support. $LEVB #daytrading #swingtrade

EDITAS MEDICINE (EDIT) Bounce at 50 MA over mid quad resistance 200 MA res next Sept 24 price target in sight. $EDIT #swingtrade #tradingalert

$EDIT, trade, alert, swing trade
EDITAS MEDICINE (EDIT) Bounce at 50 MA over mid quad resistance 200 MA res next Sept 24 price target in sight. $EDIT #swingtrade #tradingalert

NETFLIX (NFLX) perfect turn at previous alerted trendline support 309.54, cleared 313.52 res (red blue) 338.66 mid quad bounce $NFLX #swingtrading #tradealerts

NETFLIX, swing trading, alert
NETFLIX (NFLX) perfect turn at previous alerted trendline support 309.54, cleared 313.52 res (red blue) 338.66 mid quad bounce $NFLX #swingtrading #tradealerts

NETFLIX (NFLX) Part 2 – past 361.91 key resistance, over 200 MA 380 mid quad resistance on deck trading 372.11 $NFLX #swingtrading #tradealerts

$NFLX, premarket, trade alert
NETFLIX (NFLX) Part 2 – past 361.91 key resistance, over 200 MA 380 mid quad resistance on deck trading 372.11 $NFLX #swingtrading #tradealerts

NETFLIX (NFLX) PT 3 over 380 mid quad resistance, targets 395.57 trendline (gray dotted) 398.20 red blue key resistance $NFLX #swingtrading #tradealert

NETFLIX, NFLX, premarket, trade alert, chart
NETFLIX (NFLX) PT 3 over 380 mid quad resistance, targets 395.57 trendline (gray dotted) 398.20 red blue key resistance $NFLX #swingtrading #tradealert

CRONOS – per yesterday’s trade alert and review video over trendline on way to resistance test in premarket $CRONO #tradealert #premarket

CRONO, $CRONS, premarket, trade alert, swing trade, day trade
CRONOS – per yesterday’s trade alert and review video over trendline on way to resistance test in premarket $CRONO #tradealert #premarket

ROKU INC (ROKU) At resistance 73.55 area, above 73.70 targets 77.80 next. Trim in add above. $ROKU #swingtrde #daytrading

ROKU, stock, chart, trading
ROKU INC (ROKU) At resistance 73.55 area, above 73.70 targets 77.80 next. Trim in add above. $ROKU #swingtrde #daytrading

CVM Looking to break recent highs out of bullish bowl targets 5.00 then 6.00. $CVM #swingtrading

CVM, swing, trading, stock
CVM Looking to break recent highs out of bullish bowl targets 5.00 then 6.00. $CVM #swingtrading

SHOPIFY (SHOP) continues bullish pressing upper FIB trendline, trading 159.25 targeting 166 Oct 10 $SHOP #tradealerts #swingtrading

SHOP, SHOPIFY, trade, alert, swing trading
SHOPIFY (SHOP) continues bullish pressing upper FIB trendline, trading 159.25 targeting 166 Oct 10 $SHOP #tradealerts #swingtrading

22nd Century Group (XXII) over 2.85 targets 3.09 then 3.53 Nov 19 time cycle. $XXII #tradealerts #swingtrading

XXII, trade, setup
22nd Century Group (XXII) over 2.85 targets 3.09 then 3.53 Nov 19 time cycle. $XXII #tradealerts #swingtrading

MOMO Inc. from Trading BootCamp over 48.50 targets 49.66 50.46 51.42 65.57 Feb 5 #swingtrading #tradealerts

MOMO, chart, swing trading, stock
MOMO Inc. from Trading BootCamp over 48.50 targets 49.66 50.46 51.42 65.57 Feb 5 #swingtrading #tradealerts

SP500 (SPY) near break upside test, above signals targets 293, 294.20, 295.50, 297 resistance Sept 21 ish $SPY $ES_F $SPXL $SPXS #SPY #Swingtrade #tradingalerts

SP500, SPY, trading, chart
SP500 (SPY) near break upside test, above signals targets 293, 294.20, 295.50, 297 resistance Sept 21 ish $SPY $ES_F $SPXL $SPXS #SPY #Swingtrade #tradingalerts

G1 THERAPEUTICS (GTHX) at intra day model support, could bounce here targets near 70 first if so $GTHX #tradealerts

GTHX, stock, chart, trade, alert
G1 THERAPEUTICS (GTHX) at intra day model support, could bounce here targets near 70 first if so $GTHX #tradealerts

US Dollar Index (DXY) Algorithm support area test 94.50, 94.04 break bounce area $DXY $UUP #USD #tradingalerts

DXY, US Dollar, chart, currencies
US Dollar Index (DXY) Algorithm support area test 94.50, 94.04 break bounce area $DXY $UUP #USD #tradingalerts

BOX INC (BOX) Box testing support, short under red box support, down side targets at arrows in sell-off $BOX #Swingtrading #daytrade #tradealerts

BOX, stock, chart
BOX INC (BOX) Box testing support, short under red box support, down side targets at arrows in sell-off $BOX #Swingtrading #daytrade #tradealerts

PROQR THERAPEUTICS (PRQR) Bounced at support range (box) now at key res, over 22.70 targets 24.85 fast then 27.55 $PRQR #swingtrading #daytrade #tradealerts

PROQR, stock chart
PROQR THERAPEUTICS (PRQR) Bounced at support range (box) now at key res, over 22.70 targets 24.85 fast then 27.55 $PRQR #swingtrading #daytrade #tradealerts

XENETIC BIOSCIENCES INC How to trade XBIO charting set-up number 1. $XBIO #swingtrading #tradealert

XBIO, trade, alert, swing, trading
XENETIC BIOSCIENCES INC How to trade XBIO charting set-up number 1. $XBIO #swingtrading #tradealert

ALLERGAN (AGN) Chart structure reversal in to channel following call perfectly at this point. $AGN #swingtrading #chart

AGN, swing, trading, chart
ALLERGAN (AGN) Chart structure reversal in to channel following call perfectly at this point. $AGN #swingtrading #chart

ARROWHEAD PHARMA (ARWR) Upper parallel trending channel per previoys clearly in play at this point. $ARWR #swingtrading #daytrading #chart

ARWR, Arrowhead, stock, chart
ARROWHEAD PHARMA (ARWR) Upper parallel trending channel per previoys clearly in play at this point. $ARWR #swingtrading #daytrading #chart

VOLATILITY (VIX) So we have a MACD turn up on weekly chart structure, Stoch RSI SQZMOM up, 20s possible Oct 1. $VIX $TVIX $UVXY #volatility #chart

VIX, volatility, chart
VOLATILITY (VIX) So we have a MACD turn up on weekly chart structure, Stoch RSI SQZMOM up, 20s possible Oct 1. $VIX $TVIX $UVXY #volatility #chart

BITCOIN (BTC) Wedge chart pattern on daily time-frame chart. $BTC $XBT $XBTUSD #Bitcoin #Chart

Bitcoin, BTC, chart, wedge
BITCOIN (BTC) Wedge chart pattern on daily time-frame chart. $BTC $XBT $XBTUSD #Bitcoin #Chart

Market Outlook, Market News and Social Bits From Around the Internet:

Risk appetite keeps climbing…

Risk appetite keeps climbing… pic.twitter.com/QhRj5H21zn

— David Schrottenbaum (@David_Schro) September 26, 2018

America avoided an apocalyptic ‘economic catastrophe’: Hank Paulson https://www.foxbusiness.com//economy/america-avoided-an-apocalyptic-economic-catastrophe-hank-paulson #FoxBusiness

If you are new to our trading service you should review recent blog posts, the Compound Trading YouTube Channel and at minimum our algorithm Twitter feeds because they do tell a story in terms of the market and how the inflections of the market determine our day to day trading. You will notice the algorithmic modelling has been undeniably accurate with many time-frames (intra-day, weeks and months out) so I myself have learned to respect the math (they have taken me from a 60% hit rate to 80%+ all publicly posted live trade alerts).

Momentum Stocks (Market Open and Intra-Day):

I do trade morning momo stocks, but I do avoid much of the day trading risk (preferring to daytrade only what is structurally set-up also on the swing trade side and to my advantage in the algorithmic model charting). I often avoid the first 30 minutes (gap and go) and trade momentum stocks or structured (per explanation in previous sentence) stocks later in day after a wash-out looking for a snap-back trade that can possibly also become a strong swing or longer term trade that I can leg in to. Just prior to open and shortly after open I post momentum stocks to the trade chat room (and Twitter and Stocktwits if I have time).

Some of my Favorite Intra-day Trading Set-Ups:

(1) Momentum Stock Wash-Outs for Snap Back, (2) Bad News Wash-outs on Stocks with High Institutional Ownership, (3) Getting on the Right Side of a Trend Change and scaling in my position and (4) Our Algorithm Charting Model Set-Ups.

The momentum stocks (from previous days and morning trade) I continue to watch through the day for indicators that allow a trade.

Morning Stock Watch-Lists for my Favorite Set-Ups:

(1) Pre-Market Gainers Watch-List: $ANY $IGC $ALDX $INPX $JONE $EGY $VSTM $OASM $NBEV $MNKD $AMDA $KBH $MICT $AKER $TLRY $GPRO $NIO $NVAX

(2) Pre-market Decliners Watch-List :  

(3) Other Watch-List:

(4) Regular Algo Charting Watch-List: Gold $GC_F $GLD, Miners $GDX ($NUGT, $DUST, $JDST, $JNUG), Silver $SLV $SI_F ($USLV, $DSLV), Crude Oil FX: $USOIL $WTI ($UWT, $DWT, $USO, $UCO, $CL_F, $UWT, $DWT), Natural Gas $NG_F ($UGAZ, $DGAZ), S & P 500 $SPY $ES_F ($SPXL, $SPXS), US Dollar Index $DXY ($UUP), Volatility $VIX ($TVIX, $UVXY), $BTCUSD Bitcoin.

(5) Recent Upgrades: $KBH $GOLD $LNG $SONC $MTB $GPRO $STM $VIAB $MTB $IBM

$SQ Square (SQ) PT Raised to $105 at Buckingham Research; ‘Story Keeps Getting Better’

Amazon.com (AMZN) PT Raised to $2,350 at Jefferies, Could Reach $3,000 By 2020

Activision stock rises after Piper Jaffray raises target due to new ‘Call of Duty’ battle royale mode

(6) Recent Downgrades: $KOS $DWDP $CHEF $XOXO $COG $SYF $PAYC $LRCX $CIEN $MANH

Stay tuned in Stock Chat Room for more pre-market stocks on watch.

Study:

For new readers, a review of our unlocked posts on our blog would help you get in to the story we are following with the securities listed in this newsletter.

Free scanners to find momentum stocks that you can easily review charts of for indicators that bring probability of your trade being successful up considerably. These are not useful for first 30 minute market open gap and go type plays (you need a good momentum scanner, level 2, and best to have hot-keys for the first 30 mins of gap and go trading)… but are very useful for intra day scalping and swing trading (start with trending stocks and then look at indicators intra for simple set-ups – study scan study scan study scan).

http://finviz.com/

https://finance.yahoo.com/screener/predefined/ec5bebb9-b7b2-4474-9e5c-3e258b61cbe6

http://www.highshortinterest.com/

http://www.gurufocus.com/short-stocks.php

http://www.3xetf.com/all/

http://www.etf.com/channels/gold-etfs

GL!

Curtis

Algorithm Twitter feeds can be found here: $BTC (@CryptotheAlgo) $WTI (@EPICtheAlgo), $VIX (@VexatiousVIX), $SPY (@FREEDOMtheAlgo), $GLD (@ROSIEtheAlgo), $SLV (@SuperNovaAlgo), $DXY (@DXYUSD_Index). Our Swing Trading Twitter feed is found here: https://twitter.com/swingtrading_ct. Our lead trader Twitter feed is here @curtmelonopoly

Article Topics: Premarket, Stocks, Trading Plan, Trade Alerts, Trading Room, Swing Trading, Day Trading, EIA, Crude Oil, Fed, $ALDX, $SQ, $NKE, $SVMK, $GPRO, $DIS, $AMD

Read More
Trade Alerts | Day Trade & Swing Trades (w / video) Trading Square $SQ, $DIS, $NFLX, $AMD, OIL, $FB, $GOOGL and more.

Trade Alerts | Day Trade & Swing Trades (w / video) Trading Square $SQ, $DIS, $NFLX, $AMD, OIL, $FB, $GOOGL and more.

September 26, 2018January 12, 2019 Swing TraderSwing Trading, Trade Alerts$AMD, $DIS, $FB, $GOOGL, $NFLX, $SQ, Day Trading Alerts, Oil, Swing Trading Alerts, Trade Alerts, Trading Room

Trade Alerts. #tradealerts #daytrading #swingtrading

Swing Trading and Day Trading Alerts with raw video footage from our Live Trading Room premarket and market open on Sept 26, 2018. 

Stocks Alerted for Trade: $SQ, $DIS, $NFLX, $AMD, OIL, $FB, $GOOGL and more.

At 1:20 in the video the Square $SQ trade alert is discussed and the chart set-up, specifically the sidewinder trade set-up with the 20 MA under 50 MA with price above and reason for Square to run on the upgrade in premarket. The video explains the Square trading set-up in detail.

Why Instinet Analyst Dan Dolev Is So Bullish on Square $SQ (video) https://www.bloomberg.com/news/videos/2018-09-25/why-instinet-analyst-dan-dolev-is-so-bullish-on-square-video

Square CFO Friar Says Financial System Not Serving Consumers Properly $SQ (video) https://www.bloomberg.com/news/videos/2018-09-25/square-cfo-friar-says-financial-system-not-serving-consumers-properly-video

Square Belongs in the Same Class as Apple and Facebook, Analyst Says $SQ https://www.barrons.com/articles/square-belongs-in-the-same-class-as-apple-and-facebook-analyst-says-1537886007?siteid=yhoof2&yptr=yahoo

Then in pre-market I review the Disney $DIS chart and swing trade we are in, Advanced Micro $AMD trade set-up, Oil trading strategy for the week and in to the EIA report, Netflix $NFLX looking for ads to position, Facebook $FB and Google $GOOGL looking for a short position, Ballard Power $BLDP trade set-up in to time cycle, Bitcoin $BTC on high watch, and Volatility $VIX on watch.

After a quick break I reviewed the massive opportunities we are seeing in the markets over the next two quarters.

At 6:30 I move $SQ to 5 min chart and consider an entry before open. Reviewed stochastic RSI, MACD and squeeze momentum indicators on the Square chart for members.

At 9:30 in video is near the market open and I review my trading plan for it and move to 1 minute chart.

At 10:40 I discuss the next market inflection we see.

At 11:00 the buy side trade starts coming in to Square and I take my first entry in Square at 89.00 for a 1/10 size with a stop at 89.00.

I explain that I’m looking for a base entry that holds in the Square trade and that I will leg in once I get a base trade in.

A copy of the swing trading alert on our private member’s Twitter feed is here;

$SQ opened strong today on upgrade, long 89.00 and we’ll be looking for more size / legs in this one. Closed the day at 95.95. #swingtrading #daytrading #tradealerts

$SQ opened strong today on upgrade, long 89.00 and we'll be looking for more size / legs in this one. Closed the day at 95.95. #swingtrading #daytrading #tradealerts pic.twitter.com/sYOmmRJ27s

— Melonopoly (@curtmelonopoly) September 26, 2018

At 14:40 on the video I start explaining the 5 min candle positioning I am looking for and the times through the week that I will look at adds to the swing trade as “pockets” for optimum timing on adds to the $SQ trade (lunch time, end of day, early in premarket and end of day Friday).

On the swing trading alerts private member feed the trading plan for adds for sizing in to this trade is explained per below;

General idea for legging in to $SQ – when 5 min held previous top of 5 i hit a 1/10 entry long 89 again, i’ll keep chewing till an area holds – for first leg

https://twitter.com/SwingAlerts_CT/status/1044587344584597506

the next $SQ leg entry long will be on 30 min body holding the previous 30 min but i won’t do that until lunch, late day, premarket (early) or end of day Friday, then next 1 hour same process then 4 hour same process.

https://twitter.com/SwingAlerts_CT/status/1044587418353975296

Swing trade alert at 89.00 on Square $SQ today at market open. Chart shows the incredible trading in Square today. #swingtrade #tradealerts

Square, swing trading, trade alerts, chart
Swing trade alert at 89.00 on Square $SQ today at market open. Chart shows the incredible trading in Square today. #swingtrade #tradealerts

At around 53:00 in the video I am explaining my entry, sizing opportunities, retrace support areas, how to trade 5 min candles and how to trade other time-frames for sizing in to the trade.

TRADE ALERTS VIDEO – TRADING ROOM: #daytrading #swingtrading

Trade Alerts | Day Trade & Swing Trades. Square $SQ, $DIS, $NFLX, $AMD, OIL, $FB, $GOOGL and more.

DAY TRADING ALERTS CHAT ROOM LOG

Below are chat entries specific to actionable alerts from the trading room today. Add 2 hours to the chat log times shown for Eastern Standard Time.

CURT M_1 September 25, 2018 06:55:06 AM
Protected: PreMarket Trading Plan Tues Sept 25: Market Screams Epic Opportunity Near, $DIS, $APDN, $CLRB, $KORS, $NFLX, $BLDP, OIL, Bitcoin, more.rrrrPassword: CLRBrrrrLink: https://compoundtrading.com/premarket-trading-plan-tues-sept-25-market-screams-epic-opportunity-near-dis-apdn-clrb-kors-nflx-bldp-oil-bitcoin-more/

CURT M_1 September 25, 2018 06:55:09 AM
Mornin!

CURT M_1 September 25, 2018 06:55:27 AM
Running scans and chart set ups now. We may get some opportunity here at open today.

CURT M_1 September 25, 2018 06:55:30 AM
brb

OILK September 25, 2018 07:00:33 AM
AMD held key support pivot on chart yesterday, trading up near 2% this morning. I’m long here.

SANDEEP September 25, 2018 07:01:47 AM
Caught that, seems upside target(s) in play if 32.47 is used as support

CURT M_1 September 25, 2018 07:04:15 AM
Mobile Mini $MINI PT Raised to $61 at Sidoti

SHAF September 25, 2018 07:06:18 AM
GOOGl short in play per curt – today best IMO

LENNY September 25, 2018 07:07:15 AM
Momo Watch: JAGX, JONE, CEI, APDN

LENNY September 25, 2018 07:07:44 AM
Short term only – all charts on momo watch are broken garbage.

LENNY September 25, 2018 07:08:11 AM
SQ interesting also on the UG

LENNY September 25, 2018 07:08:28 AM
the GOOGL TWTR FB money could rool some in there

PAUL M September 25, 2018 07:08:39 AM
seems logical len

CURT M_1 September 25, 2018 07:09:04 AM
Advanced Micro Devices $AMD Seen As A Near Term Semi Trend Beneficiary At Northland

CURT M_1 September 25, 2018 07:09:42 AM
Canopy Growth initiated with a Buy at Benchmark $CGC $STZ $STZ.B http://dlvr.it/QlK351

CURT M_1 September 25, 2018 07:11:03 AM
BREAKING: Qualcomm unveils explosive charges against Apple for stealing “vast swaths” of its confidential information and trade secrets for the purpose of improving the performance of chip sets provided by Qualcomm’s competitor Intel

CURT M_1 September 25, 2018 07:11:21 AM
https://twitter.com/CNBCnow/status/1044573719899906050

OILK September 25, 2018 07:12:31 AM
They will run oil after EIA

OILK September 25, 2018 07:12:47 AM
significant run imo then

CURT M_1 September 25, 2018 07:14:58 AM
thats a swidewinder setting up on 240 $SQ

CURT M_1 September 25, 2018 07:17:13 AM
On Watch: Oil long (likely not until post EIA or maybe an intr day prior), SQ long on sidewinder set-up, short GOOGL FB, DIS, NFLX adds long, BTC set up nearing, BLDP short is nearing time frame, and VIX near.

CURT M_1 September 25, 2018 07:17:35 AM
I may take an entry in SQ at open.

CURT M_1 September 25, 2018 07:17:37 AM
will see

CURT M_1 September 25, 2018 07:20:32 AM
on mic in 1

CURT M_1 September 25, 2018 07:56:49 AM
when the 5 min held the previous top of 5 i hit a 1/10 entry long SQ 89 again, i’ll keep chewing till an area holds – for the first leg

CURT M_1 September 25, 2018 07:57:00 AM
looks like this may hold

CURT M_1 September 25, 2018 07:58:13 AM
the next leg entry long will be on 30 min body holding the previous 30 min but i won’t do that until lunch, late day, premarket (early) or end of day Friday, then next 1 hour same process then 4 hour same process.

CURT M_1 September 25, 2018 08:03:00 AM
on mic 10:10 ish re: SQ trade

CURT M_1 September 25, 2018 08:10:05 AM
i will be a few mins here

CURT M_1 September 25, 2018 08:12:55 AM
on mic 9:13

CURT M_1 September 25, 2018 08:12:59 AM
10:13

CURT M_1 September 25, 2018 09:05:09 AM
it seems pressure in to weekly reporting has started looking for bottom of EPIC uptrend channel on chart for long positioning other side of reporting EIA

CURT M_1 September 25, 2018 09:58:28 AM
on mic 12:05

CURT M_1 September 25, 2018 11:07:08 AM
$NKE earnings on high watch for me later today (when I return from some exercise). Cya later, GL! #freedivetime 9 videos scheduled for members to do tonight, we’ll see if I can get em all done. peace https://twitter.com/curtmelonopoly/status/1044633980493008896

Subscribe:

Click here for Day Trading Alerts.

Click here for Swing Trading Alerts.

Click here for a menu of Trading Alerts, Newsletters, Trading Rooms and Trade Coaching prices and options.

Connect:

Register to free email list for trade set-ups, webinars, special events: https://compoundtrading.com/contact/ 

Website: https://compoundtrading.com

Free chat room: https://discord.gg/2HRTk6n

Twitter: https://twitter.com/CompoundTrading

Lead Trader: https://twitter.com/curtmelonopoly

Tradingview: https://www.tradingview.com/u/curtmel…

Facebook: https://www.facebook.com/compoundtrad…

StockTwits: https://stocktwits.com/compoundtrading

Email: https://[email protected]

#tradealerts #swingtrading #daytrading

Article Topics; Trade Alerts, Swing Trading Alerts, Day Trading Alerts, Trading Room, $SQ, $DIS, $NFLX, $AMD, OIL, $FB, $GOOGL

Read More
Best Trading Week in Months! Trade Alert Set-Ups: $NBEV, $CRON, Oil, $AAPL, $NFLX, $FB, $AMD, $BABA, $BLDP, $CARA, $EDIT, $BZUN and more.

Best Trading Week in Months! Trade Alert Set-Ups: $NBEV, $CRON, Oil, $AAPL, $NFLX, $FB, $AMD, $BABA, $BLDP, $CARA, $EDIT, $BZUN and more.

September 21, 2018October 14, 2018 Curt MelonopolySwing Trading, Trade Alerts$AAPL, $AMD, $BABA, $BLDP, $BZUN, $CARA, $CRON, $EDIT, $FB, $NBEV, $NFLX, Chart, Daytrading, Oil, price targets, Set-Ups, Signals, Swingtrading, Trade, Trade Alerts, Trading

Trade Alerts. Trade Set-ups Report and Video from Live Day Trading Room September 20: $NBEV, $CRON, Oil, $AAPL, $NFLX, $FB, $AMD, $BABA, $CARA, $BLDP, $EDIT, $BZUN and more.  #daytrading #swingtrading

#TradeAlerts

Trading alerts and Swing Trading and Day Trading set-ups raw video from Live Trading Room mid-day review Sept 20, 2018. Some of the trade set-ups in this video are from the Trading Boot-Camp.

Stocks and Commodities Reviewed: Crude Oil Trading Algorithm, $WTI, $CL_F, $USOIL, $USO, SP500, $SPY, $AAPL, $NFLX, $FB, $EDIT, $CRON, $NBEV, $BLDP, $BZUN, $AMD, $OSIS, $CARA, $BABA, $LVEB, $XBIO, $NIHD, $ICCC and more.

It has been excellent this week! I had reported last week that I seen an inflection coming early this week and we nailed it! Continued market momentum if very possible in to next week. Many of the set-ups I have been posting the last week are firing trade signals consistently.

ITS SEEMS WE HAVE SOLVED THE BROADCASTING ISSUES WITH HARD WIRED FIBER INTERNET.

BE SURE TO LOOK AT THE CHART DATE AND TIME IN TOP LEFT HAND CORNER OF EACH CHART.

September 20, 2018

Crude Oil Trading Update ($USOIL, $WTI, $CL_F, $USO) – I review the crude oil algorithm on the video. Twice this week I took trades that I closed only to have them run after closing (I was away from monitors at each time). Execution of trades at the support and resistance of the crude oil trading algorithm (EPIC) has been excellent.

The weekly oil price targets from the weekly crude oil trading report and the charting provided in the reports have been really predictable lately also.

The crude oil trading alerts feed has been quieter this week because the trading plan in oil was to take the trades at the wider ranges to leg in to the trades, I did however alert the channel support and channel resistance and following through those trades would have been very profitable for oil trading members.

SP500 $SPY $SPXL $SPXS – On the SPY algorithm charting for 60 minute time-frame I have been watching for a break over the test area resistance 291.60 (trade alert on SPY went to swing trading alerts feed). Sept 24 time cycle 288.88 283.77 and uptrend 299.50 would be most bullish scenario. 294.33 resistance intra and main support on SPY intra-day 293.00.

SPY, stock, chart, SP500, swin, tradin
SP500 (SPY) premarket bullish with 294.31 key resistance and one smaller one in between $SPY $ES_F $SPXL $SPXS #SPY #SwingTrade #Daytrade

APPLE $APPL – Apple’s stock is over 50 ma on 240 minute chart, trade alert went out on swing trading alert feed for Apple today. Testing the 20 MA, 224.70 resistance, 229.70 resistance, 236.75 is heavy resistance. Support 215.60 area intra-day and 219.02.

AAPL, stock, chart, swing, trade
APPLE (AAPL) premarket bullish momentum with 20 MA test and 224.60 range buy sell trigger above $AAPL #swingtrading #tradealerts

NETFLIX $NFLX – The long side trade that alerted that some members took has been very good at main support on the Apple chart. The trading support and resistance areas are discussed on video. Review of the chart model and video are important to understand the trading signals for Apple. 364.00 362.14 support areas, 395.59 397.90 are resistance areas. Really important to look at the chart and video explanation however.

NETFLIX, swing trading, alert
NETFLIX (NFLX) perfect turn at previous alerted trendline support 309.54, cleared 313.52 res (red blue) 338.66 mid quad bounce $NFLX #swingtrading #tradealerts
$NFLX, premarket, trade alert
NETFLIX (NFLX) Part 2 – past 361.91 key resistance, over 200 MA 380 mid quad resistance on deck trading 372.11 $NFLX #swingtrading #tradealerts
NETFLIX, NFLX, premarket, trade alert, chart
NETFLIX (NFLX) PT 3 over 380 mid quad resistance, targets 395.57 trendline (gray dotted) 398.20 red blue key resistance $NFLX #swingtrading #tradealert

FACEBOOK $FB – One of my favorite trade set-ups, especially for wash-out snap back trades. Facebook is currently under significant government pressure now so I am not expecting the same as previous. The horizontal red and blue support and resistance areas (forming the test area box on the charts) is reviewed and the diagonal Fibonacci trend lines. Here again review of the video and chart is really important. 167.51 mid quad resistance caution here, 100 MA resistance 169.40, diagonal Fib resistance, 173.51 is upside possible, 169.03 downside possible. The trading box is reviewed on the model. Buy sell triggers for trading signals on Facebook are also reviewed.

There is a previous special report on how to trade Facebook on our website.

$FB, trading, plan, alert, chart
FACEBOOK (FB) bounce off quad wall in to key resistance (red blue) upside test 20MA 50 MA – key test area $FB #swingtrading #tradealerts

EDITAS $EDIT – The value of structured set-ups with symmetry in the algorithmic stock chart models is discussed here. Examples are $GDX, $BLDP, $NBEV, $AGN, $EDIT and many more. The symmetry on EDIT chart has hit five times and typically you will see it stretched at that point. A trade alert went out today on $EDIT to watch closely going in to this time cycle. The video explains the details.

EDIT, stock, chart
EDITAS MEDICINE (EDIT) at 200 MA resistance test with peak time cycle Sept 24, careful on other side of cycle $EDIT #swingtrade #tradealert

CRONOS $CRON – I have reviewed CRON chart set-ups many times this week. There is a light sidewinder trade set-up with the 50 MA and 20 MA on the CRON charting. You can expect a fairly decent move when the 20 MA breaches the 50 MA upside. It’s a lower time-frame being on a 240 minute chart, but it still may be enough to get price over that key resistance area reviewed on the chart and video. Pivots support and resistance areas also reviewed on video.

$CRON, trading, premarket
CRONOS – per yesterday’s trade alert and review video over trendline on way to resistance test in premarket $CRONO #tradealert #premarket

NEW AGE BEVERAGES $NBEV – I put out a special report to members today on NBEV and the trade has been fantastic since. The resistance areas and time cycles are reviewed on the video. The testing area (trading box) are reviewed. Also the price extensions (price targets) are reviewed. If price holds and price moves bullish in to time-cycle discussed on video the upside price targets for NBEV are extremely positive and reviewed on video. 9.38 is a very critical resistance and support area in to the key time cycle peak on the NBEV chart.

NBEV, stock, chart
NEW AGE BEVERAGES (NBEV) testing previous highs, technical set-up here forward for chart structure $NBEV #tradealerts #swingtrading #daytrade
NBEV, stock, chart, daytradin
NEW AGE BEVERAGES premarket bullish with trade alert price targets hitting, trim in to each add above. $NBEV #tradealerts #swingtrading #daytrade

BALLARD POWER $BLDP – On the swing trading alert feed today a special alert went out on the fact that the last five time cycle completions in Ballard Power stock charting the price reversed in trade of Ballard. This is a symmetrical stock trade set-up that traders should not ignore. BLDP trading 4.50 up 7.42% intra-day spiking in to time cycle completion Oct 10, resistance 4.50 and the test range on the chart is reviewed.

BALLARD POWER, stock, chart, setup,
BALLARD POWER (BLDP) Five out of five of the last major time cycles price reversed, Oct 10 is next time cycle peak. $BLDP #swingtrading #tradealerts

BOAZUN $BZUN – Holding key support intra-day, if it holds a run up in price is possible. Termination of time cycle on 4 hour chart is near so get ready soon. High probability set-up. Details of trade set-up for BZUN reviewed in video. My bias is that this runs up.

ADVANCED MICRO $AMD – key support hit on chart and bounced, Oct 2 price target in bullish scenario is 33.62 and bearish scenario 22.87 in sell-off, mid quad on chart is discussed on video with various price target scenarios like 31.40 range being indecisive price target on Oct 2.

AMD, stock, chart
ADVANCED MICRO (AMD) hit key support and bounced, targets 33.62 Oct 2 or sell off 28.87, watch structure uoutlined on chart #swingtrading #tradealerts

OSI SYSTEMS $OSIS – trading 77.55 testing 50 MA and key Fibonacci resistance on diagonal Fibonacci trend line, price target 84.21 Dec 28 is possible in uptrend trading. Resistance and support lines and how to trade the chart is reviewed on the model in video.

OSI, stock, chart
OSI SYSTEMS (OSIS) Trading 77.55 testing 50 MA and key Fib resistance, over targets 84.21 Dec 28, 18 $OSIS #tradealerts #swingtrading

CARA THERAPEUTICS $CARA – I knew this one was going to get going, you don’t get many trade set-ups this strong.

There is a trade coaching bit of advice at this point on the video with reference to trading structured charting and its benefits to traders. Also market inflections and how to trade for your profit and loss and associated sizing in market inflections is also reviewed.

CARA is a great case study, going back to NBEV chart is reviewed on video – how price was getting bullish in to time cycle and how that relates to symmetry and price targets that can be traded.

28.20 is very likely fast in CARA trading if trade gets above key resistance. I put a trade alert out while recording video.

CARA, stock, chart, swing, tradin
CARA THERAPEUTICS (CARA) Nice swing trade from trading bootcamp in to next leg at resistance intra day $CARA #swingtrade #tradealert

ALIBABA $BABA – this is the swing trade that I was under water on, bounced of 100 MA, now back in it’s structure, has a number of tests, 206.85 price target to upside with 237.62 most bullish scenario May 27, 2019. See chart review in video.

ALIBABA, BABA, stock, chart
ALIBABA (BABA) bullish up 2% intra day, holding support of trading range well. Trim in to resistance add above. $BABA #tradealerts #swingtrade

LEVEL BRANDS $LVEB – anything over 6.00 will confirm an upside trend and if that triggers we’ll structure the charting for you and go from there.

ALTIMMUNE $ALT – hit 50 MA resistance today, alarmed for a breach above the 50 MA and a possible run to 100 MA. Will alert the trade in ALT if it breaches the 50 MA and structure the chart model for members.

$CRBP – chart is too choppy.

COOL HOLDINGS $AWSM – garbage chart.

$YGYI – trade never holds gains.

$AYTU – choppy trading, garbage chart.

XENETIC BIOSCIENCES $XBIO – there is a special trade set-up report out on this set-up in XENETIC BIOSCIENCESS (XBIO) chart, trading up 23% today.

$OSN – over 200 MA, no good, no structure.

NII HOLDINGS $NIHD – up 19% in trading today, aggressive chart, bounced off 20 MA, trading 5.06, good argument 5.60 as a watch area on other side of the bowl, 6.25 is a safer region to look at a possible big run to 9.00. A double upside extension is possible. It is a structured trading chart. I alarmed NIHD for a trade.

$ICCC – trading 9.13 up 20%, swing trading service provider dream, signal long when price is over 200 MA and win almost every trade, you would take the odd cut but the moves would make up any cuts taken.

$VXRT – trading 2.85, terrible chart.

$COE – bad chart.

$KNDI – not a bad chart, testing the 50 MA, over 200 MA you could start to look at it, this will likely go on a run upside over 200 MA, possible reversal setting up on this chart.

$FTNW – bad chart.

$COCP – bad chart.

$LOMA – bad chart.

TRADING ROOM VIDEO Trade Alerts:  #daytrading #swingtrading


Register to free email list for trade set-ups, webinars, special events: https://compoundtrading.com/contact/ 

Website: https://compoundtrading.com

Free chat room: https://discord.gg/2HRTk6n

Subscribe: https://compoundtrading.com/overview-…

Twitter: https://twitter.com/CompoundTrading

Lead Trader: https://twitter.com/curtmelonopoly

Tradingview: https://www.tradingview.com/u/curtmel…

Facebook: https://www.facebook.com/compoundtrad…

StockTwits: https://stocktwits.com/compoundtrading

Email: https://[email protected]

#tradealerts #swingtrading #daytrading

Article Topics; Trade Alerts, Trading, SwingTrading, DayTrading, Chart, Trade, Set-Ups, Signals, Price Targets, $NBEV, $CRON, Oil, $AAPL, $NFLX, $FB, $AMD, $BABA, $BLDP, $CARA, $EDIT, $BZUN

Read More
PreMarket Trading Plan Thurs Sept 13: $BABA, Inflections on Watch: Financials, Hurricane, $WTI, Oil, $GLD, Gold, $SLV, Silver, $BTC, $XBT, Bitcoin Swaps more.

PreMarket Trading Plan Thurs Sept 13: $BABA, Inflections on Watch: Financials, Hurricane, $WTI, Oil, $GLD, Gold, $SLV, Silver, $BTC, $XBT, Bitcoin Swaps more.

September 13, 2018September 19, 2018 Curt MelonopolyTrading Plan$AAPL, $AMD, $BTC, $FB, $GOOGL, $SNAP, $TLRY, $VZ, $WTI, Alerts, Bitcoin Swaps, Financials, GLD, Gold, Hurricane, Oil, Plan, Premarket, Silver, SLV, Stocks, Trade, Trading, Watchlist, XBT

Compound Trading Premarket Trading Plan & Watch List Thursday September 13, 2018. 

In this edition: Financials, Hurricane, $WTI, Oil, $GLD, Gold, $SLV, Silver, $BTC, $XBT, Bitcoin Swaps, $AAPL, $FB, $GOOGL, $SNAP, $TLRY, $AMD, $VZ and more.

Welcome to the morning Wall Street trading day session at Compound Trading.

Notices:

Notes in red text in this report are more recently important.

Scheduled Events:

  • September Live Trading Room Challenge, Coaching, News, Events, Q & A and More: information for existing members, those asking about our services and new on-boarding members.
  • Thursday Sept 13 – 
      • I’ll be live on mic live broadcast trading in main trading room #premarket 9:25 #daytrade momos and mid-day #swingtrading chart set-up reviews at 12:00 noon (pending market / scheduling conditions). If room is full message me so I can make room. GL today! Trading room link.
        • https://twitter.com/curtmelonopoly/status/1039833850308911104
      • September 6 premarket through September 31 the main live trading room will be open 24 hours a day (regular sessions and futures, with 1 hour breaks every 10 hours for server reboots) for a month of live recorded trading with our Lead Trader Curtis.The exception will be during the Cabarete Boot Camp Sept 14 – 16 (live trading room will be reserved for coaching event).The month of trading will then be posted to YouTube accompanied with highlight posts.
  • Before Sept 14 – New pricing published representing next generation algorithm models (existing members no change).
  • Before Sept 14 – Next generation algorithm models roll out (machine trading Gen 1).
  • Before Sept 14 – Trading Profit and Loss Published for Q1 and Q2 2018 (a report detailing trading / alert performance of our team).
  • Sept 14-16, Cabarete – Trade Coaching Event – Learn How to Trade or Take Your Trading to the Next Level (public, retail).

Machine Trade Coding Team Mandate: In current development and roll-out (1) Intelligent Assisted #IA Trading Platform (Code Algorithm Models), (2) Run 24 Hour Crypto Trading Desk, (3) Alert Trade Set-ups to Member Alert Feeds (for all models) and near future (4) Machine Learning. 

Premarket Report: On lead trader availability basis only (the premarket reports are not published every market day).

Private Member Discord Server Chat Rooms: BE SURE to get in to each private Discord server specific to your specific subscription type (bundles) – many of the updates as we go forward will be posted in there and detailed trading plans for alerted trades are often discussed by our lead trader in the rooms. This includes the SWING TRADING platform also. IF YOU NEED A LINK / INVITE email us.

https://twitter.com/CompoundTrading/status/880670140454637569

Real-time Trade Alerts:

Real-time Trade Alerts for Oil, Swing Trading, Day Trading, Bitcoin are available to subscribers by following specific alert Twitter feeds.

Oil Trading Alerts, Swing Trading Alerts, Day Trading Alerts, Bitcoin Trading Alerts.

Disclaimer / Disclosure, Terms of Use:

Subscribers to read disclaimer.

Blog / Video / Social Posts / Learn to Trade: 

#BitcoinTrading 101: A Beginner’s Guide to Getting Started $BTCUSD $XBTUSD $BTC https://compoundtrading.com/bitcointrading-101-beginners-guide-getting-started-btcusd-xbtusd-btc/ …

https://twitter.com/CompoundTrading/status/927397024315662336

How to Use EPIC Oil Algorithm: $USOIL, $WTI, $CL_F, $USO, $UCO, $SCO, $UWT, $DWT, #OIL, #OOTT: http://youtu.be/hawVV31G9bg?a via @YouTube

https://twitter.com/CompoundTrading/status/889148655785177088

How to Use ROSIE Gold Algorithm: #GOLD, $GLD, $XAUUSD, $GDX, $GDXJ, $NUGT, $DUST, $JNUG, $JDST

https://twitter.com/CompoundTrading/status/889147527278333952

Some Recent Chart / Trade Set-Up Reports: 

See YouTube, member email direct reports and blog for other recent videos or blog posts. Listed from most recent. Much of the premium member reporting posted below is delayed and may or may not require password.  

Sept 12 – Protected: XENETIC BIOSCIENCES INC How to Trade XBIO Snap-back Swing Trade. $XBIO #swingtrading #tradealert

Sept 10 – Protected: Analyzing Bitcoin Chart Patterns: Bitcoin Trade Alert – What to Expect Near Term #Bitcoin #Trading $BTC $XBT $VIX

Sept 5 – Day Trading and Swing Trading CRONOS GROUP Inc. (CRON)

Aug 16 – Oil Trade Alerts: How We Knew Where Oil Sell-Off Bottom Was in Advance. Crude Oil Trading Strategy.

Aug 12 – Crude Oil Trading Face-Off Results “Pro Trader” (Man) vs. EPIC Oil Algorithm (Machine Trading Tech)

Aug 7 – Protected: Swing Trading Earnings Special Report (Members) Tues Aug 7 $DIS, $AMD, $AAPL, $WMT, $FB, $JKS, $EXP, $LTBR, $SPY, $DXY more.

Aug 6 – Swing Trading Earnings Special Report (Members) Mon Aug 6 $BABA, $BA, $ARWR, $EDIT, $C, $DIS, $PSTG, $MXIM, $ATHM, $BWA, $LIT, $FB more.

Aug 5 – Protected: Swing Trading Earnings Special Report (Members) Sun Aug 5 $GPRO, $NFLX, $TAN, $TWLO, $WYNN, $XLE, $XLF, $X, $RIG…

Aug 5 – Protected: Swing Trading Earnings Special Report (Members) Sun Aug 5 $SNAP, $HIIQ, $FIT, $TWLO, $GOOGL, $FB, $CELG, $PSTG …

Aug 3 – Protected: Swing Trading Special Earnings Report (Members) $TSLA, $FB, $HIIQ, $GTHX, $PSTG, $FIT, $ATHM, $FEYE … #swingtrading #tradealerts

Aug 2 – Oil Trading Alerts Live Video w EPIC Oil Algorithm #EIA Report #Oil #Trading #Algorithm #Alerts $USOIL $WTI $CL_F

July 29 – Protected: Special Swing Trading Report (Members) #earnings Sun July 29 OIL, $RIOT, $SPY, $PSTG, $AMBA, $FSLR, $AAOI, $LITE, $CALA …

July 29 – Protected: Trading Alphabet (GOOGL) Post Earnings. Swing Trading, Day Trades, Investing (Member Edition) $GOOGL

July 28 – Protected: Trading Facebook (FB) Earnings Part 2 – Opportunity Knocks (Member Edition) $FB #trading #earnings

Protected: Trading Facebook (FB) Earnings Wash-out on Revenue Growth Warning (Member Edition) $FB #trading

Earnings Season Charting July 24 $RIOT, $CELG, $ARWR, $EXTR, $EDIT, $SOHU, $ESPR, $LPSN, $XOMA …

Earnings Season Charting July 24 $SPY, OIL, $VIX, $DXY, $GOOGL, $HCLP, $ARRY, $ARWR, $CDNA, $XXII, $SSW

Swing Trading Special Report $CELG, $RIOT, $ARWR, $EXTR, $EDIT, $MBRX, $SOHU, $ESPR, $LPSN, $XOMA.

Swing Trading Special Report $SPY, OIL, $VIX, $DXY, $GOOGL, $HCLP, $ARRY, $ARWR, $CDNA, $XXII, $SSW

Swing Trading Set-ups Special Report; $VIX, $DXY, $SPY, $DIS, $RCL, $RKDA, $SQ, $HEAR, $TGTX, $SMIT

Recent Educational Articles / Videos:

I get a lot of Q’s on How to Trade our models, this vid has 5 min explanation at 1:00 min-6:00 min. https://www.youtube.com/watch?v=QrXbE7lojAg&t=3s … – Fib Trendlines, Trading structure/quads, Price targets, Main support resistance (buy sell triggers), Time cycles, Moving averages, Trading trims/adds.

Trading Plan / Watch Lists. Morning Momentum / Gaps / News / PR / IPO / SEC Filings / Earnings Stocks on Watch: 

Currently have oil on watch for a quad decision up or down in premarket. Favor 69.83 for end of Friday at this point on FX $USOIL $WTI.

Long side trade alert in premarket for ALIBABA per below. Live chart link included for the trade alert. $BABA

Watching Gold and Silver for possible inflection point to bullish side. They still have some hurdles but it seems near. $GLD $SLV

Bitcoin recovering, so also watch that at this point. Trying to position for a run in to December. $BTC $XBT. Morgan Stanley’s Bitcoin swaps launch has me intrigued.

Watching financials for inflection $XLF, $BAC, $GS, $JPM, $C, $MS

If you missed yesterday’s premarket, there were a number of swing trade set ups in there that could inflect and become decent trades.

Market Observation:

Markets as of 7:27 AM: US Dollar $DXY trading 94.81, Oil FX $USOIL ($WTI) trading 69.41, Gold $GLD trading 1205.75, Silver $SLV trading 14.19, $SPY 289.88 (premarket), Bitcoin $BTC.X $BTCUSD $XBTUSD 6437.00 and $VIX trading 12.8.

Momentum Stocks / Gaps to Watch: $PI $XBIT $BLIN $ATOS

Impinj’s stock rockets after internal audit completed, upbeat results and outlook

$AAPL is taking a hit ahead of Apple’s big product launch, and one trader is betting on more pain ahead. We’ll explain why https://www.cnbc.com/2018/09/12/ahead-of-apples-product-launch-trader-is-playing-for-a-pullback.html …

$AAPL is taking a hit ahead of Apple’s big product launch, and one trader is betting on more pain ahead. We’ll explain why https://t.co/MFdtDe3gNM Program sponsor: @Schwab4Traders pic.twitter.com/mV7bY0NchZ

— Trading Nation (@TradingNation) September 12, 2018

News: 

$TLRY: Tilray receives necessary regulatory permits in Canada and Germany to export medical cannabis flower for… http://bit.ly/2OcguTr

Verizon in focus as former AOL chief Armstrong confirms exit $VZ $BABA $GOOG $GOOGL $FB http://dlvr.it/Qk3bFG

$FATE: Fate Therapeutics Enters into Exclusive License Agreement with Gladstone Institutes for CRISPR-based Cellular Reprogramming

$ATOS: Atossa Genetics Announces Preliminary Results from Male Phase 1 Study of Topical Endoxifen .. All Objectives Successfully Met

Stocks making the biggest move premarket: KR, TSLA, ADBE, HSY, WMT & more https://cnb.cx/2N9C0vO

Your Thursday morning Speed Read:

– Kroger reports mixed Q2, raises EPS guidance for the year $KR
– Pivotal ends its bear call on $SNAP, ups rating to Hold, seeing shares fairly valued
– The FCC 2 day begins a series of hearings related to Big Tech antitrust concerns $FB $GOOGL

Your Thursday morning Speed Read:

– Kroger reports mixed Q2, raises EPS guidance for the year $KR
– Pivotal ends its bear call on $SNAP, ups rating to Hold, seeing shares fairly valued
– The FCC 2day begins a series of hearings related to Big Tech antitrust concerns $FB $GOOGL

— Benzinga (@Benzinga) September 13, 2018

Bitcoin Gains Traction as Morgan Stanley Prepares Bitcoin Swap Trading –

Bitcoin Gains Traction as Morgan Stanley Prepares Bitcoin Swap Trading – https://t.co/hj0E7o8Sa3

— Investing.com News (@newsinvesting) September 13, 2018

Recent SEC Filings / Insiders:

Recent IPO’s:

Tesla rival Nio to go public after pricing IPO at low end of expectations

Zekelman Industries to offer 41.8 million shares in IPO, priced at $17 to $19 each

Eventbrite to offer 10 million shares in IPO priced at $19 to $21 each

Cancer blood-testing company Guardant Health files for IPO.

Eli Lilly’s Elanco sets IPO terms to raise up to $1.45 billion before options

Earnings:

Kroger’s stock drops after earnings beat, but sales come up short

#earnings for the week

$ADBE $KR $PLAY $PVTL $SONO $FRAN $TLRD $SKIS $CASY $LMNR $BRC $MTRX $SAIC $EYPT $LAKE $CDMO $COOL $FARM $AGTC $IRET $OXM $PTN $ACET $RLGT $CSBR $PCYG $STRM $ERYP $LOVE (& $MAMS)

http://eps.sh/cal

#earnings for the week$ADBE $KR $PLAY $PVTL $SONO $FRAN $TLRD $SKIS $CASY $LMNR $BRC $MTRX $SAIC $EYPT $LAKE $CDMO $COOL $FARM $AGTC $IRET $OXM $PTN $ACET $RLGT $CSBR $PCYG $STRM $ERYP $LOVE (& $MAMS)https://t.co/r57QUKKDXL https://t.co/wHU5AlivAx

— Melonopoly (@curtmelonopoly) September 8, 2018

Trade Set-up Alerts, Charts & Reports. Recent / Current Holds, Trade Alerts, Open and Closed Trades:

Please refer to the date at top left of each chart (charts are often carried forward for sometime).

$BABA long side premarket 165s swing trade targets 178.67 then 207.50 Dec 17, 2018. #swingtrading #trade #alerts

https://www.tradingview.com/chart/BABA/ljEpVODf-BABA-long-side-premarket-165s-swing-trade-targets-178-67-then-2/

ALIBABA, swing, trading, alerts, premarket, $BABA
$BABA long side premarket 165s swing trade targets 178.67 then 207.50 Dec 17, 2018. #swingtrading #trade #alerts

ALIBABA (BABA) from recent trade alert for weekly 100 MA bounce watch, up premarket trading 164.76. $BABA #tradealerts #premarket

ALIBABA, premarket, $BABA, trading, plan
ALIBABA (BABA) from recent trade alert for weekly 100 MA bounce watch, up premarket trading 164.76. $BABA #tradealerts #premarket

NEMAURA (NMRD) Premarket trading 2.98 up 4.2%, up 32.7% yesterday hit daily 200 MA area and backed off in previous trade.$NMRD #daytrading.

NEMARUA, stock, premarket
NEMAURA (NMRD) Premarket trading 2.98 up 4.2%, up 32.7% yesterday hit daily 200 MA area and backed off in previous trade.$NMRD #daytrading.

FOMIX PHARMA (FOMX) premarket up 31.4% trading 7.78 on positive results, resistance 8.00 range $FOMX #daytrading #stocks

FOAMIX, premarket, FOMX, stock, chart, trading, plan
FOMIX PHARMA (FOMX) premarket up 31.4% trading 7.78 on positive results, resistance 8.00 range $FOMX #daytrading #stocks

XENETIC BIOSCIENCES INC Premarket near 200 MA support test after sel;-off, near time cycle peak Sept 14, possible turn $XBIO #swingtrade #daytrade #tradealert

XBIO, trading, chart, stock, trade, alert
XENETIC BIOSCIENCES INC Premarket near 200 MA support test after sel;-off, near time cycle peak Sept 14, possible turn $XBIO #swingtrade #daytrade #tradealert

XENETIC BIOSCIENCES INC How to trade XBIO charting set-up number 1. $XBIO #swingtrading #tradealert

XBIO, trade, alert, swing, trading
XENETIC BIOSCIENCES INC How to trade XBIO charting set-up number 1. $XBIO #swingtrading #tradealert

XENETIC BIOSCIENCES INC How to trade XBIO charting set-up scenario Number 2. $XBIO #swingtrading #tradealert

XBIO, chart, option 2, trade alert
XENETIC BIOSCIENCES INC How to trade XBIO charting set-up scenario Number 2. $XBIO #swingtrading #tradealert

FREDS INC (FRED) On day two of gap and go continued to struggle with 200 MA wall. $FRED #daytrading #swingtrade #premarket

FRED, stock, premarket, trading, plan
FREDS INC (FRED) On day two of gap and go continued to struggle with 200 MA wall. $FRED #daytrading #swingtrade #premarket

PROQ THERAPEUTICS (PRQR) ran another 15% yesterday near a buy sell trigger resistance, trim in to it add above. $PRQR #swingtrading #daytrade

PRQR, premarket, stock, chart, trading, plan
PROQ THERAPEUTICS (PRQR) ran another 15% yesterday near a buy sell trigger resistance, trim in to it add above. $PRQR #swingtrading #daytrade

ALLERGAN (AGN) Chart structure reversal in to channel following call perfectly at this point. $AGN #swingtrading #chart

AGN, swing, trading, chart
ALLERGAN (AGN) Chart structure reversal in to channel following call perfectly at this point. $AGN #swingtrading #chart

FACEBOOK (FB) On watch for wash-out snap-back trade now, main support and resistance marked on chart $FB #swingtrade #daytrade

Facebook, chart
FACEBOOK (FB) On watch for wash-out snap-back trade now, main support and resistance marked on chart $FB #swingtrade #daytrade

DISNEY (DIS) From this target above 110.50 targets 118.00 area and below targets 103.00 area. $DIS #swingtrading #daytrading

Disney, stock, chart
DISNEY (DIS) From this target above 110.50 targets 118.00 area and below targets 103.00 area. $DIS #swingtrading #daytrading

APPLE (AAPL) If it doesn’t get a bounce here at 20 MA then 212.65 is the retracement point to try for a bounce. $AAPL #swingtrading #daytrading

AAPL, Apple, Stock, Chart
APPLE (AAPL) If it doesn’t get a bounce here at 20 MA then 212.65 is the retracement point to try for a bounce. $AAPL #swingtrading #daytrading

ALIBABA (BABA) If no bounce at 100 MA that is near it is most probable to bounce in 147 range. $BABA #swingtrading

Alibaba, BABA, chart
ALIBABA (BABA) If no bounce at 100 MA that is near it is most probable to bounce in 147 range. $BABA #swingtrading

ARROWHEAD PHARMA (ARWR) Upper parallel trending channel per previoys clearly in play at this point. $ARWR #swingtrading #daytrading #chart

ARWR, Arrowhead, stock, chart
ARROWHEAD PHARMA (ARWR) Upper parallel trending channel per previoys clearly in play at this point. $ARWR #swingtrading #daytrading #chart

TESLA (TSLA) Wash out playing out as expected-alerted, watch Fri time cycle peak for trade of 280. $TSLA #daytrading #swingtrading

TSLA, Tesla, stock, chart
TESLA (TSLA) Wash out playing out as expected-alerted, watch Fri time cycle peak for trade of 280. $TSLA #daytrading #swingtrading

PROQ THERAPEUTICS (PRQR) premarket resistance watch at diagonal Fib line overhead and 22.75, above sees 27.55 implied $PRQR #swingtrading #daytrade

PROQ, stock , chart, premarket, trading, plan
PROQ THERAPEUTICS (PRQR) premarket resistance watch at diagonal Fib line overhead and 22.75, above sees 27.55 implied $PRQR #swingtrading #daytrade

FREDS INC (FRED) Cleared 200 MA on daily, premarket next major resistance 50 MA on weekly. $FRED #daytrading #swingtrade #premarket

FRED, premarket, stock, chart
FREDS INC (FRED) Cleared 200 MA on daily, premarket next major resistance 50 MA on weekly. $FRED #daytrading #swingtrade #premarket

VOLATILITY (VIX) So we have a MACD turn up on weekly chart structure, Stoch RSI SQZMOM up, 20s possible Oct 1. $VIX $TVIX $UVXY #volatility #chart

VIX, volatility, chart
VOLATILITY (VIX) So we have a MACD turn up on weekly chart structure, Stoch RSI SQZMOM up, 20s possible Oct 1. $VIX $TVIX $UVXY #volatility #chart

BITCOIN (BTC) Wedge chart pattern on daily time-frame chart. $BTC $XBT $XBTUSD #Bitcoin #Chart

Bitcoin, BTC, chart, wedge
BITCOIN (BTC) Wedge chart pattern on daily time-frame chart. $BTC $XBT $XBTUSD #Bitcoin #Chart

CLOUDERA INC (CLDR) Premarket up 6.5% trading 18.75 with 22.00 target. $CLDR #daytrading #swingtrading

CLDR, Cloudera, premarket, trading, plan
CLOUDERA INC (CLDR) Premarket up 6.5% trading 18.75 with 22.00 target. $CLDR #daytrading #swingtrading

$BOX weekly leap frog perfectly through targets. #earnings #premarket

$BOX weekly leap frog perfectly through targets. #earnings #premarket pic.twitter.com/1xTDdq2BdY

— Melonopoly (@curtmelonopoly) August 28, 2018

Tapped the top of the resistance per below, retraced as predicted below. Move done. Thanks Tony. $DXY $UUP #USD @dxyusd_index

Tapped the top of the resistance per below, retraced as predicted below. Move done. Thanks Tony. $DXY $UUP #USD @dxyusd_index https://t.co/JMFbDchqtS

— Melonopoly (@curtmelonopoly) August 22, 2018

Market Outlook, Market News and Social Bits From Around the Internet:

#5things
-Turkey, BOE and ECB decisions
-Trade talks
-Florence weakens
-Markets rise
-Data due
https://bloom.bg/2NHCngz

#5things
-Turkey, BOE and ECB decisions
-Trade talks
-Florence weakens
-Markets rise
-Data duehttps://t.co/TQr2TERlqM pic.twitter.com/b8yh9zmAgl

— Bloomberg Markets (@markets) September 13, 2018

Oil prices fall, reversing some of the strong gains from the previous session, as economic concerns raises doubts about ongoing fuel demand growth https://reut.rs/2N83Mc1 by @hgloystein More from #ReutersEnergy: https://reut.rs/2CPVxfT

Oil prices fall, reversing some of the strong gains from the previous session, as economic concerns raises doubts about ongoing fuel demand growth https://t.co/rnWXstQpJl by @hgloystein More from #ReutersEnergy: https://t.co/lql35QNze4 pic.twitter.com/aJiUuFCI7a

— Reuters (@Reuters) September 13, 2018

Excess liquidity matters more than CB, but this is not a backdrop you want to be adding to risk from a macro level. Pick your spots.

https://twitter.com/RooseCapital/status/1040201823150387201

If you are new to our trading service you should review recent blog posts, the Compound Trading YouTube Channel and at minimum our algorithm Twitter feeds because they do tell a story in terms of the market and how the inflections of the market determine our day to day trading. You will notice the algorithmic modelling has been undeniably accurate with many time-frames (intra-day, weeks and months out) so I myself have learned to respect the math (they have taken me from a 60% hit rate to 80%+ all publicly posted live trade alerts).

Momentum Stocks (Market Open and Intra-Day):

I do trade morning momo stocks, but I do avoid much of the day trading risk (preferring to daytrade only what is structurally set-up also on the swing trade side and to my advantage in the algorithmic model charting). I often avoid the first 30 minutes (gap and go) and trade momentum stocks or structured (per explanation in previous sentence) stocks later in day after a wash-out looking for a snap-back trade that can possibly also become a strong swing or longer term trade that I can leg in to. Just prior to open and shortly after open I post momentum stocks to the trade chat room (and Twitter and Stocktwits if I have time).

Some of my Favorite Intra-day Trading Set-Ups:

(1) Momentum Stock Wash-Outs for Snap Back, (2) Bad News Wash-outs on Stocks with High Institutional Ownership, (3) Getting on the Right Side of a Trend Change and scaling in my position and (4) Our Algorithm Charting Model Set-Ups.

The momentum stocks (from previous days and morning trade) I continue to watch through the day for indicators that allow a trade.

Morning Stock Watch-Lists for my Favorite Set-Ups:

(1) Pre-Market Gainers Watch-List: $PI $XBIT $BPMX $ATOS $TLRD $IGC $TLRY $NLST $SNGX $VTL $BLPH $PDD $YINN $CARA

(2) Pre-market Decliners Watch-List :

Pivotal Software stock plunges 27% after billings miss

(3) Other Watch-List:

(4) Regular Algo Charting Watch-List: Gold $GC_F $GLD, Miners $GDX ($NUGT, $DUST, $JDST, $JNUG), Silver $SLV $SI_F ($USLV, $DSLV), Crude Oil FX: $USOIL $WTI ($UWT, $DWT, $USO, $UCO, $CL_F, $UWT, $DWT), Natural Gas $NG_F ($UGAZ, $DGAZ), S & P 500 $SPY $ES_F ($SPXL, $SPXS), US Dollar Index $DXY ($UUP), Volatility $VIX ($TVIX, $UVXY), $BTCUSD Bitcoin.

(5) Recent Upgrades: $MGA $SNAP $DVA $BHC $TRI $MEOH $INTC $AVY

Intel stock gains after Northland Capital ends bearish call.

Analyst initiates AMD at 24% upside https://seekingalpha.com/news/3389955-analyst-initiates-amd-24-percent-upside?source=feed_f … #premarket $AMD

Apple target lifted to $260 at Needham after iPhone event

$AAPL Apple Inc: Maxim Raises Target Price To $221 From $200

(6) Recent Downgrades: $WAGE $VNTR $STI $FEDU $TAL $CIEN $FNSR $HOLX $W $TXRH

Morgan Stanley goes to Equal Weight on optical, downgrades Finisar and Ciena $FNSR $CIEN $LITE $IIVI $ACIA http://dlvr.it/Qk3bF9

Morgan Stanley Downgrades Finisar $FNSR to Equalweight

ServiceMaster $SERV PT Lowered to $61 at Morgan Stanley

Stay tuned in Stock Chat Room for more pre-market stocks on watch.

Study:

For new readers, a review of our unlocked posts on our blog would help you get in to the story we are following with the securities listed in this newsletter.

Free scanners to find momentum stocks that you can easily review charts of for indicators that bring probability of your trade being successful up considerably. These are not useful for first 30 minute market open gap and go type plays (you need a good momentum scanner, level 2, and best to have hot-keys for the first 30 mins of gap and go trading)… but are very useful for intra day scalping and swing trading (start with trending stocks and then look at indicators intra for simple set-ups – study scan study scan study scan).

http://finviz.com/

https://finance.yahoo.com/screener/predefined/ec5bebb9-b7b2-4474-9e5c-3e258b61cbe6

http://www.highshortinterest.com/

http://www.gurufocus.com/short-stocks.php

http://www.3xetf.com/all/

http://www.etf.com/channels/gold-etfs

GL!

Curtis

Algorithm Twitter feeds can be found here: $BTC (@CryptotheAlgo) $WTI (@EPICtheAlgo), $VIX (@VexatiousVIX), $SPY (@FREEDOMtheAlgo), $GLD (@ROSIEtheAlgo), $SLV (@SuperNovaAlgo), $DXY (@DXYUSD_Index). Our Swing Trading Twitter feed is found here: https://twitter.com/swingtrading_ct. Our lead trader Twitter feed is here @curtmelonopoly

Article Topics: Premarket, Watchlist, Stocks, Trading, Plan, Alerts, Financials, Hurricane, $WTI, Oil, $GLD, Gold, $SLV, Silver, $BTC, $XBT, Bitcoin Swaps, $AAPL, $FB, $GOOGL, $SNAP, $TLRY, $AMD, $VZ

Read More
Swing Trading Earnings Special Report (Members) Tues Aug 7 $DIS, $AMD, $AAPL, $WMT, $FB, $JKS, $EXP, $LTBR, $SPY, $DXY more.

Swing Trading Earnings Special Report (Members) Tues Aug 7 $DIS, $AMD, $AAPL, $WMT, $FB, $JKS, $EXP, $LTBR, $SPY, $DXY more.

August 7, 2018December 30, 2018 Swing TraderSwing Trading$AAPL, $AMD, $DIS, $EXP, $FB, $JKS, $LTBR, $WMT, Alerts, Charts, DXY, earnings, SPY, Swing, Trade, Trading

Swing Trading Report. In this Special Earnings Season (Member Edition) Tuesday Aug 7, 2018: $DIS, $AMD, $AAPL, $WMT, $FB, $JKS, $EXP, $LTBR, $SPY, $DXY and more.

What’s New!

  • Interested in free swing trading setups? Click here to sign up for the Complimentary Swing Trading Report Mailing List.
  • Now available for serious traders – Legacy All Access Membership.

Mid Day Trade Set-Ups Webinar Video:

IMPORTANT: This video gets in to detailed trading levels to watch in your swing trades and also had a number of how to use our charting explanations. Very important to review the video and not just the summary below.

Mid Day Member Webinar – Swing Trading Set-ups Summary (from Aug 6 mid day review, published August 7, 2018):

Forward:

Swing Trading Special Earnings Season Report to cover trading the chart set-ups. Mid day review sessions will become the premise for our next major Q3 and Q4 positioning in the stock market.

We are reviewing all one hundred equities we have in coverage on our swing trading platform – all over the next ten days or so for earnings trading season.

Trade alerts are reviewed in this video that triggered today.

Be sure to actually watch this video as the summary below is only for reference and doesn’t give a whole picture for any of the trade set-ups listed.

All quoted support and resistance are approximate.

June 12 Swing Trading Regular Report is referenced in this special earnings report. Members can reference that report for charts you may need (or review the video) as some charting is not included in the report below due to weekly reporting time constraints. Also, please be sure to check date on the chart as the date may not reflect publish date depending on the scenario.

Earnings Season Stocks Covered in This Report; $DIS, $AMD, $AAPL, $WMT, $FB, $JKS, $EXP, $LTBR, $SPY, $DXY

Report published Aug 7 and recorded Aug 6, 2018 Mid Day Swing Trading Review.

July 12 Swing Trading Regular Member Report is referenced in this special earnings report. Members can reference those two reports for charts you may need.

Tickers:

SP500 $SPY – 283.74 by trigger hit, 284.93 resistance, bullish price target 299.00 on same day.

US Dollar $DXY – Watching the range resistance / support test area now for possible long trade. On a sell-off will not short.

Eagle Materials $EXP – Post earnings, positive earnings, trading 100.00, quad wall (Fibonacci trend line) support bounce 98.87. 179.92 resistance. Looking for a long side trade over upside resistance on chart.

https://www.tradingview.com/chart/EXP/jvbzZ09P-EAGLE-MATERIALS-EXP-Bounced-near-support-watching-for-a-possi/

DISNEY $DIS – Earnings Tuesday, price target 124.19 in a post earnings squeeze, downside 110.50 (yet to be seen),

$DIS, swing, trading, chart, earnings
DISNEY (DIS) Earnings Tuesday, price target 124.19 in a post earnings squeeze, downside 110.50. $DIS #trading #Earnings

FACEBOOK $FB – Facebook has been paying the bills this year. Traded last wash-out snap-back and now trading this one. Trading intra-day at quad wall resistance (down trending Fibonacci trend-line). Has 50 MA coming down over hear on 4 HR chart with 200 MA above that. Resistance 195.71, trading intra-day 183.69, support 181.70. Trading range reviewed on video. 195.71 price target Aug 9 in bullish trade scenario.

https://www.tradingview.com/chart/FB/hecaibE8-FACEBOOK-FB-Trading-intra-day-Tuesday-under-pressure-under-50/

$FB, FaceBook, swing, trading, chart
FACEBOOK (FB) Trading intra day Tuesday under pressure under 50 MA resistance. $FB #swingtrade #washout

APPLE $AAPL – Chart structure clean, resistance 205.30 and launched upside 209.80 next resistance 212.63. The buy sell triggers are explained on video for our charts (the white arrows). Main 200.58 support, 212.61 resistance, intraday resistance 209.80, intraday sup 205.77. Trading intraday 208.78 on other side of earnings. Trade alert sent out to members to trim longs in to the upside resistance area on chart. #swingtrading #earrnings

https://www.tradingview.com/chart/AAPL/usjkFK8A-APPLE-APPL-Trading-bullish-in-chart-structure-post-earnings/

APPLE, $AAPL, swing, trading, chart, earnings
APPLE (APPL) Trading bullish in chart structure post earnings, trade alert sent out to trim in advance of resistance.#swingtrading #earrnings

Advanced Micro $AMD – Against main pivot resistance 19.35 trading intra day, hit target July 20, trending for upside if over resistance the target is 21.75 Aug 15 with 24.50 most bullish, 17.04 in a sell-off is price target intra-day.

$AMD, Advanced Micro, swing, trading
ADVANCED MICRO (AMD) Trading intra-day 19.43 just a bit over resistance, on watch here for adds. #swingtrading #chart

WALLMART $WMT has earnings in ten days and is still struggling with 200 MA. Looks like a 200 MA upside resistance test in play. 91.10 main pivot resistance, 82.83 structural support. Intra day 87.17 support / resistance.

LightBridge Corp $LTBR – still under 200 MA running along support .896. Can’t trade it until over 200 MA for a long and short I’m not interested in for risk / reward.

Jinko Solar $JKS – Earnings in 7 days, 50 MA has made its way down with 20 MA and price, this is a good area to watch for a possible pop.

Not on video, included in editing below:

EDITAS MEDICINE (EDIT) Hit downside channel support #, over 27.96 adds for longs under channel support broken trade. $EDIT #swingtrade

https://www.tradingview.com/chart/EDIT/ZJng1Px3-EDITAS-MEDICINE-EDIT-Hit-downside-channel-support-over-27/

$EDIT, EDITAS, swing, trading, alerts
EDITAS MEDICINE (EDIT) Hit downside channel support #, over 27.96 adds for longs under channel support broken trade. $EDIT #swingtrade

#swingtrading #earnings #tradealerts

Charts and Chart Links re: Member Version.

(Mailing list versions that may be made available from time to time may not include charting or chart links and may or may not be published in a timely rotation).

If you have any questions about this special earnings trading report message me anytime. If you do not know how to take advantage of algorithmic structured trading charts please consider basic trade coaching of at least 3 hours to get on the winning side of your trading – you will find details here.

Cheers!

Curt

I get a lot of Questions about How to Trade our models, this vid has 5 min explanation at 1:00 min-6:00 min. https://www.youtube.com/watch?v=QrXbE7lojAg&t=3s … – Fib Trendlines, Trading structure/quads, Price targets, Main support resistance (buy sell triggers), Time cycles, Moving averages, Trading trims/adds.

Promo Discounts End Aug 14!

Temporary Promo Discounts (for new members only).

Subscribe to Weekly Swing Trading Newsletter service here Reg 119.00. Promo Price 83.30 (30% off). Promo Code “30P”. 

Or Real-Time Swing Trading Alerts Reg 99.00. Promo Price 69.37 (30% off). Promo Code “Deal30”.

I personally guarantee our swing trading service is one of the best in the business and it’s very reasonably priced considering the technical expertise invested in the platform (Lead Trader).

Subscribe to Swing Trading Service:

Swing Trading Bundle (Swing Trading Newsletter and Live Swing Trading Alerts).

Swing Trading Newsletter (Weekly Newsletter Published for Traders).

Real-Time Swing Trading Alerts (Private Member only Twitter Feed).

One-on-One Trade Coaching (Via Skype or In-Person).

Free Mailing List(s):

Join Email List for Free Trade Charting Trade Set-ups, Deals, Podcasts and Public Webinars.

Free Swing Trading Periodical Contact Form (Complimentary Swing Trade Set-Ups to Email)

Public Chat:https://twitter.com/swingtrading_ct

Visit our Free Public Chat Room on Discord.

#swingtrading #tradealerts #trading #earnings

Follow Me:

Tweets by swingtrading_ct

Read More
Swing Trading Report (Members) Sun July 29 $HCLP, $GOOGL, $AMZN, $FB, $HIIQ, $LITE, $ITCI, $IBB, $PSTG, $AGN, $EDIT, $FIT, $AMD

Swing Trading Report (Members) Sun July 29 $HCLP, $GOOGL, $AMZN, $FB, $HIIQ, $LITE, $ITCI, $IBB, $PSTG, $AGN, $EDIT, $FIT, $AMD

July 29, 2018December 30, 2018 Swing TraderSwing Trading, Trade Coaching$AGN, $AMD, $AMZN, $ARRY, $ARWR, $AXP, $EDIT, $EXP, $FIT, $GOOGL, $GTHX, $HCLP, $HIIQ, $IBB, $ITCI, $LITE, $PSTG, $VFC, $XRT, Chart, earnings, Report, Swing Trading, Trade

In this Special Earnings Season Swing Trading Report: $HCLP, $HIIQ, $LITE, $GTHX, $ITCI, $IBB, $PSTG, $ARRY, $AGN, $EDIT, $AXP, $FB, $GOOGL, $AMZN, $VFC, $FIT, $EXP, $XRT, $ARWR, $AMD and more.

What’s New!

  • Interested in free swing trading setups? Click here to sign up for the Complimentary Swing Trading Report Mailing List.
  • Now available for serious traders – Legacy All Access Membership.

Mid Day Trade Set-Ups Webinar Video:

IMPORTANT: This video did not work on the monitor that was recording the video (the audio did work however, so I included it for those that wish to listen to further detail). In lieu of the video charting I have included charting below for all the tickers discussed and more in this special earnings report. 

Mid Day Member Webinar Chart Swing Trading Set-ups Summary (from July 26 mid day, published July 29):

Swing Trading Special Earnings Season Report (member version) that will become the premise for our next major entries.

Stocks reviewed in this series for earnings: $HCLP, $FB, $HIIQ, $LITE, $GTHX, $ITCI, $IBB, $PSTG, $ARRY, $AGN, $EDIT, $AXP, $GOOGL, $AMZN, $VFC, $FIT, $EXP, $XRT, $ARWR, $AMD.

We are reviewing all one hundred equities we have in coverage on our swing trading platform – all over the next ten days or so for earnings trading season.

Members can refer to the previous swing trading report for charting to reference in the video (if not included below).

4 days in to 10 days of covering the 100 equities we cover regularly in our swing trading platform to be sure we’re on top of earnings.

$SPY – over 282.52 targets 284.96, 288.75 Aug 2 bullish price target with bearish target below per chart.

Oil – video explains recent oil trades.

$FB Facebook earnings wash-out trade. Refer to special reports published.

US Dollar $DXY – refer to chart structure and algorithmic reports.

American Express AXP – All time highs, 103.11, threatening break-out. See chart report below. Will be daytrading it Monday in hopes of getting a swing trade established.

$HCLP – Hi Crush Partners Testing 200 MA on weekly with Stochastic RSI turn up, MACD turn on weekly. Looking for big trade. #swingtrade #daytrade

$HIIQ – testing key support end of last week, earnings trade setting up here. 31.15 support, 33.20 resistance, 26.60 main support below, also a channel on chart with 35.55 main resistance and even 40.10 most bullish possible Nov1, 2018 (pending earnings action).

$LITE – under main structure resistance 53.95 trading 53.90 but stoch RSI is starting to turn up, earnings in 15 days,

$EDIT – see chart for explanation and video audio for trade plan.

$GTHX – expecting a good swing trade I’m in, 58,25 is first target Aug 27, trading 49.50 with earnings in 17 days.

$PSTG – see video for swing trade set-up below and audio on video for all support and resistance descriptions on chart.

$AMD – 17.02 support, 19.34 resistance, 18.16 trading intra, Aug 15 PT 19.39. Most bullish scenario 24.10 on time cycle expiry Aug 15, 2018. 16.98 is support and bearish scenario. Trading plan explanation on video.

$ARWR – in swing 1.3 sizing, up on day, swing structured so far. 17.15 range alarmed for an add. 19.50 Aug 22 price target for swing trade.

$AGN – see chart in report. 191.00 Sept 6 price target on my swing trade. 198.69 main resistance, 165.46 main support. Trading 177.06 intra. Listen to audio on video for various trade plan indicators and levels to watch for.

Referencing the June 20 swing trading report:

$XRT – various levels explained on video for upside and downside trading the set-up.

$EXP – sideways action, refer to last swing trade report for it for chart, trading really technical, support 105.07 earnings 4 days. Bullish 117.71, bearish 95.63 and 73.81 in major sell off. Upside most bullish 139.86. Trading 105.24. Nov 2 2018 is target date for quoted levels at end of time cycle.

$FIT – refer to special report sent out to members, the trade was one of the best this year, 5.61 main structural support, main resistance 6.65, under 50 MA. Currently testing resistance. 7.72 Aug 14 most bullish target, 6.66 below that, 5.57 and 4.54 bearish targets same date. Most probable 5.57 based on trend.

$VFC – trading 93.43 testing previous highs, interested in its break out if it trades above in to Monday.

$GOOGL – trading 1277.88 well above it’s moving averages, it’s a buy and don’t look. 1320.00 resistance, 1211.50 support, 1425.00 Oct 23, 2018 price target, in a sell off 1211.56 and 996.16 in a sell-off to serious bearish side.

$AMZN – not interested in chasing anything that extended over its moving averages, will wait for pull backs for entries.

Stocks Reviewed Specifically on the Video Above:

Below is an excerpt from the Special ALPHABET (GOOGL) Trading Report found here (refer to report for more detail):

Protected: Trading Alphabet (GOOGL) Post Earnings. Swing Trading, Day Trades, Investing (Member Edition) $GOOGL

ALPHABET (GOOGL) The projected July 3 target area did hit (albeit a bit late), current trade structure on chart, price came off at Fibonacci resistance / quad wall (diagonal down slope Fib trend line). $GOOGL

1320.20 is key range resistance.

1294.89 Fibonacci resistance and quad wall area price came off.

1263.00 Fib resistance.

1257.80 Fib resistance.

1252.89 trading intra.

1211.80 key range support.

1102.74 key range support one leg down in a sell-off.

Keep in mind the diagonal up trend yellow lines that illustrate the algorithmic channel. Above the channel is considerably over bought, mid channel (dotted yellow) has been historical buy zone and below that (yellow bottom channel line) is the bottom of the channel. Price is not visiting the bottom of the channel, but in a sell-off scenario this will be a considerable buy zone to contemplate.

Current trading range is highlighted in the green triangle. For shorter time frame traders long near bottom of the triangle and short at the outter upper edge of trading structure (triangle) are key points for trimming longs and adding etc.

Upside is limited here for new entries unless price nears the mid channel (dotted yellow).

Also pay attention to those trajectory lines (green) from target to target, you will find trade will react to those areas. This should only be considered for short time frame trims and adds.

Most probable target is 1320.20 October 24, 2018 but the 1440.00 area at top of channel on October 24 is also possible.

In a sell-off 1211.80 area is likely and in considerable sell-off look to 1102.00 then 994.00 on same Oct 24, 2018 time cycle peak – unlikely but noted.

Our Google Trading Plan:

We have been long for some time (in accordance to alerts and swing trading member reports), we are trimming at top of this trading structure (triangle in green) and adding at bottom of structure until the structure is broke and then we will move to the next.

Below is the Google chart with live link:

https://www.tradingview.com/chart/GOOGL/1YeFqwto-ALPHABET-GOOGL-The-projected-July-3-target-area-hit-current-t/

$GOOGL, swing, trading, earnings, chart
ALPHABET (GOOGL) The projected July 3 target area hit, current trade structure on chart, came off at resistance quad. $GOOGL #swingtrading #earnings

$GOOGL Alphabet is looking even better after Facebook’s disappointing earnings #swingtrading #earnings $FB https://cnb.cx/2LZ6jRe

Google is laying the groundwork for life beyond advertising $GOOGL #swingtrading https://qz.com/1342305/google-is-laying-the-groundwork-for-life-beyond-advertising/?utm_source=YPL&yptr=yahoo

Facebook (FB) – Please refer to the Special Trading Report found at the link below.

Protected: Trading Facebook (FB) Earnings Part 2 – Opportunity Knocks (Member Edition) $FB #trading #earnings

FACEBOOK (FB) Closed Friday just above 50% Fibonacci retrace pivot in trading structure alerted to members $FB #swingtrade #daytrade

Facebook, trading, plan, swing, day trading, chart, earnings
FACEBOOK (FB) Closed Friday just above 50% Fibonacci retrace pivot in trading structure alerted to members $FB #swingtrade #daytrade

AMAZON (AMZN) Daily chart – watching for Stochastic RSI and MACD to turn back up for possible long trade. $AMZN #swingtrading

Per comments above and in video (audio) “$AMZN – not interested in chasing anything that extended over its moving averages, will wait for pull backs for entries.”

https://www.tradingview.com/chart/AMZN/xOK3umdO-AMZN-not-interested-in-chasing-anything-that-extended-over-it/

AMZN, Amazon, trading, chart, swing, earnings
AMAZON (AMZN) Daily chart – watching for Stochastic RSI and MACD to turn back up for possible long trade. $AMZN #swingtrading

Hi Crush Partners Testing 200 MA on weekly with Stochastic RSI turn up, MACD turn on weekly. Looking for big trade. #swingtrade #daytrade $HCLP

https://www.tradingview.com/chart/HCLP/QqffkORw-Hi-Crush-Partners-Testing-200-MA-on-weekly-with-Stochastic-RSI-t/

HCLP, chart, swingtrade, daytrade, setup
Hi Crush Partners Testing 200 MA on weekly with Stochastic RSI turn up, MACD turn on weekly. Looking for big trade. #swingtrade #daytrade $HCLP

3 Top Stocks to Buy Under $20 $HCLP $CYOU $GLUU https://finance.yahoo.com/news/3-top-stocks-buy-under-204600726.html?soc_src=social-sh&soc_trk=tw

Health Innovations (HIIQ) Testing key support with earnings in four days, will be looking for a trade post earnings $HIIQ chart. #swingtrade #earnings

https://www.tradingview.com/chart/HIIQ/4U1A9VG7-Health-Innovations-HIIQ-Testing-key-support-with-earnings-in-f/

$HIIQ, trade, set up, chart, earnings
Health Innovations (HIIQ) Testing key support with earnings in four days, will be looking for a trade post earnings $HIIQ chart. #swingtrade #earnings

LUMENTUM HOLDINGS INC (NASDAQ LITE) Coming in to earnings at key mid quad, looking for trade other side of ER $LITE #swingtrade #earnings

https://www.tradingview.com/chart/LITE/dZZeh7EA-LUMENTUM-HOLDINGS-INC-NASDAQ-LITE-Coming-in-to-earnings-at-key/

LITE, swing, trading, chart, earnings
LUMENTUM HOLDINGS INC (NASDAQ LITE) Coming in to earnings at key mid quad, looking for trade other side of ER $LITE #swingtrade #earnings

G1 THERAPEUTICS (GTHX) Over mid quad key support in swing trade long here. Targets on chart. $GTHX #swingtrade

https://www.tradingview.com/chart/GTHX/sduHWAAf-G1-THERAPEUTICS-GTHX-Over-mid-quad-key-support-in-swing-trade/

$GTHX, swing trade, chart, earnings
G1 THERAPEUTICS (GTHX) Over mid quad key support in swing trade long here. Targets on chart. $GTHX #swingtrade

Recent Charting Alarms / Trade Alerts that Triggered in the Live Trading Room:

INTRA CELLULAR (ITCI) Trading 20.16 above key mid quad Fib support 19.77, price targets 24.60 (preferred), 19.77, 14.66 Sept 6, 2018 $ITCI

The upper price target for Sept 6, 2018 at this point is still in play at 24.60 (follow green arrow trajectory). If mid quad support (Fibonacci support) at 19.77 is breached to downside then the mid price target (yellow arrow) or lower price target red arrow are in play. Notice the technical trade as trade has used the trajectory of the green arrow trending toward the upper price target has been used as resistance in trade and trade close Friday at the quad wall support (diagonal Fibonacci up trending trend line – orange dotted).

The white arrows on the chart are your main buy sell triggers. They represent important Fibonacci levels. When price breaches the buy sell trigger down then bias is to the short side to the next price buy sell trigger only if the trading trend is in that direction (trajectory). The opposite is true if price breaches to the upside. Each horizontal line or diagonal line and moving average then becomes a support or resistance test as price trends toward the next appropriate target.

The red horizontal lines are conventional historical support and resistance that can be used for timing intra day entries or trims as needed.

Also note that trade is still above the 200 MA on this daily chart structure (bullish at this juncture of trade). If trade turns back up it will be interesting to see if it turns before price gets to the downside and hits the 200 MA test. Note last time price did fall below the 200 MA on the daily BUT PRICE REVERSED AT THE QUAD WALL. This is important as it displays the importance over the quad wall support and resistance areas on the charts. And note, the 200 MA was used as support the time prior to that. The point being, all the lines on these charts are important and as a trader that does not like to lose and wants to receive the greatest ROI on each trade, I rely on entries and exits with the “lines” or indicators on these charts to ensure I see an addition 10, 20, 30% on every trade simply because I know where the machines will execute liquidity in to each decision of trade in the structure of the instrument being traded. This allows for precision trading – this is important for swing trading and investing, not only daytrading.

The last important observation on this chart structure is the symmetry. Symmetry is another word for Sesame Street in charting. Look at the price targets. The last two upper quadrant price targets were hit, the first had price over shoot some and the second the price under shot the price some. Nonetheless, there is symmetry and this will be weighted in my personal swing trading plan.

The charting observations above are representative of typical lesson points students receive in our trade coaching service.

The charting observations above are representative of typical lesson points students receive in our trade coaching service. Understanding the battle field layout (the charting or financial instrument structure) and the reasons to be long or short biased based on trade in the chart structure are key to your success as a trader – the importance of this are vital for daytrading, swingtrading and investing.

https://www.tradingview.com/chart/ITCI/i3uB0QtT-INTRA-CELLULAR-ITCI-Trading-20-16-above-key-mid-quad-Fib-suppo/

ITCI, swing trading, chart, earnings
INTRA CELLULAR (ITCI) Trading 20.16 above key mid quad Fib support 19.77, price targets 24.60 (preferred), 19.77, 14.66 Sept 6, 2018 $ITCI #swingtrading #earnings

$ITCI Intra-Cellular Therapies to Host Second Quarter 2018 Financial Results Conference Call and Webcast #earnings https://finance.yahoo.com/news/intra-cellular-therapies-host-second-120000332.html?soc_src=social-sh&soc_trk=tw

Biotechnology Fund (IBB) Closed 115.41 just under key resistance 122.31. Bullish PT 142.21 Nov 30 bearish 102.57 $IBB #swingtrading

https://www.tradingview.com/chart/IBB/uBDwGkLG-Biotechnology-Fund-IBB-Closed-115-41-just-under-key-resistance/

IBB, Chart, swing trading, earnings
Biotechnology Fund (IBB) Closed 115.41 just under key resistance 122.31. Bullish PT 142.21 Nove 30 bearish 102.57 $IBB #swingtrading

$AMGN Amgen Beats Estimates, Reports Growth in Q2 2018 $IBB https://marketrealist.com/2018/07/amgen-beats-estimates-reports-growth-in-q2-2018 #earnings

$CELG Celgene Raises Revenue Guidance after Solid Growth in Q2 2018 $IBB #earnings https://finance.yahoo.com/m/15d9d5cd-86e5-37e1-a2ee-782d9c8c7b0a/celgene-raises-revenue.html?soc_src=social-sh&soc_trk=tw

PURE STORAGE (PSTG) Closed Friday just above key support. Below targets 19.25 Oct 1 above 25.92. $PSTG #swingtrading

Not an easy stock to short, but if it loses key support a short may be okay if monitored closely. I would prefer a bounce here and a long in to the next price targets – preferably the 25.92 Oct 1 swing trade price target in a continued uptrend. Will monitor this one closely Monday.

https://www.tradingview.com/chart/PSTG/DZBVOd1O-PURE-STORAGE-PSTG-Closed-Friday-just-above-key-support-Below/

PSTG, Pure Storage, chart, swingtrading, earnings
PURE STORAGE (PSTG) Closed Friday just above key support. Below targets 19.25 Oct 1 above 25.92. $PSTG #swingtrading

May 16, 2018 $PSTG Special Trading Report we published is available here for $STUDY reference;

How to Trade Pure Storage (PSTG) Earnings in Six Days (Member Edition) $PSTG

$PSTG Pure Storage Positioned as a Leader in Gartner Magic Quadrant for Solid-State Arrays for Fifth Co… #swingtrading https://finance.yahoo.com/news/pure-storage-positioned-leader-gartner-200500009.html?soc_src=social-sh&soc_trk=tw

3 Tech Stocks for Growth Investors to Buy Now $MOMO $HEAR $PSTG #swingtrading https://finance.yahoo.com/news/3-tech-stocks-growth-investors-205308353.html?soc_src=social-sh&soc_trk=tw via

ARRAY BIOPHARMA (ARRY) At chart trading structure support test, targets 18.37 on reversal or 13.39 on pressure. $ARRY #swingtrading #chart

Another stock I will be watching closely Monday for a possible reversal is Array BioPharma. It closed the week on this weekly chart structure at the quad wall support. If it turns up on positive indicators I’ll take a trade for the upside target. Yet to be seen. On watch.

https://www.tradingview.com/chart/ARRY/VKZrAJBU-ARRAY-BIOPHARMA-ARRY-At-chart-trading-structure-support-test/

ARRAY BioPharma, $ARRY, weekly, chart, swingtrading
ARRAY BIOPHARMA (ARRY) At chart trading structure support test, targets 18.37 on reversal or 13.39 on pressure. $ARRY #swingtrading #chart

$ARRY BRAFTOVI™ (encorafenib) + MEKTOVI® (binimetinib) Receives Positive CHMP Opinion for Adv BRAF… #swingtrading https://yhoo.it/2OnDoIa

ALLERGAN (AGN) swing trade continues, 180.28 resistance hit, over then targets 184.62 main resistance Aug 16. $AGN #swingtrading

https://www.tradingview.com/chart/AGN/9NrnOsji-ALLERGAN-AGN-swing-trade-continues-180-28-resistance-hit-ove/

AGN, swingtrade, chart
ALLERGAN (AGN) swing trade continues, 180.28 resistance hit, over then targets 184.62 main resistance Aug 16. $AGN #swingtrading

June 7 Special Trading Report for AGN. Protected: How to Trade Allergan (AGN) Stock Move (Exclusive) $AGN #swingtrading #daytrading #chart

$AGN I know it’s psychedelic but I think time cycle over soon. https://www.tradingview.com/chart/AGN/001O0j7h-ALLERGAN-AGN-Excellent-swing-trade-in-progress-trading-177s-t/

ALLERGAN $AGN 147s to 181.50 HOD on Friday #swingtrading #tradingedge #careertrade

https://twitter.com/curtmelonopoly/status/1005060263953993729

Pharma Favorites: 7 Healthy Picks in the Drug Sector #swingtrading $AGN $ABT $SNY $AZN $ABBV … http://www.investopedia.com/investing/pharma-favorites-7-healthy-picks-drug-sector?utm_source=twitter&utm_medium=social&utm_campaign=shareurlbuttons

EDITAS MEDICINE (EDIT) Sell-off nears key support 27.95 for an add to swing, trading 29.70 Friday $EDIT #swingtrade #alerts

https://www.tradingview.com/chart/EDIT/0ChNjCGB-EDITAS-MEDICINE-EDIT-Sell-off-nears-key-support-27-95-for-an-a/

EDIT, swing trade, alerts
EDITAS MEDICINE (EDIT) Sell-off nears key support 27.95 for an add to swing, trading 29.70 Friday $EDIT #swingtrade #alerts

3 Top Healthcare Stocks to Buy Right Now $CELG $EDIT $ABMD #swingtrading https://finance.yahoo.com/news/3-top-healthcare-stocks-buy-202000177.html?soc_src=social-sh&soc_trk=tw

AMERICAN EXPRESS (AXP) Closed Friday in clear break out post earnings. Will likely daytrade this Monday and maybe swing it if DT goes well. $AXP #daytrade #earnings

AXP, daytrade, swing, earnings, chart
AMERICAN EXPRESS (AXP) Closed Friday in clear break out post earnings. Will likely daytrade this Monday and maybe swing it if DT goes well. $AXP #daytrade #earnings

Charts and Chart Links for Member Version Only

(Mailing list versions that may be made available from time to time do not include charting or chart links).

If you have any questions about this special earnings trading report message me anytime. If you do not know how to take advantage of algorithmic structured trading charts please consider basic trade coaching of at least 3 hours to get on the winning side of your trading – you will find details here.

Cheers!

Curt

Temporary Promo Discounts (for new members only).

Subscribe to Weekly Swing Trading Newsletter service here Reg 119.00. Promo Price 83.30 (30% off). Promo Code “30P”. 

Or Real-Time Swing Trading Alerts Reg 99.00. Promo Price 69.37 (30% off). Promo Code “Deal30”.

I personally guarantee our swing trading service is one of the best in the business and it’s very reasonably priced considering the technical expertise invested in the platform (Lead Trader).

Subscribe to Swing Trading Service:

Swing Trading Bundle (Swing Trading Newsletter and Live Swing Trading Alerts).

Swing Trading Newsletter (Weekly Newsletter Published for Traders).

Real-Time Swing Trading Alerts (Private Member only Twitter Feed).

One-on-One Trade Coaching (Via Skype or In-Person).

Free Mailing List(s):

Join Email List for Free Trade Charting Trade Set-ups, Deals, Podcasts and Public Webinars.

Free Swing Trading Periodical Contact Form (Complimentary Swing Trade Set-Ups to Email)

Public Chat:

Visit our Free Public Chat Room on Discord.

Follow Me:

Tweets by swingtrading_ct


Read More
Swing Trading Report Thurs July 12 (Part A) $AAPL, $AMD, $WMT, $LTBR, $RCL, $JKS, $PCRX, $EWZ, $FEYE more.

Swing Trading Report Thurs July 12 (Part A) $AAPL, $AMD, $WMT, $LTBR, $RCL, $JKS, $PCRX, $EWZ, $FEYE more.

July 12, 2018December 30, 2018 Swing TraderSwing Trading$AAPL, $AMD, $EWZ, $FEYE, $JKS, $LTBR, $PCRX, $RCL, $WMT, Compound trading, Picks, Stock, Swing, Trading

Compound Trading Swing Trade Report Thursday July 12, 2018 (Part A).

Swing Trading Stock Picks In this Issue:  $AAPL, $AMD, $WMT, $LTBR, $RCL, $JKS, $PCRX, $EWZ, $FEYE and article links to $EQJ $RSX $EZA $EWW more. 

Email us at [email protected] anytime with any questions about any of the swing trades listed below. Or, if we get bogged down private message Curtis in trade room or direct message him on Twitter. Market hours are tough but we endeavor to get back to everyone after market each day.

Notices:

Below is Part A of this report. 

This report is 1 of 5 in rotation with our mandate being one report per week on average cycling the five reports that include over one hundred equities every five weeks (approximately).

We will categorize our coverage soon as we are following more stocks weekly than we expected when we first started the service.

When managing your trades with the weekly reports keep in mind that you will have to invest an hour or two a week to check the indicators mentioned for buy and sell triggers. I was asked recently why we do not usually (although we do sometimes) include precise entry and exit points. The reason is simple, they don’t work – those services have terrible results.

Swing trading success, even with a service, does require “some” maintenance on the part of the user, although the new live alert service will take much of that burden off the user as we know many of our users have busy lives. It is the indicators lining up that signal a trade long entry or an exit. In our case rely heavily on MACD on daily or weekly (or Stoch RSI and Moving averages) but indicators we are basing our trade entry and exits on are listed with each trade so any user that does even moderate trade management will know when the indicator(s) have turn with or against the trade.

Intra-week you can DM myself on Twitter (@curtmelonopoly), visit me on Discord (http://discord.gg/2HRTk6n) and private message me or email me ([email protected]) with specific questions regarding trades you are considering. You can also visit the main trading room at mid-day and ask questions by text in the chat area of the room.

It is critical that you attend to the maintenance of your signals at least once a week if not twice and set stops and preferably alarms so that intra-week you can enter / exit or add / trim as required. If nothing else you can always book some coaching time and I’ll assist.

IF WE DON’T GET BACK TO YOU RIGHT AWAY it is usually because we are pressured with deadlines or are trading.

Also, as live charts are made available below, click on link and open viewer. Then to use chart yourself click on share button at bottom right (near thumbs up) and then click “make it mine”.

Newer updates in red for ease.

Recent Compound Trading Videos and/ or Blog Posts for Swing Traders / Charting Set-Ups:

See You Tube for other recent video posts. Listed from most recent.

“The Nut Hand” Today’s Huge Oil Trade Win. Exactly How It Was Done. How I Knew & How You Can Too.

How to Swing Trade Like the Pros and Win Most Trades. #swingtrading #freedomtraders

Password: IC Protected: How to Trade Allergan (AGN) Stock Move (Exclusive) $AGN #swingtrading #daytrading #chart

FITBIT INC CLASS A (NYSE: FIT). How to Trade FitBit for 40% Gain (Member Exclusive) $FIT #swingtrading #daytrading #chart

Password: TRADEAAPL Protected: Trading Apple’s Stock Move (Member Exclusive) $AAPL #swingtrading

Password: SWINGDXY, Protected: Trading US Dollar Index (Part 2 – Member Exclusive) $DXY $UUP #USD #SwingTrading #Daytrading

Password: swing Protected: Trade Set-Ups w/ Video #EIA, Oil, $TSLA, $NFLX, $ESPR, $PG, $AAPL, $SPY, $CARA, $EGY, $GERN, $BPT more. #swingtrading

CRITICAL Oil Trade. Weekly Timing. EPIC Oil Algorithm Channel $USOIL $WTI $CL_F $USO #OilTrading #EIA

Feature Post with Charting: How to Trade the US Dollar Index Move (Part 1) $DXY $UUP #USD #trading #chart #algorithm https://compoundtrading.com/feature-post-with-charting-how-to-trade-the-us-dollar-index-move-part-1-dxy-uup-usd-trading-chart-algorithm/

Charts, Video and Summary of Swing Trade Set-ups May 21, 2018 $PSTG, $ITCI, $AAPL, $SPY, $NFLX, $PG, $BOXL, $TRXC more.

Feature Post: 12 of Last 13 Oil Chart Time-Cycles Have Trend Reversal. $USOIL $WTI $CL_F $USO $UCO $UWT $DWT #OIL #OOTT

Password: SET Protected: Swing Trade Set-Ups (May 15/16 Member Edition) $WTI, #OIL, $BTC, Bitcoin, $AMBA, $AMD, $BLNK, $ITCI,, $SPY, $DIS, $LAC, $BOX, $AAOI more.

Password: AI Protected: How to Trade Pure Storage Earnings in Six Days (Member Edition) $PSTG

Password ITCI: Protected: Trade Set-Ups (May 14 /15 Member Edition) $BOX, $ITCI, $SPY, $EEM, $PFE, $BTC, Bitcoin, SILVER, $SLV, $ETH, Ethereum, $EOG, $EDIT, $EXP more.

Password: WOW Protected: How to Trade Box Earnings Move (Swing Trade Member Exclusive)

Protected: Trade Set-Ups (May 8 Member Edition) $AAPL, $DIS, $AMD, $ITCI, $AAOI, $SNAP, $FB, $TSLA, $EDIT, $ESPR, $LITE, $LPSN, $SPY.

May 7 – Trade Set-Ups, Consolidated Review $SPY, $AAPL, $TSLA, $SNAP, OIL, $DXY, $VIX, GOLD, $DIS, Silver more.

Trading Set-ups $FB, $AMBA, $SDTY, $TSLA, $GDX, $SLV, $BTC, $JD, $VIX, $LITE, $CELG, $FSLR more.

Do Not Ignore This Trade Set-Up | $AMBA Swing Trade | 40% ROE 3 Mos (Part 1 of 2)

Email us at [email protected] anytime with any questions about any of the swing trades listed below. Or, if we get bogged down private message Curtis in trade room or direct message him on Twitter. Market hours are tough but we endeavor to get back to everyone after market each day.

Swing Trading Stock Watch List

$AAPL – Apple

July 12 – Decision area continues for Apple trade.

APPLE (AAPL) Continues to rotate around the primary 188.59 pivot, Use the fib lines to trade up or down. #swingtrading

https://www.tradingview.com/chart/AAPL/Naol1Uho-APPLE-APPL-Continues-to-rotate-around-the-primary-188-59-pivot/

APPLE, APPL, swingtrading, chart
APPLE (APPL) Continues to rotate around the primary 188.59 pivot, Use the fib lines to trade up or down. #swingtrading

May 29 – There is an exclusive member feature post here that reflects the report below:

Protected: Trading Apple’s Stock Move (Member Exclusive) $AAPL #swingtrading

Password: TRADEAAPL

May 29 – Apple chart support and upside move test on deck with 20 MA coming up to 185.78 support and current trade at 197.90 $AAPL #swingtrading

Apple Real-Time Chart Link:

https://www.tradingview.com/chart/AAPL/9LfMFbNf-Apple-support-and-upside-move-test-on-deck-with-20-MA-coming-up/

How to Trade Apple:

Either side of the main buy / sell trigger (pivot) in this range are the important levels to watch. The pivot is 188.61 and the important upside test Fib is at 199.44 and the important support is 185.78 area.

With the 20 MA moving up through the lower support and nearing intra-day trade this could get interesting here. If price loses the 20 MA watch for the support to break. If that breaks at 185.78 then price targets 181.75.

If price trends up with 20 MA then next resistance is the 199.44 and above that is a good upside swing risk reward.to next pivot at 200.66.

It seems with the news below (announcements on June 4, 2018 per CNBC) and how well Apple held up in today’s sell-off that the risk reward is still to the bullish side. But let the test of the upside resistance prove the bull thesis out.

Apple News:

$AAPL Apple will lay out its plans and priorities for the next year on Monday: Here’s what to expect

https://cnb.cx/2L63Bso  https://www.cnbc.com/2018/05/29/apple-wwdc-2018-what-to-expect-ios-12-macos-tvos-watchos.html?__source=yahoo%7Cfinance%7Cheadline%7Cstory%7C&par=yahoo&yptr=yahoo

Buy / sell triggers to watch for a swing trade with Apple stock (approximate):

176.62

181.75

185.78

188.61

191.44

194.94

200.66

205.79

209.81

Apple Static Chart:

$AAPL, Apple, stock, chart, swingtrading
Apple support and upside move test on deck with 20 MA coming up to 185.78 support and current trade at 197.90 $AAPL #swingtrading

April 16 – $AAPL Buy sell trigger 152.66 hit, then 164.92 testing 176.62. Over long to PT 188.61 with 181.75 and 185.78 res tests.

Apple has been a fantastic structured wash-out snap back swing trade set-up so far. The big test / major pivot in this trading structure is the upside test at 176.62. Longs should trim in to that and add over to next test at 181.75 and add over and so on.

The other scenario is a retrace to the Fibonacci support at 171.22 and on bounce long. If price does not bounce on a retrace to 171.22 then short in to 167.41 as first target.

https://www.tradingview.com/chart/AAPL/LZtFuzkN-AAPL-Buy-sell-trigger-152-66-hit-then-164-92-testing-176-62-O/

Also, MACD on daily is turned up but Stochastic RSI is high and likely to cool lower with price and then watch for bounce.

$AAPL, swing trade, buy, sell, price, targets
$AAPL Buy sell trigger 152.66 hit, then 164.92 testing 176.62. Over long to PT 188.61 with 181.75 and 185.78 res tests.

$AMD Advanced Micro 

July 12 – ADVANCED MICRO (AMD) Trading near previous highs struggling to hold up trend channel, trade main triggers. #swingtrading

News: Why AMD Stock Will Rally Before Its Earnings Announcement $AMD https://finance.yahoo.com/news/why-amd-stock-rally-earnings-035823418.html?soc_src=social-sh&soc_trk=tw via @YahooFinance

https://www.tradingview.com/chart/AMD/QBJGKEDZ-ADVANCED-MICRO-AMD-Trading-near-previous-highs-struggling-to-h/

AMD, chart
ADVANCED MICRO (AMD) Trading near previous highs struggling to hold up trend channel, trade main triggers. #swingtrading

April 29 – $AMD The close this gets to the key resistance in 14.60s the more short bias I am for a swing trade.

This surprised me since last report (I did some review on this surprise on a number of mid day review videos on YouTube channel).

Anyway, I don’t like the way it trades… it is manipulated by media, sentiment or otherwise and as it gets closer to previous highs overhead soon and near the key resistance in 14.60s I am yet again short bias to $AMD:) We’ll see, but I’ll likely pull the trigger this time.

https://www.tradingview.com/chart/AMD/LkPGXCud-AMD-The-close-this-gets-to-the-key-resistance-in-14-60s-the-mor/

$AMD, chart, swing, trade, short
$AMD The close this gets to the key resistance in 14.60s the more short bias I am for a swingtrade

$WMT – Walmart

WALMART (WMT) Continues down trend with 82.81 buy zone and 91 sell trigger, under 200 MA $WMT #chart

Walmart Buy / Sell Triggers:

124.77

116.23 – tighter time-frame

108.06

99.56 – tighter time-frame

91.20

74.25

Walmart is ‘dead money’ as the Dow stock sits in a bear market, says trader $WMT https://www.cnbc.com/2018/07/11/walmart-is-dead-money-as-the-dow-stock-sits-in-a-bear-market.html?__source=yahoo%7Cfinance%7Cheadline%7Cstory%7C&par=yahoo&yptr=yahoo

https://www.tradingview.com/chart/WMT/Ey36Xdx1-WALLMART-WMT-Continues-down-trend-with-82-81-buy-zone-and-91-s/

WMT, chart
WALLMART (WMT) Continues down trend with 82.81 buy zone and 91 sell trigger, under 200 MA $WMT #chart

May 29 – Wallmart stock continues its soft landing but indicators are flatening. Short side RR diminishing now.

I wouldn’t be surprised if that 82.61 pivot is gained to the upside again and we see a pop to upside resistance points on chart.

If that does not transpire in trade then the 74.54 is the bottom, bottom support in 2018 most probably. I really doubt trade will see 74.54. But keep an open mind and follow price per the chart support and resistance points.

https://www.tradingview.com/chart/WMT/C6cyRnsL-Wallmart-stock-continiues-its-soft-landing-but-indicators-are-fl/

Wallmart, stock, chart
Wallmart stock continiues its soft landing but indicators are flatenning. Short side RR diminishing now.

$LTBR – Lightbridge Corp.

July 12 – LIGHTBRIDGE (LTBR) Continues range bound at main support area. Watching. $LTBR #Chart

See chart link below in previous post.

LTBR, stock, chart
LIGHTBRIDGE (LTBR) Continues range bound at main support area. Watching. $LTBR #Chart

May 29 – Literally watching for the 200 MA not far above to be gained and then watch this for a pop. It has the 50 MA now and I expect the bottom players to step in here soon.

$LTBR has the 50 MA with 200 MA not far overhead. On watch for 200 MA and then boom. #swingtrading

https://www.tradingview.com/chart/LTBR/rY7tCkdM-LTBR-has-the-50-MA-with-200-MA-not-far-overhead-On-watch-for-2/

$LTBR, stock, chart, swing trading
$LTBR has the 50 MA with 200 MA not far overhead. On watch for 200 MA and then boom. #swingtrading

$RCL – Royal Caribbean

Buy sell triggers for $RCL swing trading are as follows:

98.91

115.00

131.09

147.04

163.28

July 12 – ROYAL CARIBBEAN (RCL) Range bound trade, waiting for a direction to swing trade. $RCL #stock #chart

RCL, chart, stock
ROYAL CARIBBEAN (RCL) Range bound trade, waiting for a direction to swing trade. $RCL #stock #chart

May 29 – $RCL short side risk reward diminishing now and July 23 downside target 98.88 less likely. Trading 105.78.

I’m watching this support test area close now, this should turn up for a swing trade soon. As always follow price.

https://www.tradingview.com/chart/RCL/3DPMJMZq-RCL-short-side-risk-reward-diminishing-now-and-July-23-downside/

Royal Caribbean Cruises (RCL) Down 5.5% Since Earnings Report: Can It Rebound? https://finance.yahoo.com/news/royal-caribbean-cruises-rcl-down-072207247.html?.tsrc=rss

$RCL, chart, stock
$RCL short side risk reward diminishing now and July 23 downside target 98.88 less likely. Trading 105.78.

April 16 – $RCL Indecisive at this point and trading just under primary pivot resistance on chart. On watch. Buy sell triggers marked with white arrows.

$RCL, on watch, chart
$RCL Indecisive at this point and trading just under primary pivot resistance on chart. On watch.

Mar 6 – $RCL trading above 200 MA with targets in play swingtrading in to July 18 2018. #swingtrading

If price holds 200 MA and breaches that diagonal Fibonacci trendline at next quad wall (dotted gray line) near range overhead then at minimum the first upside if not the full extension target upside is possible.

If price turns down at quad wall then it targets the lowest area target to bearish side.

https://www.tradingview.com/chart/RCL/HTlF4zpZ-RCL-trading-above-200-MA-with-targets-in-play-swingtrading-in-t/

$RCL, price, targets, swingtrading
$RCL trading above 200 MA with targets in play swingtrading in to July 18 2018. #swingtrading

$JKS – Jinko Solar

July 12 – JINKOSOLAR (JKS) Continues under pressure trading 14.20. Watching for a turn. $JKS #Stock #chart

$JKS, stock, chart
JINKOSOLAR (JKS) Continues under pressure trading 14.20. Watching for a turn. $JKS #Stock #chart

May 29 – $JKS with earnings in 8 days is having trouble breaking range. Above 50 MA possible #swingtrade

https://www.tradingview.com/chart/JKS/1klAZiHP-JKS-with-earnings-in-8-days-is-having-trouble-breaking-range-A/

April 16 – $JKS MACD on weekly may cross up here for long over 200 MA.

$JKS, MACD, Weekly, chart
$JKS MACD on weekly may cross up here for long over 200 MA.

$PCRX – PacIra Pharma

July 12 – PACIRA PHARMA (PCRX) Testing underside of 200 MA for a break up to 42s possible. #swingtrading

https://www.tradingview.com/chart/PCRX/qJ3s8WMI-PACIRA-PHARMA-PCRX-Testing-underside-of-200-MA-for-a-break-up/

PCRX, Chart
PACIRA PHARMA (PCRX) Testing underside of 200 MA for a break up to 42s possible. #swingtrading

May 25 – Trading 35.2 still under pressure and under 200 MA. On watch for over 200 MA for a swing.

April 16 – $PCRX under pressure. Over 200 MA long but on short side there isnt enough RR at this point.

$PCRX , chart
$PCRX under pressure. Over 200 MA long but on short side there isnt enough RR at this point.

$EWZ – I Shares Brazil ETF

July 12 – ISHARES BRAZIL ETF (EWZ) Trading 33.39 looking for confirmation bounce for run to 38.53. $EWZ #swing #trading #plan

The two downside price targets on the down trend swing trading scenario have been hit, so I’m thinking we may see a turn here soon. On watch really close. 

Finding Opportunity in the Global Market Selloff $EWZ $EQJ $RSX $EZA $EWW https://www.barrons.com/articles/japan-stands-out-as-global-markets-falter-not-all-em-headed-for-slower-growth-1531332082

https://www.tradingview.com/chart/EWZ/Q4ddbonD-ISHARES-BRAZIL-ETF-EWZ-Trading-33-39-looking-for-confirmation/

$EWZ, swing, trading, plan
ISHARES BRAZIL ETF (EWZ) Trading 33.39 looking for confirmation bounce for run to 38.53. $EWZ #swing #trading #plan

May 29 – $EWZ continued pressure likely until near quad wall diagonal Fib trend line for a bounce. On watch.

https://www.tradingview.com/chart/EWZ/fF13o1E4-EWZ-continued-pressure-likely-until-near-quad-wall-diagonal-Fib/

$EWZ, stock, chart
$EWZ continued pressure likely until near quad wall diagonal Fib trendline afor a bounce. On watch.

$FEYE – Fire Eye Inc.

July 12 – FIREEYE (FEYE) in to price target, other side of time cycle, 17.10 intra 17.64 targets 19.43 19.68 22.35 #swingtrade $FEYE

https://www.tradingview.com/chart/FEYE/LLOPpNv1-FIREEYE-FEYE-in-to-price-target-other-side-of-time-cycle-17/

FireEye Stock Upgraded: What You Need to Know https://finance.yahoo.com/news/fireeye-stock-upgraded-know-153334694.html?soc_src=social-sh&soc_trk=tw via @YahooFinance

$FEYE, Swing, trading, chart
FIREEYE (FEYE) in to price target, other side of time cycle, 17.64 targets 19.43 19.68 22.35 #swingtrade $FEYE

May 29 – $FEYE near 50 MA support now. On watch for an upside swing trade if it bounces. #swingtrading

It is also very near key support. This is a significant watch area now for a trade.

https://www.tradingview.com/chart/FEYE/yhTSHMpW-FEYE-near-50-MA-support-now-On-watch-for-an-upside-swing-trade/

$FEYE, swing, trade, on, watch, chart
$FEYE near 50 MA support now. On watch for an upside swing trade if it bounces. #swingtrading

April 16 – $FEYE trade went as prescribed in last report – bias long to upside price target 22.32 June 27.Over 19.70 long to 22.32 price target.

https://www.tradingview.com/chart/FEYE/h7YNy5mP-FEYE-trade-went-as-prescribed-in-last-report-bias-long-to-ups/

$FEYE, long, swing, trade
$FEYE trade went as prescribed in last report – bias long to upside price target 22.32 June 27.

$LAC – Lithium Americas Corp

May 30 – Sitting on mid quad support – big test here. Above is long to target and below short. $LAC #swingtrading #chart

https://www.tradingview.com/chart/LAC/EN3DAMuT-Sitting-on-mid-quad-support-big-test-here-Above-is-long-to-ta/

Lithium Americas Corp (TSE:LAC): What Are The Future Prospects?

https://finance.yahoo.com/news/lithium-americas-corp-tse-lac-121406216.html?.tsrc=rss

$LAC, chart, swingtrading
Sitting on mid quad support – big test here. Above is long to target and below short. $LAC #swingtrading #chart

Per recent’

April 22 – $LAC trading 5.59 bounced at quad wall support (blue diagonal line marked with green arrow- important) targets 7.81 Jan 30 2019. If it gets bullish I will chart shorter time frames.

I like the structure of this chart. Will be watching very close.

Also, note 200 MA overhead.

https://www.tradingview.com/chart/LAC/wMJ5KGxr-LAC-trading-5-59-boubced-at-quad-wall-support-blue-diagonal-t/

$LAC, trading , model, chart
$LAC trading 5.59 bounced at quad wall support (blue diagonal) targets 7.81 Jan 30 2019. If it gets bullish I will chart shorter time frames.

Mar 10 – $LAC trading 6.35, over 6.52 targets 7.21 and 7.77, under targets 5.40 #pricetargets

https://www.tradingview.com/chart/LAC/rdA5gjLW-LAC-trading-6-35-over-6-52-targets-7-21-and-7-77-under-target/

$LAC, price, targets, chart
$LAC trading 6.35, over 6.52 targets 7.21 and 7.77, under targets 5.40 #pricetargets

$IBB – BioTechnology Index Fund

May 30 – $IBB chart on daily above mid quad support and 200 ma targeting upside 112.81 next FIB resistance.

This is a decent set up with a decent risk reward and a decent structured chart. It’s not a great set-up, but decent.

Biotech ETFs Are the Best Way to Play the Recovering Sector https://finance.yahoo.com/news/biotech-etfs-best-way-play-154314422.html?soc_src=social-sh&soc_trk=tw via @YahooFinance

https://www.tradingview.com/chart/IBB/d4oKOhYz-IBB-chart-on-daily-above-mid-quad-support-and-200-ma-targeting/

$IBB, chart
$IBB chart on daily above mid quad support and 200 ma targeting upside 112.81 next resistane.

Per recent;

April 22 – $IBB daily chart with targets above pivot decision at 102.46 and below. #swingtrading

Above 102.46 tested targets 122.34 or 142.11 pending trade.

Under 102.46 targets 92.81 or 63.04 pending trade.

Time cycle peak completion Nov 27 2018.

As price proves above or under the main pivot I will alert the trade and chart the shorter time frames.

https://www.tradingview.com/chart/IBB/64tumb7f-IBB-chart-with-targets-above-pivot-decision-at-102-46-and-below/

$IBB, chart, pivot, price targets
$IBB chart with targets above pivot decision at 102.46 and below. #swingtrading

Mar 10 – $IBB trading 114.36 triggered long at and if holds 113.78 for 118.88 and 124.70.

https://www.tradingview.com/chart/IBB/WRc726Nu-IBB-trading-114-36-triggered-long-at-and-if-holds-113-78-for-11/

$IBB, charting
$IBB trading 114.36 triggered long at and if holds 113.78 for 118.88 and 124.70.

$AGN – Allergan

May 30 – Really excited for the huge $AGN time cycle conclusion on or about June 4, 2018. Career trade setting up imo. #swingtrading #swingtrading #setups https://www.tradingview.com/chart/AGN/iAaFQ6U5-Really-excited-for-the-huge-AGN-time-cycle-conclusion-on-or-abo/

Really excited for the huge $AGN time cycle conclusion on or about June 4, 2018. #swingtrading #setups

$AGN Allergan to sell women’s health, infectious disease units https://finance.yahoo.com/m/919ae015-3199-352f-820a-3beef365d573/allergan-to-sell-women%26%2339%3Bs.html?soc_src=social-sh&soc_trk=tw via @YahooFinance

If $AGN holds 147.00 as trade gets on other side of time cycle it should target upper price targets on this model. #swingtrading

https://www.tradingview.com/chart/AGN/VfDFT8pE-If-AGN-holds-147-00-as-trade-gets-on-other-side-of-time-cycle-i/

$AGN, Swingtrading, chart, model
If $AGN holds 147.00 as trade gets on other side of time cycle it should target upper price targets on this model. #swingtrading

Per recent;

April 22 – $AGN I know it’s psychedelic but I think the time cycle is over soon and it reverses. #swingtrading

June 4 165.48 is the first upside target if there is a reversal here. On watch. If we get a reversal near term I will model and alert it for a swing trade.

https://www.tradingview.com/chart/AGN/7qp2fwSt-AGN-I-know-it-s-psychedelic-but-I-think-time-cycle-over-soon/

$AGN, swing, trading, Fibonacci, weekly, chart
$AGN I know it’s psychedelic but I think the time cycle is over soon and it reverses. Targets in report. #swingtrading

Mar 10 – Trading 157.28 so the previous post downside worked, however, indicators are now indecisive. Watching.

Jan 30 – $AGN Weekly chart suggests more near term down before things get better.

$AGN, weekly, chart
$AGN Weekly chart suggests more near term down before things get better.

Dec 18 – $AGN Trading 171.80 premarket indecisive with MACD up Stoch RSI high under MA’s.

Likely a decent bottom side trade with decent risk reward if you want to manage it through the moving averages.

$AGN, Chart, Swing Trading
$AGN Trading 171.80 premarket indecisive with MACD up Stoch RSI high under MA’s.

$CTSH – Cognizant Technology

May 30 – $CTSH Bottom line is that I won’t trade it until it dumps the 200 MA again for a bounce on weekly chart. #swingtrading

Cognizant Interactive Among Top of Ad Age’s Agency Report 2018 Rankings https://finance.yahoo.com/news/cognizant-interactive-among-top-ad-100000992.html?.tsrc=rss

$CTSH, chart
$CTSH Bottom line is that I won’t trade it until it dumps the 200 MA again for a bounce on weekly chart. #swingtrading

April 22 – $CTSH Trading 81.71. Earnings in 14 days and very extended over moving averages on weekly. Watching.

$CTSH, weekly, chart
$CTSH Earnings in 14 days and very extended over moving averages on weekly. Watching.

$CTSH – Trading 84.71 still vertical move intact. Enter long, set stop, close eyes and hope or wait for pull back at MA’s for a bounce to long.

$CTSH, breakout, chart
$CTSH Trading 84.71 still vertical move intact. Enter long, set stop, close eyes and hope or wait for pull back at MAs for a bounce to long.

$NVO – Novo – Nordisk

May 30 – Best I can do for now with $NVO is watch for chart structure to form on monthly. Not there yet. Price on daily is way below 200 MA and MACD is turned down.

Novo Nordisk’s Oral Ozempic Positive in Diabetes Study https://finance.yahoo.com/news/novo-nordisk-apos-oral-ozempic-122812593.html?.tsrc=rss

$NVO, chart
Best I can do for now with $NVO is watch for stucture to form on monthly. Not there yet.

April 22 – $NVO trading 47.23 below 200 MA on the weekly. Watching for further downside short.

$NVO, weekly, chart
$NVO trading 47.23 below 200 MA on the weekly. Watching for further downside short.

April 22 – $NVO trading 47.23 looks like a short side trade on monthly to at least 44’s in to 20 MA if not further.

$NVO, short, setup, monthly, chart
$NVO trading 47.23 looks like a short side trade on monthly to at least 44’s in to 20 MA if not further.

$TSLA – Tesla

May 30 – The technical chart for Tesla (TSLA) is the same set-up as previously posted below.

April 23 – $TSLA trading 290.34. Over 280.00 is long and under 280.00 is a short. We have had some great trading in this one with recent wash-out.

$TSLA, chart, setup
$TSLA trading 290.34. Over 280.00 is long and under 280.00 is a short.

278.00 needed as long side limited entry trigger. Less is short side. Simple on the fly daytrading model. $TSLA https://www.tradingview.com/chart/TSLA/2XQqKq0c-278-00-needed-as-long-side-limited-entry-trigger-Less-is-short/ …

https://twitter.com/SwingAlerts_CT/status/978995397594177537

$TSLA long confirming here over 280.55 with 304.17 next resistance 382 Nov 15 price target. https://www.tradingview.com/chart/TSLA/dn8THUSe-TSLA-long-confirming-here-over-280-55-with-304-17-next-resistan/ …

https://twitter.com/SwingAlerts_CT/status/981610107770429443

$TSLA long confirming here over 280.55 with 304.17 next resistance 382 Nov 15 price target..png

$TSLA, Swing trade, alerted, trade
$TSLA long confirming here over 280.55 with 304.17 next resistance 382 Nov 15 price target..png

$TSLA also blasting here from yesterday’s alert trade hit intra resistance at 299.84 area. Strong set-up.

https://twitter.com/SwingAlerts_CT/status/981915345802973184

$TSLA also blasting here from yesterday’s alert trade hit res at 299.84 area. Strong set-up..png

$TSLA, long, swing, trade
$TSLA also blasting here from yesterday’s alert trade hit res at 299.84 area. Strong set-up..png

Mar 10 – $TSLA monthly chart – trade range in triangle model and follow price to up or down target. #swingtrading

https://www.tradingview.com/chart/TSLA/GnP657AU-TSLA-monthly-chart-trade-range-in-triangle-model-and-follow-p/

$TSLA, monthly, chart
$TSLA monthly chart – trade range in triangle model and follow price to up or down target. #swingtrading

$SNAP – SNAP (60 Min Chart vs. Daily because it is a new issue)

May 30 – The SNAP chart is a disaster but it does look like a near term bottom area. Lots of caution of course.

https://www.tradingview.com/chart/SNAP/CUXpnBSd-The-SNAP-chart-is-a-disaster-but-it-does-look-like-a-near-term-b/

SNAP, Chart
The SNAP chart is a disaster but it does look like a near term bottom area. Lots of caution of course.

April 23 – $SNAP Just regained 200 MA. Trading 15.20. Over 15.18 targets 15.86, 15.99 then 17.00. Under targets 14.65. #swingtrading

$SNAP, swing, trading, chart
$SNAP Trading 15.20. Over 15.18 targets 15.86, 15.99 then 17.00. Under targets 14.65. #swingtrading

$VGZ – Vista Gold

May 30 – Nothing yet. Trading .704

April 23 – Trading .78. $VGZ holding the 200 MA on weekly and testing 50 MA resistance. Long side advantage, but not great yet.

$VGZ, swing, trading, chart, 200 MA, weekly
$VGZ holding the 200 MA on weekly and testing 50 MA resistance. Long side advantage, but not great yet.

Mar 10 – Trading .76 under 20, 50, 200 MA’s with MACD trending down on daily – watching.

Jan 30 – $VGZ chart structure is slowly building – on watch now – waiting for structure to form and then I will model it.

$VGZ, Weekly, chart
$VGZ chart structure is slowly building – on watch now – waiting for structure to form and then I will model it.

NA

Sept 14 – Trading .78 with indicators trending down.

Aug 14 – Trading .79 with indicators post earnings slightly looking positive and price under all MA’s. Watching.

$AAU Almaden Minerals

May 30 – Trading .71 with terrible indicators.

April 23 – $AAU trading .849 with indicators indecisive.

Mar 10 – Trading .85 under all MA’s on daily. Watching.

Jan 30 – $AAU trading .87 is still on a sell signal on weekly chart.

$AAU, weekly, chart
$AAU trading .87 is still on a sell signal on weekly chart.

$AMMJ – American Cannabis

May 30 – Trading .976 with flat indicators.

April 23 – $AMMJ trading 1.03 with buy sell triggers (white arrows), targeting Apr 26 .9911 May 24 1,21 (path of least resistance).

https://www.tradingview.com/chart/AMMJ/Z0YOWhTW-AMMJ-trading-1-03-with-buy-sell-triggers-white-arrows-target/

$AMMJ, swing, trading, price targets
$AMMJ trading 1.03 with buy sell triggers (white arrows), targeting Apr 26 .9911 May 24 1,21

Mar 10 – trading .90 with sideways action on chart. Watching.

Jan 30 – $AMMJ Ammerican Cannabis buy sell triggers at white arrows for your swing trade. Triggers and targets have been spot on. #swingtrading #cannabis https://www.tradingview.com/chart/AMMJ/T7F2Rgmg-AMMJ-Ammerican-Cannabis-buy-sell-triggers-at-white-arrows-for-y/

$AMMJ, swing, trading, chart, model
$AMMJ Ammerican Cannabis buy sell triggers at white arrows for your swing trade. Triggers and targets have been spot on. #swingtrading

Email or DM me on Twitter anytime with thoughts or questions!

Cheers!

Curtis

Subscribe to Swing Trading Service:

Swing Trading Bundle (Swing Trading Newsletter and Live Swing Trading Alerts).

Swing Trading Newsletter (Weekly Newsletter Published for Traders).

Real-Time Swing Trading Alerts (Private Member only Twitter Feed).

One-on-One Trade Coaching (Via Skype or In-Person).

Free Mailing List(s):

Join Email List for Free Trade Charting Trade Set-ups, Deals, Podcasts and Public Webinars.

Free Swing Trading Periodical Contact Form (Complimentary Swing Trade Set-Ups to Email)

Public Chat:

Visit our Free Public Chat Room on Discord.

Tweets by swingtrading_ct

Article Topics; Compound Trading, Swing, Trading, Stock, Picks, $AAPL, $AMD, $WMT, $LTBR, $RCL, $JKS, $PCRX, $EWZ, $FEYE

Read More

Posts navigation

Older posts
Newer posts
Proudly powered by WordPress | Theme: sharksdesign by reviewexchanger.
 

Loading Comments...