Skip to content

Compound Trading Group

  • About
  • White Paper
  • Returns
  • News
    • NOTICE of Online Information Meetings
  • Order
    • Terms
  • About
  • White Paper
  • Returns
  • News
    • NOTICE of Online Information Meetings
  • Order
    • Terms

Tag Archives: Chart

  1.   »  
  2. Tag Archives: Chart

Tag: Chart

Feature Post: 12 of Last 13 Oil Chart Time-Cycles Have Trend Reversal. $USOIL $WTI $CL_F $USO $UCO $UWT $DWT #OIL #OOTT

Feature Post: 12 of Last 13 Oil Chart Time-Cycles Have Trend Reversal. $USOIL $WTI $CL_F $USO $UCO $UWT $DWT #OIL #OOTT

May 20, 2018January 13, 2019 Curt MelonopolyCrude Oil Trading Strategy, Swing Newsletters$CL_F, $UCO, $USO, $USOIL, $UWT, $WTI, Chart, DWT, Oil, OOTT, symmetry, timecycles, Trade, trend reversal, weekly

Going Back to 2002, Twelve of last Thirteen Major Time Cycle completions on Weekly Oil Chart (a significant structure) have a Trend Reversal to one extent or another. 

This structural set-up should not be ignored by oil traders as the weekly chart is a significant structural consideration for long / short bias in trade planning and positioning.

Consideration toward indicators or chart set-ups / patterns in your oil trade planning is good (technical), as is fundamental research.

However, relying on limited individual charting indicators or set-up patterns (such as moving averages, MACD, head and shoulder pattern, etc) to form a bias can be problematic as it doesn’t provide a complete “structural” perspective to effectively form trade bias / positioning.

In our work, we rely heavily on chart structure on various time frames (1 min, 3, 5, 15, 30, 1 hour, 2, 4, Daily, Weekly and Monthly).

Above all else, the structure of the trading instrument (in our work and trade) is trump consideration. We know that all financial instruments have a structure and it is this structure that allows our trade positioning and our machine coding to operate at a significant advantage to the broad market.

If you wish to confirm our call record, contact me anytime for a personal tour of time stamped alert feeds, private user feeds and more.

January 2019 Update:

It happened again… today I posted an updated chart that brings the count to 13 out of last 14 time cycles, see below.

Dating back to 2002, 13 of 14 major time cycles on weekly crude oil chart structure seen trend reversal to some extent or another #Oil #OOTT #TimeCycles FX USOIL WTI $CL_F $USO $UWT $DWT

https://www.tradingview.com/chart/USOIL/F8Z9UE66-Dating-back-to-2002-13-of-14-major-time-cycles-on-weekly-crude/ …

The Technical Significance of the Weekly Oil Chart and Structure Presented:

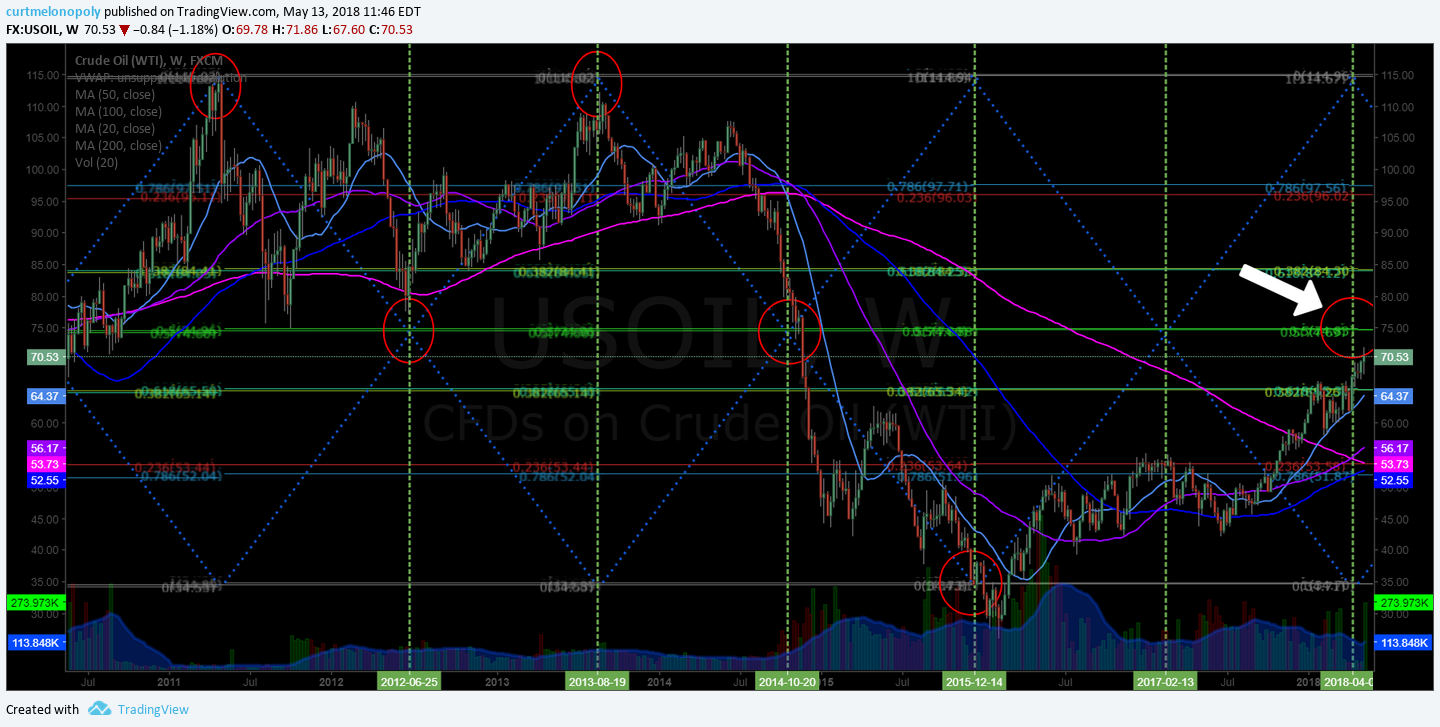
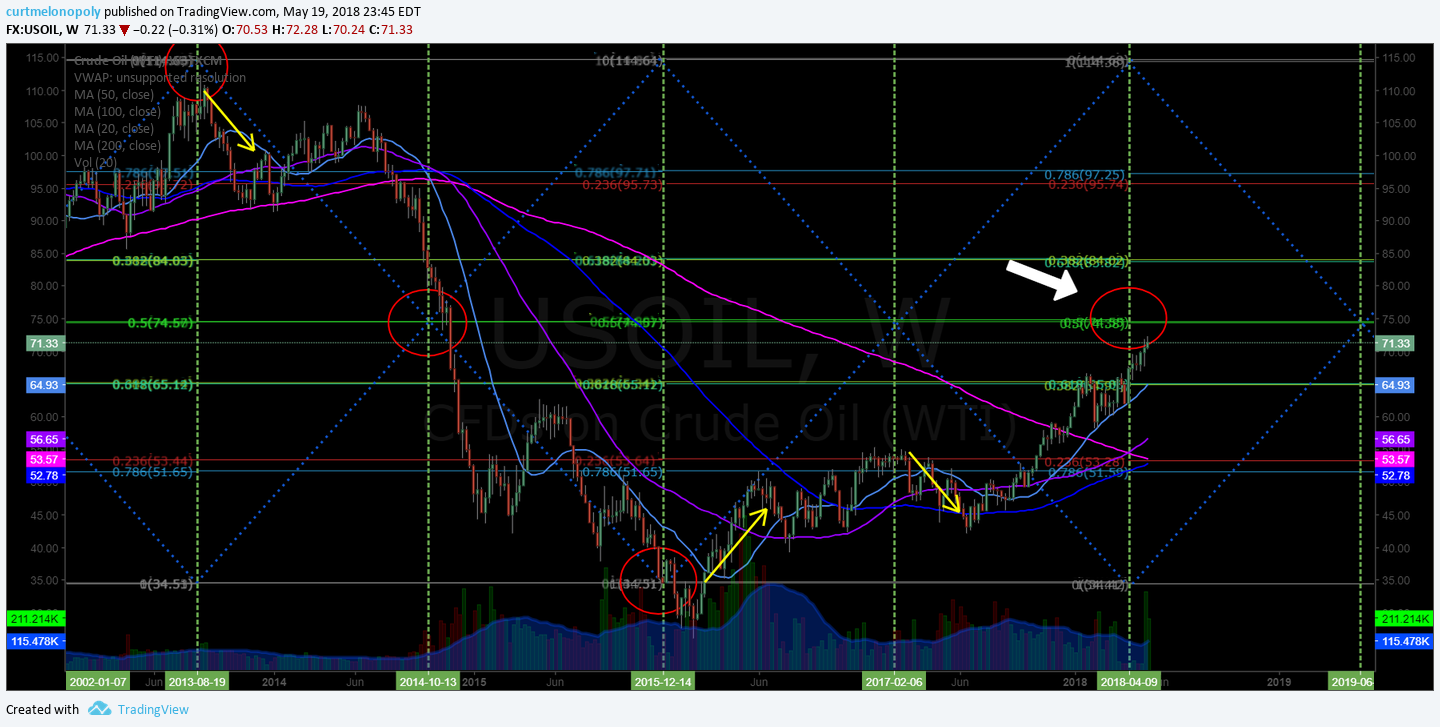
Specific to the point of this post, below is the oil chart I published to Trading View that shows the time cycle peak areas of oil on the weekly chart. The weekly oil chart is a significant structure because it is one of the broadest time frames the market uses to chart the trade of oil.

Dating back to 2002, 12 of 13 major time cycles on weekly oil chart have seen trend reversal to some extent or another #OILChart

Real-time oil chart link: 

https://www.tradingview.com/chart/USOIL/SvCYkyzH-12-of-last-13-time-cycles-in-Oil-trade-had-trend-reversal-OIL/

Oil chart, time cycles
Dating back to 2002, 12 of 13 major time cycles on weekly oil chart have seen trend reversal to some extent or another #OILChart


12 of last 13 time cycles in Oil trade had trend reversal. #OIL by curtmelonopoly on TradingView.com

How to Read this Oil Chart:

  • The vertical green lines show the date(s) of the peak time cycle area. You will notice that oil trade has reversed trend 12 of the last 13 time cycle peak areas. In some instances immediately and in some instances a few weeks later. You will also notice that the trend reversal is at times considerable and at other times not so much. The only time cycle peak that did not see a trend reversal was during the price plunge in October of 2014.
  • The yellow arrows on the oil chart denote area of trend reversal (in some instances a simple retrace and in others the reversal in oil trade is much more significant).
  • The diagonal blue lines are simple Fibonacci related trendlines that form what we call Trading Quadrants (the term comes from the lab work we do in preparation for machine coding of our algorithm models).
  • The horizontal lines are Fibonacci related support and resistance (retracement) lines. Our Fibonacci work is formed specific to chart structure and not conventional Fibonacci retracement work you may usually see from market chartists.
  • The red circles are targeted areas of precise trade that we note for our reference and purpose as it relates to our work. Not a significant indication on this chart for the point of this post.
  • The moving averages 20 MA, 50, 100, 200 are also on the chart and also not significant to the point of this post.

Below are Oil Chart Snap Shots From 2002 to Present (Note the Symmetry):

Symmetry and patterns in trade are important, especially if symmetry can be established within time cycles with some regularity. The chart images for oil trade from 2002 to 2018 (present) display the importance of this type of work.

Oil Charting Jan 2002 to Jan 2009 shows a consistent pattern / symmetry of oil trade trend reversals at time cycle peaks. $USOIL $WTI $CL_F #OIL

OIL, chart, historical, time cycles, symmetry
Oil Charting Jan 2002 to Jan 2009 shows a consistent pattern of oil trade trend reversals at time cycle peaks. $USOIL $WTI $CL_F #OIL

Oil Charting Jan 2008 to December 2014 also shows the trend reversal pattern with one exception in Oct 2014. $USOIL $WTI $CL_F #OIL

Oil, charting, historical, symmetry, trend reversals
Oil Charting Jan 2008 to December 2014 also shows the trend reversal pattern with one exception in Oct 2014. $USOIL $WTI $CL_F #OIL

Oil Charting from Aug 2013 to present day in May 2018 also displays the trend reversals post time cycle peaks. $USOIL $WTI $CL_F #OIL

Oil, charting, symmetry, time cycles, trend reversals
Oil Charting from Aug 2013 to present day in May 2018 also displays the trend reversals post time cycle peaks. $USOIL $WTI $CL_F #OIL

Where are We Now?

Oil trade is now on the other side of an important time cycle completion / peak, as with the last thirteen time cycles highlighted in this post.

There is a very high probability of a reversal in trend, whether it be a simple retrace or a completely new trend develops.

How to Trade The Next Move in Oil:

For a detailed swing trading plan for the next move in oil register to our free mailing list and you will receive a copy. Unsubscribe anytime.

If you are already on our mailing list, you will automatically receive a copy of the oil trading report when released shortly.

Crude Oil Trading Academy : Learn to Trade Oil:

Learning to Trade Crude Oil Futures Contracts is Like No Other Trading – Having a Rules Based Process Will Help You.

Visit our complimentary study links here for real articles from our oil traders day to day experience in our oil trading room, click here – Crude Oil Trading Academy : Learn to Trade Oil.

Learning to Trade? Here are some links that reflect topics in this post:

Trend Reversal https://www.investopedia.com/terms/r/reversal.asp

Charting Time Cycles http://stockcharts.com/school/doku.php?id=chart_school:chart_analysis:cycle_lines

Fibonacci for Charting https://www.investopedia.com/terms/f/fibonacciretracement.asp

Symmetry in Mathematics https://en.wikipedia.org/wiki/Symmetry_in_mathematics

Subscribe:

Temporary Discount Offers:

30% Off Oil Newsletter: Use Promo Coupon Code “epic30” When Subscribing to our Weekly Oil Newsletter Here: https://compoundtrading.com/product/standalone-epic-newsletter/ (cancel anytime, for new members only to trial the service).

30% Off Oil Alerts: Use Promo Coupon Code “oilalerts30” for Real-Time Oil Trade Alerts via Private Twitter Feed @OilAlerts_CT Here: https://compoundtrading.com/product/live-oil-trading-alerts/?attribute_plan=One+Month (cancel anytime, for new members only to trial the service).

Click here to find all information and pricing on Oil Newsletter, Trading Chat Room, Oil Alerts and more.

Connect:

Register to free email list for trade set-ups, webinars, special events: https://compoundtrading.com/contact/

Website: https://compoundtrading.com

Blog: https://compoundtrading.com/blog/

Free chat room: https://discord.gg/2HRTk6n

Subscribe: https://compoundtrading.com/overview-…

Twitter: https://twitter.com/CompoundTrading

Lead Trader: https://twitter.com/curtmelonopoly

Tradingview: https://www.tradingview.com/u/curtmel…

Facebook: https://www.facebook.com/compoundtrad…

StockTwits: https://stocktwits.com/compoundtrading

Email: compoundtradingofficial@gmail.com

Curtis Melonopoly (@curtmelonopoly) is rated Top 250 Stock exchanges authority, covering also Mathematical finance and Economy of the United States

Compound Trading Platform: Algorithm model charting for $SPY, $VIX, #OIL, #GOLD, #SILVER, #Crypto ($BTC Bitcoin, $ETH, $LTC, $XRP,) $DXY US Dollar and Swing Trading Newsletter. Live trading rooms for daytrading and oil traders. Private coaching and live alerts.


Read More
How to Trade Pure Storage (PSTG) Earnings in Six Days (Member Edition) $PSTG #swingtrading #daytrading

How to Trade Pure Storage (PSTG) Earnings in Six Days (Member Edition) $PSTG #swingtrading #daytrading

May 16, 2018June 9, 2018 Swing TraderSwing Trading$PSTG, Chart, earnings, How To, Swing Trade

How to Trade Pure Storage (PSTG) Earnings in Six Days.

Pure Storage technical swing trade chart set-up with buy / sell triggers and price targets.

May 16, 2018

What’s New

  • Now available for serious traders, information here for our exclusive Legacy All Access Membership.
  • 24 Hour Crypto Trading Desk opens mid May 2018 along with our Coding Algorithm Models for Machine Trading. This team is also responsible for alerting trades on the live Twitter alert feeds for all models. Formal announcements to follow.

PSTG Earnings Date
Earnings announcement* for PSTG: May 21, 2018

https://www.nasdaq.com/earnings/report/pstg

Below is the link for the real-time Pure Storage chart with all buy sell triggers and price targets;

https://www.tradingview.com/chart/PSTG/GLswoEx0-How-to-Trade-Pure-Storage-Earnings-in-6-days-PSTG-swingtrading/

The Pure Storage Swing Trade Set-Up

PSTG closed 23.01 Tuesday with earnings in six days.

Important trade support is at 22.50 area (gray horizontal line) also marked with a white arrow.

White arrows are the most important buy sell triggers on the chart.

Above 22.50 (give it some room) it is a long to next resistance 24.00 area (horizontal lines on chart are resistance / support lines depending on what side of the line trade is on). Next on upside is 24.14 and then 25.12, then 25.44 and 25.91 area.

Under 22.50 area it targets support at 21.14 and then 21.00 then 20.03 and 19.71.

Price targets on model to bullish side are 25.91 and really bullish 29.19 Oct 1 2018. Trade toward target with price action using support and resistance points.

Downside scenario has 19.23 and 15.92 (most bearish) price targets Oct 1 2018.


How to Trade Pure Storage Earnings in 6 days $PSTG #swingtrading by curtmelonopoly on TradingView.com

$PSTG, pure storage, chart, earnings, trade
How to Trade Pure Storage Earnings in 6 days $PSTG #swingtrading

May 14 Article:

Pure Storage Clears Data Bottlenecks On Road To Artificial Intelligence https://www.investors.com/research/the-new-america/pure-storage-artificial-intelligence/?src=A00220&yptr=yahoo

In Closing:

A few hours of trade coaching or study on exactly how to trim in to resistance and how to add to your positions on winners and how to cut losses properly and quickly will return huge dividends.

You can subscribe to our Weekly Swing Trading Newsletter service here, use temporary Promo Code “30P” for 30% off Reg 119.00 Sale Price 83.30.

Or click here to subscribe and get 30% off Real-Time Swing Trading Alerts Reg 99.00 Sale Price 69.37 use temporary Promo Code “Deal30” for 30% off.

I personally guarantee our swing trading service is one of the best in the business and it’s very reasonably priced considering the technical expertise invested in the platform.

Any questions feel welcome to contact me anytime.

Good luck with your $PTSG Pure Storage earnings trade and if you need any help message me anytime!

Best,

Curt

If you are not already on our Free Swing Trading Periodical email list follow the link here to get on it to receive trading set-ups in the future. Unsubscribe anytime.

Connect:

Register to free email list for trade set-ups, webinars, special events: https://compoundtrading.com/contact/

Website: https://compoundtrading.com

Free chat room: https://discord.gg/2HRTk6n

Subscribe: https://compoundtrading.com/overview-…

Twitter: https://twitter.com/CompoundTrading

Lead Trader: https://twitter.com/curtmelonopoly

Tradingview: https://www.tradingview.com/u/curtmel…

Facebook: https://www.facebook.com/compoundtrad…

StockTwits: https://stocktwits.com/compoundtrading

Email: https://info@compoundtrading.com

Compound Trading Platform: Algorithm model charting for $SPY, $VIX, #OIL, #GOLD, #SILVER, #Crypto ($BTC Bitcoin, $ETH, $LTC, $XRP,) $DXY US Dollar and Swing Trading Newsletter. Live trading rooms for daytrading and oil traders. Private coaching and live alerts.


Read More
Trade Set-Ups (May 14 /15 Member Edition) $BOX, $ITCI, $SPY, $EEM, $PFE, $BTC, Bitcoin, SILVER, $SLV, $ETH, Ethereum, $EOG, $EDIT, $EXP more.

Trade Set-Ups (May 14 /15 Member Edition) $BOX, $ITCI, $SPY, $EEM, $PFE, $BTC, Bitcoin, SILVER, $SLV, $ETH, Ethereum, $EOG, $EDIT, $EXP more.

May 15, 2018June 9, 2018 Swing TraderSwing Trading$BTC, $EDIT, $EEM, $EOG, $ETH, $EX, $ITCI, $PFE, BITCOIN, BOX, Chart, Ethereum, Report, Setups., Silver, SLV, SPY, Swingtrading, Video

Swing Trading Report and Video for May 14 / 15, 2018.

In this Issue: $BOX, $ITCI, $SPY, $EEM, $PFE, $BTC, Bitcoin, SILVER, $SLV, $ETH, Ethereum, $EOG, $EDIT, $EXP more.

What’s New!

  • Interested in free swing trading setups? Click here to sign up for the Complimentary Swing Trading Report Mailing List.
  • Now available for serious traders – Legacy All Access Membership.
  • Price increase platform wide May 15, 2018. Detailed announcement to follow. Current members unaffected.
  • 24 Hour Crypto Trading Desk opens May 15, 2018 along with our Coding Algorithm Models for Machine Trading. Formal announcements to follow.

The Mid Day Trade Set-Ups Video:

Trade set-ups on this video; $BOX, $ITCI, $SPY, $EEM, $PFE, $BTC, Bitcoin, SILVER, $SLV, $ETH, Ethereum, $EOG, $EDIT, $EXP more.

Mid Day Chart Trading Set-ups May 14 Summary:

Trade set-ups May 14 Mid Day Trade Review;

$ITCI – called it on way down for a turn, it’s turned and it’s been a great trade, cleared 50 MA, swing trade and intra day resistance points. Swing 23.78 above is important resistance. 21.22 22.30 intra. 30.63 is a swing resistance to watch.

$SPY – through price target, in to resistance today, up and over adding. May 18 273.40 target moderate, 283.00 bullish target. 274.50 next resistance. 272.10 support intra.

Bitcoin $BTC – up against resistance (mid quad) very important area. 8870.00 area. Upside target 9880.0 and moderate 8871.00 bearish 7894.00 May 19 approx.

Silver $SLV – buy side alert issued 16.67 area, I’m off a bit but it’s a small starter.

$GOOGL – great trade with it bullish through targets ,trading very technical. 1127.81 resistance 1148.04 1158.09 1166.00 area. Support 1078.58 1103.20.

$EOG – at resistance, trim 119.61 next 128.15 and support 108.91.

$EDIT – 36.45 pivot triggered long over and then came off. Over 50 MA is bullish. Mid quad 37.70 mid qaud resistance. 47.49 is bullish target late Sept.

$HTZ – over 50 MA on hourly we sent alert to trim longs in to the 50 MA, wash-out snap back trade,

$GDX is playing out according to model.

$EEM up against 50 MA on daily, 100 MA above bothers me, MACD is turned up. Soft. Price above all MA’s with 50 breaching the 100 MA and I’d be interested in a play. Moving averages are the issue. MACD looks good.

$PFE 20 MA above on weekly chart not great, stochastic RSI coming down on monthly, MACD not the best, against historical resistance. Very soft.

$EXP 107.90 buy trigger waiting on earnings before execution.

$BOX hit mid quad resistance and came off, excellent symmetry in model, there is a set up post on blog for mailing list subscribers. 20.39 resistance 33.20 bullish target 23.74 bearish target – trade price toward target.

Ethereum $ETH $ETHUSD – up over MA’s, 739.11 resistance 739.55, and main resistance at 825.43 and 906.97 top of channel. Algorithmic model chart resistance at channel.

$BTC Bitcoin under mid channel line. 17690.00 July 4 price target is the most bullish scenario (unlikely of course, but in a bull run that would be the most bullish target for Bitcoin). Trading the channel.

In Closing:

I will re-iterate that a few hours of trade coaching or study on exactly how to trim in to resistance and how to add to your positions on winners and how to cut losses properly and quickly will return huge dividends.

You can subscribe to our Weekly Swing Trading Newsletter service here, use temporary Promo Code “30P” for 30% off Reg 119.00 Sale Price 83.30.

Or click here to subscribe and get 30% off Real-Time Swing Trading Alerts Reg 99.00 Sale Price 69.37 use temporary Promo Code “Deal30” for 30% off.

I personally guarantee our swing trading service is one of the best in the business and it’s very reasonably priced considering the technical expertise invested in the platform.

Any questions feel welcome to contact me anytime.

Peace and best,

Curt

Recent Trading Set-Up Review Webinars / Posts:

Password: WOW Protected: How to Trade Box Earnings Move (Swing Trade Member Exclusive)

Protected: Trade Set-Ups (May 8 Member Edition) $AAPL, $DIS, $AMD, $ITCI, $AAOI, $SNAP, $FB, $TSLA, $EDIT, $ESPR, $LITE, $LPSN, $SPY.

May 7 – Trade Set-Ups, Consolidated Review $SPY, $AAPL, $TSLA, $SNAP, OIL, $DXY, $VIX, GOLD, $DIS, Silver more.

Trading Set-ups $FB, $AMBA, $SDTY, $TSLA, $GDX, $SLV, $BTC, $JD, $VIX, $LITE, $CELG, $FSLR more.

Do Not Ignore This Trade Set-Up | $AMBA Swing Trade | 40% ROE 3 Mos (Part 1 of 2)

Password: ELON Protected: How to Trade the Tesla Move | Price Targets | Buy Sell Triggers | Time Cycles $TSLA #swingtrading #daytrading

Password: LONG Protected: Overnight Oil Trade | Trading Plan in Detail | EPIC Oil Algorithm $USOIL $WTI $CL_F #OIL $USO #Alerts

Trade Set-ups $SPY, $NFLX, OIL, $WTI, $ESPR, $GOOGL, Bitcoin, $BTC, $FEYE, $AAPL and more.

Trading Set-Ups $SPY, Gold, $GC_F, $GDX, Bitcoin, $GOOGL, $EVLV, $HEAR, $CHEK, $MARA, $PRTA, $ZDGE

Trading Set-Ups $NETE, $TSG, $ETH Ethereum, $BTC Bitcoin, $TAN, $HEAR, $AMMJ, $SNAP, $VLRX

Trade Set-Ups OIL, $WTI, $SPY, $GOOGL, $FSLR, $AXP, $GREK, $CELG, $AAOI, $SDRL, $WFT

Great Trading Last Few Wks – Lets Keep Going! $RIG, #OIL, $SPY, $ETH, $BTC, $FB, $GOOGL, $BWA, $GDX more.

Swing Trade Set-Ups Abound $SPY, $NFLX, $DIS, $EOG, $WTIC, $USOIL, $BTC, $FB, $MARA, $LITE, $IOTS and more.

Special Swing Trade Report: #OIL, #GOLD, $NFLX, $SPY, $DIS, $GDX, $TSLA, $AAOI, $ESPR, $ITCI, $TAN, $CELG, $C and more.

Register to free email list for trade set-ups, webinars, special events: https://compoundtrading.com/contact/

Website: https://compoundtrading.com

Free chat room: https://discord.gg/2HRTk6n

Subscribe: https://compoundtrading.com/overview-…

Twitter: https://twitter.com/CompoundTrading

Lead Trader: https://twitter.com/curtmelonopoly

Tradingview: https://www.tradingview.com/u/curtmel…

Facebook: https://www.facebook.com/compoundtrad…

StockTwits: https://stocktwits.com/compoundtrading

Email: https://info@compoundtrading.com

Compound Trading Platform: Algorithm model charting for $SPY, $VIX, #OIL, #GOLD, #SILVER, #Crypto ($BTC Bitcoin, $ETH, $LTC, $XRP,) $DXY US Dollar and Swing Trading Newsletter. Live trading rooms for daytrading and oil traders. Private coaching and live alerts.

Read More
SuperNova $SILVER Algo Chart Model Update Mon May 14 $SLV ($USLV, $DSLV)

SuperNova $SILVER Algo Chart Model Update Mon May 14 $SLV ($USLV, $DSLV)

May 14, 2018December 30, 2018 Supernova SilverSuperNova Silver Algo$DSLV, $USLV, Algorithm, Chart, Silver, SLV, SuperNova

Silver Trading Chart Update Monday May 14, 2018 $SLV ($USLV, $DSLV) Chart and Algorithm Observations

My name is SuperNova the Silver Algo. Welcome to my new Silver trade report. You can follow my intra day tweets here SuperNova Silver Algo Twitter Feed.

How My Algorithm Works and Availability:

I am an algorithm chart model in development.

Below you will find my simplified view of levels that can be used on a traditional chart to possibly advance a traders’ edge (both intra-day and as a swing trader). This work, and your subsequent trading, should be considered one decision at a time, “if this happens then this or this are my targets”… price – trigger – trade and so on (rooted in technical set-up).

My algorithmic charting will eventually transition to developer coding phase for our trader’s dashboard program. I am not an automated bot or high frequency type algorithm (HFT). Please review my algorithm development process.

Below you will find simple Generation I Level chart modeling with a goal toward generation 5 modeling as with EPIC the Oil Algorithm model (for example).

Silver Trading Observations

Targets charted in play in to next time cycle. SuperNova $SILVER Algorithm Chart Model $SLV, $USLV, $DSLV

https://www.tradingview.com/chart/SILVER/mjK7lGPH-Targets-charted-in-play-in-to-next-time-cycle-SuperNova-SILVER/

Silver, algorithm
Targets charted in play in to next time cycle. SuperNova $SILVER Algorithm Chart Model $SLV, $USLV, $DSLV

Key Silver Buy Sell Triggers (wide range swing trading):

18.51

17.74

16.96

16.17

15.40

Per recent;

Per last report 16.95 as May 7 most probable PT. SuperNova $SILVER Algo Chart Model $SLV, $USLV, $DSLV

https://www.tradingview.com/chart/SILVER/f4V72Z37-Per-last-report-16-95-as-May-7-most-probable-PT-SuperNova-SILV/

Silver, chart, daily
Per last report 16.95 as May 7 most probable PT. SuperNova $SILVER Algo Chart Model $SLV, $USLV, $DSLV

Per recent;

April 24 – Silver retrace was deeper than expected. Revised 16.95 as May 7 most probable PT. SuperNova $SILVER Algo Chart Model $SLV, $USLV, $DSLV

https://www.tradingview.com/chart/SILVER/JMMORR5d-Silver-retrace-was-deeper-than-expected-Revised-16-95-as-May-7/

Silver, price target, chart
Silver retrace was deeper than expected. Revised 16.95 as May 7 most probable PT. SuperNova $SILVER Algo Chart Model $SLV, $USLV, $DSLV

Per recent;

Silver on fire through chart model. Retrace to 16.96 Apr 24 and uptrend to 17.72 May 7 probable PT. SuperNova $SILVER Algo Chart Model $SLV, $USLV, $DSLV

https://www.tradingview.com/chart/SILVER/ZuT9lS35-Silver-on-fire-through-chart-model-Retrace-to-16-96-Apr-24-and/

Silver, algorithm, chart
Silver on fire through chart model. Retrace to 16.96 Apr 24 and uptrend to 17.72 May 7 probable PT. SuperNova $SILVER Algo Chart Model $SLV, $USLV, $DSLV

Silver 2 Hour Chart Model (daytrading)

Silver did not hit target this time – bought above. Bullish bias. SuperNova $SILVER Algorithm Chart Model $SLV, $USLV, $DSLV

https://www.tradingview.com/chart/SILVER/PbxezBFv-Silver-did-not-hit-target-this-time-bought-above-Bullish-bias/

Silver, chart, daytrading, algorithm
Silver did not hit target this time – bought above. Bullish bias. SuperNova $SILVER Algorithm Chart Model $SLV, $USLV, $DSLV

Per recent;

Silver daytrading model amazing – it keeps hitting mid quad target over and over again.

https://www.tradingview.com/chart/SILVER/jO7DpOGo-Silver-daytrading-model-amazing-it-keeps-hitting-mid-quad-targ/

Silver, daytrading, chart, model
https://www.tradingview.com/chart/SILVER/jO7DpOGo-Silver-daytrading-model-amazing-it-keeps-hitting-mid-quad-targ/

Per recent;

Silver confirming long side trade bias over 16.69 first target 16.78 then 16.95 on daytrading model. SILVER $SLV #trading

https://www.tradingview.com/chart/SILVER/cVp4ec08-Silver-confirming-long-side-trade-bias-over-16-69-first-target-1/

Silver, daytrading, chart, long, trade
Silver confirming long side trade bias over 16.69 first target 16.78 then 16.95 on daytrading model. SILVER $SLV #trading

Silver Conventional Charting

Doesn’t really matter how you draw the lines – there’s a decision coming on Silver Weekly Chart. #Silver $SLV $USLV $DSLV

Also, take note of 200 MA on weekly chart just above current trade.

https://www.tradingview.com/chart/SILVER/Q2Nj70JG-There-s-a-decision-coming-on-Silver-Chart-notes/

Silver. chart, weekly
Doesn’t really matter how you draw the lines – there’s a decision coming on Silver Weekly Chart. #Silver $SLV $USLV $DSLV

Per recent;

April 30 – SILVER conventional chart compression to end of triangle.

https://www.tradingview.com/chart/SILVER/oP1bN6XV-SILVER-conventional-chart-compression-to-end-of-triangle/

Silver, chart
SILVER conventional chart compression to end of triangle.

Per recent;

April 24 – Silver touch to 100 MA and came off. Intra getting a bounce here.

https://www.tradingview.com/chart/SILVER/HuuNsIPA-Silver-touch-to-100-MA-and-came-off-Intra-getting-a-bounce-here/

Silver, 100MA, resistance, chart
Silver touch to 100 MA and came off. Intra getting a bounce here.


Recent Algorithm Price Target Hits

May 14 – I will update target hits soon.

April 19 – Since the posts below the models have been hitting targets regularly. Looks like we have the models dialed in.

Silver Mar 2 300 PM target hit – not perfect but a hit. Provided on weekend prior report. SuperNova $SILVER Algo Chart Model $SLV, $USLV, $DSLV

Silver, price, targets, Algorithm
Silver Mar 2 300 PM target hit – not perfect but a hit. Provided on weekend prior report. SuperNova $SILVER Algo Chart Model $SLV, $USLV, $DSLV

Silver Mar 9 300 AM target hit – not perfect but it hit. Provided on weekend prior report. SuperNova $SILVER Algo Chart Model $SLV, $USLV, $DSLV

Silver, algo, chart, targets
Silver Mar 9 300 AM target hit – not perfect but it hit. Provided on weekend prior report. SuperNova $SILVER Algo Chart Model $SLV, $USLV, $DSLV

Good luck with your trades and look forward to seeing you in the room!

SuperNova Silver Algo 

Tweets by SuperNovaAlgo

Article Topics: SuperNova, Silver, Chart, Algorithm, $SILVER, $SLV, $USLV, $DSLV

Read More
Rosie Gold Algorithm Chart Model Mon May 14 $GC_F $XAUUSD $GLD $UGLD $DGLD $GDX $NUGT $DUST

Rosie Gold Algorithm Chart Model Mon May 14 $GC_F $XAUUSD $GLD $UGLD $DGLD $GDX $NUGT $DUST

May 14, 2018December 30, 2018 RosietheAlgo GLDRosie the Gold Algo Chart Report$DGLD, $DUST, $GDX, $JDST, $JNUG, $NUGT, $UGLD, $XAUUSD, Algorithm, Chart, GLD, Gold, Miners, Rosie, Trading

Rosie the Gold Algorithm Model Charting Update Monday May 14, 2018 #GOLD $GC_F $XAUUSD $GLD, $UGLD, $DGLD with Gold Miner Observations: $GDX, $GDXJ ($NUGT, $DUST, $JDST, $JNUG)

Good day! My name is Rosie the Gold Algo. Welcome to my new member edition Gold trade report for Compound Trading.

Like EPIC our Oil Algorithm chart model, I am an algorithm chart model in development and trader testing for coding phase to be used as an intelligent assistant for our traders (not HFT). My charting model is specifically suitable for the use and purpose of Gold and Gold Miner related.

The charting models are best used decision to decision. In other words, each line on the algorithmic model charts are support and resistance. As trade progresses, weighing algorithmic charting model against conventional charting observations provides an edge over using only conventional charts.

If you need assistance at anytime contact my developers at info@compoundtrading.com.

Updates:

The charting below for Gold now has prospective channel support and resistance, considerable wider time frame quad walls highlighted (thicker orange dotted lines) and key channel direction decision areas noted with purple arrows.

How to Use the Charting Model:

How to Use ROSIE Gold Algorithm: #GOLD, $GLD, $XAUUSD, $GDX, $GDXJ, $NUGT, $DUST, $JNUG, $JDST

Gold / Gold Miner Trade Coaching

Users of this algorithm model charting may opt for private one-on-one coaching with our lead trader and / or an experienced trader that has worked under our lead trader.

On our website there are standard one-on-one online coaching packages you can order (coaching via Skype) or you can request a customized package (reflecting the time you are wanting to invest in your learning). 

To request a custom package most suited to your needs email us at info@compoundtrading.com or click here for a standard private trade coaching package. Other options for coaching include online webinars for members (from time to time), private on location and in-person coaching sessions at our new trading location(s) and organized trading conference events. 

Primary Trade Indications:

Live Twitter Alert Feed for Gold / Miner Trades: @GoldAlerts_CT

Gold Trade Buy / Sell Short Term Swing Triggers

For short term trading the following are support and resistance areas for trade that can be used as buy / sell triggers for Gold.

1300.96

1311.07

1321.30

1331.51

1341.61

1351.86

1362.03

1372.72

1383.43

1384.79

The primary method of trade our traders are reporting works with the most predictability is to wait for Gold to breach the trading range (grey lines marked with arrows) up or down and then have it confirm as it leaves the corresponding trading quadrant to the up or downside. See video above.

As it is a model in development, if you find more predictable methods please report same.

Resistance and Support Clusters: Blue and Yellow horizontal (may be sloped) lines (marked with arrows). The thicker they are the more significant they are. Blue are conventional indicators and Yellow are calculated historical algorithmic points of significance. If the cluster is significant our charting techs will shade the area in white to bring this to your attention. The most recent cluster has proven to be significant resistance in recent trade.

Trading Range: Grey Lines (marked with grey arrows). Trade above or below creates bias and bias is confirmed to a high probability when trade then leaves a quadrant (geometric diamond shape formed with diagonal Fib trend lines for time – frame) after gaining or losing a trading range horizontal support / resistance line (grey horizontal line).

Quadrants: Diagonal Orange Lines that form diamond shapes. Based on diagonal Fibonacci trend lines act as important support and resistance. The wider the time frame the thicker the line.

Channel Decisions: Purple arrows note critical uptrend and downtrend channel decisions.

Fibonacci Support and Resistance: Horizontal lines on charting (various colors).

Targets: Red circles on charting. The least of the indicators and should be used for observation purpose only. The targets are in very early stage development / testing. Two are provided for each quadrant time frame – the upper scenario targets should be considered if trend is up and likewise for the lower. Only either are expected to hit (if at all – very low probability of a hit is expected at this point).

Conventional Charting: All decisions should be weighed against conventional charting (as may be provided below also).

Gold Algorithm Live Charting Link: 

Click on share button bottom right (beside flag) and then click on “Make it Mine”.

Gold Live Chart Link May 14, 2018:

https://www.tradingview.com/chart/GOLD/sbNBGHIg-Gold-current-trade-Rosie-Gold-Algorithm-May-13-246-AM-Gold-G/

Gold current trade. Rosie Gold Algorithm. May 13 246 AM #Gold $GLD $GC_F $XAUUSD $NUGT $DUST

Gold, current, trade, chart
Gold current trade. Rosie Gold Algorithm. May 13 246 AM #Gold $GLD $GC_F $XAUUSD $NUGT $DUST

Gold down channel scenario. Rosie Gold Algorithm. May 13 245 AM #Gold $GLD $GC_F $XAUUSD $NUGT $DUST

Gold, downtrend, chart
Gold doown channel scenario. Rosie Gold Algorithm. May 13 245 AM #Gold $GLD $GC_F $XAUUSD $NUGT $DUST

Gold up channel scenario. Rosie Gold Algorithm. May 13 244 AM #Gold $GLD $GC_F $XAUUSD $NUGT $DUST

Gold, up, channel, chart
Gold up channel scenario. Rosie Gold Algorithm. May 13 244 AM #Gold $GLD $GC_F $XAUUSD $NUGT $DUST

Conventional Charting Considerations:

Massive time cycle comes due late July on Gold Daily. Structure in place still. May 14 218 AM #Gold $GLD $GC_F $XAUUSD $NUGT $DUST

https://www.tradingview.com/chart/GOLD/bzK0cwH7-Massive-time-cycle-comes-due-late-July-on-Gold-Daily-Notes/

Gold, time cycle, chart
Massive time cycle comes due late July on Gold Daily. Structure in place still. May 14 218 AM #Gold $GLD $GC_F $XAUUSD $NUGT $DUST

Per previous;

Gold daily chart simple model still has structure, but it’s close to a fall out.

https://www.tradingview.com/chart/GOLD/K1clwQ6o-Gold-daily-chart-simple-model-still-has-structure-but-it-s-clos/

Gold, daily, chart, structure
Gold daily chart simple model still has structure, but it’s close to a fall out.

Per recent;

April 24 – Gold 0.33% lost 50 MA but bullish structure still in play. #Gold #XAUUSD $GC_F $GLD

https://www.tradingview.com/chart/GOLD/8tCBgGWn-Gold-lost-50-MA-but-bullish-structure-in-play-Gold-Notes/

Gold, chart, bullish
Gold lost 50 MA but bullish structure still in play. #Gold #XAUUSD $GC_F $GLD


Gold Miner $GDX:

$GDX structure still in play. Very predictable trade over and over. $NUGT $DUST $JDST $JNUG

https://www.tradingview.com/chart/GDX/izAOofSK-GDX-structure-still-in-play-Very-predictable-trade-over-and-ov/

$GDX, chart
$GDX structure still in play. Very predictable trade over and over. $NUGT $DUST $JDST $JNUG

Per recent;

April 30 – $GDX No change. Support at Fib TL quad wall held and trending in to resistance.

https://www.tradingview.com/chart/GDX/oySDQVAb-GDX-No-change-Support-at-Fib-TL-quad-wall-held-and-trending-in/

$GDX, chart
$GDX No change. Support at Fib TL quad wall held and trending in to resistance.

Per recent;

April 24 – $GDX came off at mid quad resistance as thought. Add long or enter long at quad TL line support if it holds.

https://www.tradingview.com/chart/GDX/VcYeYEEm-GDX-came-off-at-mid-quad-resistance-as-thought-Add-long-or-ent/

$GDX, chart, resistance, support
$GDX came off at mid quad resistance as thought. Add long or enter long at quad TL line support if it holds.

Per recent;

$GDX Gold miner trading near mid quad resistance test and perfectly on way to price target. $NUGT $DUST $JNUG $JDST

https://www.tradingview.com/chart/GDX/vsFoQRJA-GDX-Gold-miner-trading-near-mid-quad-resistance-test-and-perfec/

$GDX, Gold, Miner, Chart, $DUST, $NUGT
$GDX Gold miner trading near mid quad resistance test and perfectly on way to price target. $NUGT $DUST $JNUG $JDST

Recent Gold Price Targets:

May 14 – Will update price target hits soon.

Per recent;

Gold price target April 6 hit perfect to time and price provided on report 14 days prior. $GC_F $GLD $XAUUSD $DUST $NUGT

Gold, price target, algorithm
Gold price target April 6 hit perfect to time and price provided on report 14 days prior. $GC_F $GLD $XAUUSD $DUST $NUGT

Gold price target 1800 Sun lined up to price target time and price provided on report 6 days prior. $GC_F $GLD $XAUUSD $DUST $NUGT

Gold, price, target, hit, algorithm
Gold price target 1800 Sun lined up to price target time and price provided on report 6 days prior. $GC_F $GLD $XAUUSD $DUST $NUGT

Gold price target 1800 Mar 4 hit perfect to time and price provided on report 6 days prior. $GC_F $GLD $XAUUSD $DUST $NUGT

Gold, algorithm, price, target
Gold price target 1800 Mar 4 hit perfect to time and price provided on report 6 days prior. $GC_F $GLD $XAUUSD $DUST $NUGT

Gold price target 1800 Feb 4 hit perfect to time and price provided on report 7 days prior. $GC_F $GLD $XAUUSD $DUST $NUGT

Gold, algorithm, price, target, hit
Gold price target 1800 Feb 4 hit perfect to time and prce provided on report 7 days prior. $GC_F $GLD $XAUUSD $DUST $NUGT

Recent Gold and Gold Miner Trade Alerts:

May 14 – Will update Gold alerts soon.

Alert – Gold long side bias trade set-up trading intra 1346.18 PT’s on chart. Trim in to each resistance & add above.

https://twitter.com/goldalerts_ct/status/986515923657019393

Gold, long, trade
Alert – Gold long side bias trade set-up trading intra 1346.18 PT’s on chart. Trim in to each resistance & add above.

$GDX long side trade trim bias now in to resistance at 23.14 and add above long for next PT 24.21

https://twitter.com/goldalerts_ct/status/984834434015821824

$GDX long side trade trim bias now in to resistance at 23.14 and add above long for next PT 24.21

https://twitter.com/goldalerts_ct/status/984834434015821824

$GDX near mid quad res today – trim longs there and add above on break for 25.19 PT June 5. https://www.tradingview.com/chart/GDX/iriVmaBR-GDX-near-mid-quad-res-today-trim-longs-there-and-add-above-on/ …

https://twitter.com/goldalerts_ct/status/984215137010757632

Gold Trading Plan

Gold trading plan. Long side alert 405 AM – 18 Apr 2018 at green arrow 1346.18 trading 1326.50 intra. Fails at red arrow. Hold. Hedge.

Gold, trading, plan, long
Gold trading plan. Long side alert 405 AM – 18 Apr 2018 at green arrow 1346.18 trading 1326.50 intra. Fails at red arrow. Hold. Hedge.

Will add under 1321.33, 1311.86, 1300.93, expect at latest bounce 1293.51 and add there.

Trading, plan, Gold, adds
Will add under 1321.33, 1311.86, 1300.93, expect at latest bounce 1293.51 and add there.

Major support pivot in the 1293.51 area of Gold Algorithm Model. #Gold #trading #Algorithm #Chart

Gold, support, chart
Major support pivot in the 1293.51 area of Gold Algorithm Model. #Gold #trading #Algorithm #Chart

Green triangle completion of significant time cycle in Gold and support area (inverse apex). Significant buy zone if trade gets there.

Gold, time, price, cycle, chart
Green triangle completion of significant time cycle in Gold and support area (inverse apex). Significant buy zone if trade gets there.

Bullish scenario 1367.80 May 1 is top of quad in current time cycle. Unlikely but worth note for major resistance trims.

Gold, resistance, chart
Bullish scenario 1367.80 May 1 is top of quad in current time cycle. Unlikely but worth note for major resistance trims.

All the best with your trades and look forward to seeing you in the room!

Rosie the Gold Algo

Tweets by ROSIEtheAlgo

Article Topics: Rosie, Gold, Algorithm, Chart, Trading, Gold, $XAUUSD, $GOLD, $GLD, $UGLD, $DGLD, Miners, $GDX, $NUGT, $DUST, $JDST, $JNUG

Read More
US Dollar $DXY Algorithm Model Chart Update Sun May 13 $UUP

US Dollar $DXY Algorithm Model Chart Update Sun May 13 $UUP

May 13, 2018December 30, 2018 $DXY US Dollar Index$DXY US Dollar Algo$UUP, Algorithm, Chart, Dollar, DXY, Trading, USD

$DXY US Dollar Algorithmic Model Chart Update/ Observations Sunday May 13, 2018 $UUP

Welcome to my report for Compound Trading – $DXY the US Dollar algorithm charting model.

I am an early development model – one of seven in development at Compound Trading. This work is very early stage generation 1 work. Generation 2 – 5 is scheduled for 2018 and will eventually be coded to a digital dashboard for our traders to use as an intelligent assistant.

This charting is to be used in conjunction with conventional charting as trader assisted signals. The signals in the model (at this point) are simple that each line on the model chart are considered a support and resistance test.

$DXY US Dollar Algorithm Charting Model $UUP

$DXY US Dollar 30 Min Algorithmic Model Chart with buy sell triggers, trading quads, channel, MAs, price targets. $UUP May 13 339 PM

If this goes to a sell, the yellow are your prospective channel support and resistance for a down turn.

https://www.tradingview.com/chart/DXY/uL7Ifwwc-DXY-US-Dollar-30-Min-Algorithmic-Model-Chart-with-buy-sell-trig/

$DXY, chart, model, 30 MIN, algorithm
$DXY US Dollar 30 Min Algorithmic Model Chart with buy sell triggers, trading quads, channel, MAs, price targets. $UUP May 13 339 PM

Per recent;

$DXY US Dollar 30 Min Algorithmic Model Chart with buy sell triggers, trading quads, channel, MAs, price targets. $UUP Apr 30 352 AM

https://www.tradingview.com/chart/DXY/H4SxD6bF-DXY-US-Dollar-30-Min-Algorithmic-Model-Chart-with-buy-sell-trig/

$DXY, algorithm, model, 30 Min
$DXY US Dollar 30 Min Algorithmic Model Chart with buy sell triggers, trading quads, channel, MAs, price targets. $UUP Apr 30 352 AM

Per recent;

$DXY US Dollar 30 Min Algorithmic Model Chart with buy sell triggers, trading quads, channel, MAs, price targets. $UUP Apr 24 306 AM

https://www.tradingview.com/chart/DXY/fRPAv34Z-DXY-US-Dollar-30-Min-Algorithmic-Model-Chart-with-buy-sell-trig/

DXY, chart, channels, price targets
$DXY US Dollar 30 Min Algorithmic Model Chart with buy sell triggers, trading quads, channel, MAs, price targets. $UUP Apr 24 306 AM

Per recent;

$DXY US Dollar 30 Min Algorithmic Model Chart with buy sell triggers, trading quads, MAs, price targets. $UUP Apr 9 438 AM

https://www.tradingview.com/chart/DXY/BdCMagXx-DXY-US-Dollar-30-Min-Algorithmic-Model-Chart-with-buy-sell-trig/

$DXY, 30 Min Chart, Model
$DXY US Dollar 30 Min Algorithmic Model Chart with buy sell triggers, trading quads, MAs, price targets. $UUP Apr 9 438 AM

$DXY Geometric Daily Chart Model

May 13 – Big test with the dollar here. Visually intense on the geometric US Dollar model. $UUP $DXY

Use link below from last report to view real time chart.

$DXY, algorithm, geometric, model
Big test with the dollar here. Visually intense on the geometric US Dollar model. $UUP $DXY

Per recent;

US Dollar $DXY touched 200 MA on daily and backed off. Geometric model charting.

https://www.tradingview.com/chart/DXY/b394Eu1X-US-Dollar-DXY-touched-200-MA-on-daily-and-backed-off-Geometric/

$DXY, daily, geometric, model, chart
April 24 – US Dollar $DXY range bound sideways at support in geometric model charting.

Per recent’

April 24 – US Dollar $DXY range bound sideways at support in geometric model charting.

https://www.tradingview.com/chart/DXY/lWpcdLmA-US-Dollar-DXY-range-bound-sideways-at-support-in-geometric-mode/

US Dollar, DXY, geometric, model, chart
US Dollar $DXY range bound sideways at support in geometric model charting.

Conventional Charting Considerations:

Bull bear fight is on with dollar closing the week at the 50 MA. Watch that close. $DXY $UUP

https://www.tradingview.com/chart/DXY/du2DtL3W-Bull-bear-fight-is-on-with-dollar-closing-the-week-at-the-50-MA/

Weekly, dollar, chart
Bull bear fight is on with dollar closing the week at the 50 MA. Watch that close. $DXY $UUP

If $DXY US Dollar Index builds structured base over main pivot (red line) it’s a long all day long. $UUP.

https://www.tradingview.com/chart/DXY/PKj5eWu2-If-Dollar-builds-structured-base-over-main-pivot-Notes/

If $DXY -0.18% US Dollar Index -0.18% builds structured base over main pivot (red line) it’s a long all day long. $UUP.

WATCH the MACD for a turn down. Has it’s 200 MA (pink), but that’s not considerable relatively speaking right now.

Watch the pivot and watch the MACD on the daily. MACD turns down and it will be a retrace 99 in 100 times.

daily, dollar, chart
If $DXY US Dollar Index builds structured base over main pivot (red line) it’s a long all day long. $UUP.

Per recent;

$DXY There it is, reach up and touch to 200 MA and a back off intra. MACD trending on Daily.

https://www.tradingview.com/chart/DXY/xM0QQv1p-DXY-There-it-is-reach-up-and-touch-to-200-MA-and-a-back-off-in/

DXY, Daily, Chart, 200 MA, MACD
https://www.tradingview.com/chart/DXY/xM0QQv1p-DXY-There-it-is-reach-up-and-touch-to-200-MA-and-a-back-off-in/

Dollar bulls keep an eye on 200 MA overhead on daily. $DXY #USD $UUP #chart #resistance

https://www.tradingview.com/chart/DXY/DGp06qLl-Dollar-bulls-keep-an-eye-on-200-MA-overhead-on-daily-DXY-USD/

DXY, chart, 200MA, resistance
Dollar bulls keep an eye on 200 MA overhead on daily. $DXY #USD $UUP #chart #resistance

Per recent;

April 9 – $DXY Daily chart range trade stuck with MACD indecisive. $UUP

https://www.tradingview.com/chart/DXY/bgTJqSqy-DXY-range-trade-stuck-with-MACD-indecisive-UUP/

$DXY, Daily, Chart
$DXY range trade stuck with MACD indecisive. $UUP

Per recent;

MACD turned down on DXY. Not an easy trade here or lately.

https://www.tradingview.com/chart/DXY/xeNnsI8J-MACD-turned-down-on-DXY/

$DXY, MACD, daily
MACD turned down on DXY. Not an easy trade here or lately.

Best with your trades and look forward to seeing you in the room!

$DXY US Dollar Algo

Tweets by dxyusd_index

Article Topics: $DXY, Trading, USD, Dollar, Chart, Algorithm, $UUP

Read More
Freedom S&P 500 $SPY Algorithm Chart Model Update Sun May 13 $ES_F $SPXL, $SPXS

Freedom S&P 500 $SPY Algorithm Chart Model Update Sun May 13 $ES_F $SPXL, $SPXS

May 13, 2018December 30, 2018 FREEDOM SPYSP500 (SPY) Algorithm$ES_F, $SPXL, $SPXS, Algorithm, Chart, Freedom, Model, SPY

S&P 500 $SPY Algorithm Update Sunday May 13, 2018 $ES_F ($SPXL, $SPXS) Chart Observations

My name is Freedom the $SPY Algo. Welcome to my new S&P 500 trade report for Compound Trading.

Below you will find algorithmic model charting based on Fibonacci extensions, timing and various other principles. This is a very early stage development model (generation 2 – 5 modeling rolls out in 2018 and as a result the reporting frequency increase significantly – our more advanced algorithm chart models are 4th and 5th generation, such as EPIC the Oil Algo that is graduating to #IA coding).

Notices:

NA

How to use this charting model:

The S & P 500 model is different than others we have in development in that it functions on a number of time-cycles or time-frames, as such, you will see on some reporting a series of time-frames. This report includes a 1 minute model and a 60 minute model with buy sell triggers and reports in near future will include other time-frames for different styles / time-frames of trade.

The simplest way to use the charting is to consider all lines support and resistance decisions with the horizontal grey lines (marked with grey arrows) to be significant trading ranges in the model. The thicker the line the more important. And please consider that all support and resistance lines are approximate as this is a working chart model (a work-sheet). Horizontal and diagonal dotted lines are consider support and resistance.

This chart model is best weighed against conventional charting and used in conjunction with a conventional chart.

If you have questions about the best use of the chart model or private coaching options email our developers anytime at info@compoundtrading.com.

$SPY Algorithm – 1 Minute Charting (Intra-Day):

Current Buy / Sell Triggers for $SPY SP500:

292.29

290.70

289.15

287.58

286.00

284.45

282.88

281.30

279.74

278.17

276.61

275.02

273.46

271.89

270.33

268.75

267.20

265.62

264.04

262.47

260.92

When you open the live chart below in “viewer” mode you can then click on the share button at bottom right and then click on “make it mine” to open real-time chart. Double click the body of the chart to remove or institute indicators at bottom of chart (MACD, Stoch RSI, SQZMOM).

$SPY 1 Min model with current trading range buy sell triggers, fibs, quads, moving averages May 13 28 PM $SPXL $SPXS

https://www.tradingview.com/chart/SPY/p6WJZ1fy-SPY-1-Min-model-with-current-trading-range-buy-sell-triggers-f/

$SPY, 1 Min, Algorithm
$SPY 1 Min model with current trading range buy sell triggers, fibs, quads, moving averages May 13 28 PM $SPXL $SPXS

Per recent;

$SPY 1 Min model with current trading range buy sell triggers, fibs, quads, moving averages May 11 654 AM $SPXL $SPXS

https://www.tradingview.com/chart/SPY/XG8QFXjm-SPY-1-Min-model-with-current-trading-range-buy-sell-triggers-f/

$SPY, algorithm
$SPY 1 Min model with current trading range buy sell triggers, fibs, quads, moving averages May 11 654 AM $SPXL $SPXS

Per recent;

$SPY 1 Min model with current trading range buy sell triggers, fibs, quads, moving averages Apr 30 140 AM $SPXL $SPXS

https://www.tradingview.com/chart/SPY/cRFHocGS-SPY-1-Min-model-with-current-trading-range-buy-sell-triggers-f/

$SPY, chart, model, 1 min
$SPY 1 Min model with current trading range buy sell triggers, fibs, quads, moving averages Apr 30 140 AM $SPXL $SPXS

$SPY Algorithm Model – 60 Minute Charting (Swing Trading):

$SPY 60 minute chart model with channels, Fibonacci, support, resistance, price targets, time cycles. May 13 244 PM $ES_F $SPXL $SPXS

https://www.tradingview.com/chart/SPY/5pP9V65v-SPY-60-minute-chart-model-with-channels-Fibonacci-support-re/

$SPY, algorithm, 60 minute
https://www.tradingview.com/chart/SPY/5pP9V65v-SPY-60-minute-chart-model-with-channels-Fibonacci-support-re/

Per recent;

$SPY 60 Min model 700 AM May 11. Channels, quads, price targets, horizontal Fib support resistance buy sell triggers. $ES_F $SPXL $SPXS

https://www.tradingview.com/chart/SPY/yyPMMSvg-SPY-60-Min-model-700-AM-May-11-Channels-quads-price-targets/

$SPY, 60 Min, Chart, Algorithm
$SPY 60 Min model 700 AM May 11. Channels, quads, price targets, horizontal Fib support resistance buy sell triggers. $ES_F $SPXL $SPXS

Per recent;

$SPY 60 minute chart model with possible up and down trend channels, quads, price targets, horizontal Fib support / resistance.

https://www.tradingview.com/chart/SPY/HYWf7Puw-SPY-60-minute-chart-model-with-possible-up-and-down-trend-chann/

$SPY, 60 Min, chart, channels
$SPY 60 minute chart model with possible up and down trend channels.

Per recent;

$SPY 60 Min model working well for swing trading.

https://www.tradingview.com/chart/SPY/U4iGOM7n-SPY-60-Min-model-working-well-for-swing-trading/

$SPY, 60 Min, chart, model
$SPY 60 Min model working well for swing trading.

$SPY Conventional Charting Considerations:

$SPY Daily Chart, ending week bullish with a break above upper TL and 20 MA near breach 50 MA. $ES_F $SPXL $SPXS

https://www.tradingview.com/chart/SPY/y01eOIL1-SPY-Daily-Chart-ending-week-bullish-with-a-break-above-upper-T/

$SPY, Daily, Chart, MACD
$SPY Daily Chart, ending week bullish with a break above upper TL and 20 MA near breach 50 MA. $ES_F $SPXL $SPXS

Per recent;

$SPY Daily Chart, ending week bullish with MACD turned up, price above MA’s and 20 MA about to cross. $ES_F $SPXL $SPXS

https://www.tradingview.com/chart/SPY/KC1VIKBi-SPY-Daily-Chart-ending-week-bullish-with-MACD-turned-up-price/

$SPY, conventional, Daily, Chart
$SPY Daily Chart, ending week bullish with MACD turned up, price above MA’s and 20 MA about to cross. $ES_F $SPXL $SPXS

Per recent;

$SPY ended week under 50 MA (bearish) and MACD flat.

$SPY, MACD, 200MA
$SPY ended week under 50 MA (bearish) and MACD flat.

Recent Real-Time Alerts, Trading, Model Price Target hits etc.

May 13 – I will update alert and price target examples soon.

Per recent;

9:56 AM – 19 Apr 2018 $SPY Divergent trade returning to target area it tried to pass in the fast lane. See previous recent posts.

$SPY Divergent trade returning to target area it tried to pass in the fast lane. See previous recent posts. pic.twitter.com/3vo4sgNXKH

— Melonopoly (@curtmelonopoly) April 19, 2018

$SPY, divergent, trade, alert
$SPY Divergent trade returning to target area it tried to pass in the fast lane. See previous posts..png

5:18 AM – 18 Apr 2018 That 273.20 mark that comes due in a time cycle peak for $SPY at around 2:00 EST today…. that’s the start of a double extension getting really stretched on the models – corresponds with everything that moved. There ain’t much room available above that short term. Rest on deck.

That 273.20 mark that comes due in a time cycle peak for $SPY at around 2:00 EST today…. that's the start of a double extension getting really stretched on the models – corresponds with everything that moved. There ain't much room available above that short term. Rest on deck. pic.twitter.com/wKfBQ9njDc

— Melonopoly (@curtmelonopoly) April 18, 2018

4:48 AM – 18 Apr 2018 $SPY long side trade cleared mid quad and quad wall. Closed 270.19, next res trims 270.22, 270.45, 271.99, 273.25

https://twitter.com/SwingAlerts_CT/status/986526884790927360

$SPY, trade, alert, chart
$SPY long side trade cleared mid quad and quad wall. Closed 270.19, next res trims 270.22, 270.45, 271.99, 273.25

3:37 PM – 13 Apr 2018 The resistance dump after the alert and the 50 MA support may become your buy area Mon morning. $SPY #swingtrading https://www.tradingview.com/chart/SPY/H375XWXb-The-resistance-dump-after-the-alert-and-the-50-MA-support-may-be/ …

https://twitter.com/SwingAlerts_CT/status/984878380284858369

$SPY, alert, feed
The resistance dump after the alert and the 50 MA support may become your buy area Mon morning. $SPY #swingtrading.png

11:05 AM – 13 Apr 2018 $SPY trim quad resistance alert worked well.

https://twitter.com/SwingAlerts_CT/status/984809783768346624

$SPY, trading, alert
$SPY trim quad resistance alert worked well.

9:31 AM – 13 Apr 2018 $SPY upside resistance trim alert to long side as it approaches 268.00 mid quad res

https://twitter.com/SwingAlerts_CT/status/984786277189988352

$SPY, twitter, alert
$SPY upside resistance trim alert to long side as it approaches 268.00 mid quad res

$SPY at upside resistance pivot and structured trade worked out. Trim longs add above.

https://www.tradingview.com/chart/SPY/JbhGvFKm-SPY-at-upside-resistance-pivot-and-structured-trade-worked-out/

$SPY, upside resistance
$SPY at upside resistance pivot and structured trade worked out. Trim longs add above.

$SPY building structure near the buy trigger and channel bottom we expected. It’s long while it holds area. Trading 261.23 intra day.

https://twitter.com/SwingAlerts_CT/status/981571557771350018

https://www.tradingview.com/chart/SPY/hmAGDbrc-SPY-building-structure-near-the-buy-trigger-and-channel-bottom/

$SPY, chart, structure
$SPY building structure near the buy trigger and channel bottom we expected. It’s long while it holds area.

$SPY Time cycle peak on this simple model is now. If its going to follow channel up it will be soon that it starts. If not, it could be another channel down yet.

https://www.tradingview.com/chart/SPY/IDiDMAVs-SPY-Time-cycle-peak-on-this-simple-model-is-now-If-its-going-t/ …

https://twitter.com/DayAlerts_CT/status/978990333278253056/photo/1pic.twitter.com/50zcoPctuv

$SPY, timecycle, charting
$SPY Time cycle peak on this simple model is now. If its going to follow channel up it will be soon that it starts.

Best with your trades and look forward to seeing you in the room!

Freedom the $SPY Algo

Tweets by FREEDOMtheAlgo

Article Topics: Freedom, Algorithm, Chart, Model, $SPY, $ES_F, $SPXL, $SPXS

Read More
Bitcoin / Crypto Algorithm Model(s) Sun May 13 $BTC $XBTUSD $XBT $ETH $LTC $XRP #Bitcoin #Crypto

Bitcoin / Crypto Algorithm Model(s) Sun May 13 $BTC $XBTUSD $XBT $ETH $LTC $XRP #Bitcoin #Crypto

May 13, 2018August 11, 2018 Crypto the AlgoBitcoin (BTC) Algorithm (Crypto)$BTC, $BTC.X, $BTCUSD, $ETH, $LTC, $XBTUSD, $XRP, Algorithm, BITCOIN, Chart, Crypto, price targets, time cycles, Trade

Crypto the Bitcoin Algorithm Charting Model Newsletter including Specific Time Cycle Price Targets and Buy / Sell Triggers Sunday May 13, 2018.

Charts for $BTC $BTCUSD $XBTUSD $XBT $BTC.X $ETH $LTC $XRP #Bitcoin #Crypto

Hello! My name is Crypto the Bitcoin Algo. Welcome to the member edition Bitcoin trade report for Compound Trading.

Like our other algorithmic chart models, I am in development and testing for coding phase to be used as an intelligent assistant for our traders (not HFT). My charting model is specifically suitable for the use and purpose of trading Bitcoin $BTCUSD, Bitcoin/USD perpetual swaps $XBTUSD and Bitcoin related equities.

Note: The $XBTUSD (Bitcoin swaps) model is built on a chart from BitMEX. Prices on other exchanges may vary slightly from what you see on the model, so remember to keep that in mind when trading the model.

Notices: 

  • We are launching our 24 hour crypto trading desk May 15. This team of three will also be responsible for the development and coding of our algorithms and alerting to realtime Twitter alert feeds. Read more here; https://compoundtrading.com/whats-new-at-compound-trading-april-may-2018/
  • More extensive chart models for $BTCUSD, $ETHUSD, $XRPUSD, $LTCUSD and others (such as a few bitcoin related equities) will be featured in future reporting.
  • Join us in our private Crypto Trading room on discord!
  • For newer users – read the blog post about how to trade Bitcoin here.

Primary Methods of Bitcoin Trade: 

The primary method of trade we have found works with the most predictability is to wait for bitcoin to breach the upper right wall of a quadrant (the orange, blue or grey diagonal dotted lines – the thicker lines are more significant as they represent wider time-frames) and confirm over the next horizontal Fibonacci resistance. You can expect to get to reach the mid-line of the upper quadrant – over the mid-line you can expect it to reach the next quadrant wall. Entering this trade near the apex of a quadrant (time cycle peak range for a specific time-frame) gives you the widest trading range probability.

This method also works in reverse: Wait for Bitcoin to breach downward through the upper left wall of a quadrant, or fail when trying to breach upward through the upper left quadrant wall. Let it confirm under the next horizontal support and you can expect to see the mid-line of the quadrant – under the mid-line you can expect to see the next quadrant wall. Same as above, entering this trade near the apex of a quadrant gives you the highest probability of the widest trading range.

Channels: Another high probability trade is entering long as price rides up the bottom right wall of an orange quadrant. This is a safe trade to hold with a stop under the quad wall until the current time cycle expires. This trade works in reverse as well. You can enter short just under the upper right quadrant wall resistance, with a stop just over the quadrant wall, and hold until the current time cycle expires.

Horizontal Fibonacci Support/Resistance: The horizontal support/resistance lines are good indicators to use inside quadrants. The light green 0.5 Fibonacci line and the grey 1.0 or 0 Fibonacci levels (mid-lines) are the most significant. Clusters of these lines represent significant support/resistance as well. Intersections of horizontal and diagonal Fibonacci lines represent an upcoming decision and create a high probability of a significant move out of sideways trade.

Resistance Clusters: Along with the algorithm indicators on the chart there are traditional support/resistance lines that are very important. When these lines converge volatility tends to increase. Under the cluster is a high probability short. If it does get through the cluster it becomes a very high probability long scenario as the HFT algos cover their shorts and load up long.

Targets: Red circles on charting. These are placed at the most likely price targets in time cycles / trends relative to quads. These are still in very early stage of development/testing and should be used for observation only at this point. Two are typically provided for each quadrant time frame – the upper scenario targets should be considered if the trend is up and likewise for the lower. I do not recommend entering trades based on these targets. Also, at times the mid quad support / resistance line is highlighted with a target if trade is not extremely bullish or bearish.

Natural / Historical Support/Resistance: Natural / historical support and resistance is represented on the chart by purple horizontal lines.

Conventional Charting: Conventional charting should be weighed against the model(s) with all trade decisions.

In summary, our first generation Bitcoin algorithm chart model uses the following indicators (listed from most predictable to least in terms of win rate): 

  1. Trading range created by long term algorithmic modeled quadrant support and resistance (blue dotted lines)
  2. Trading range between buy/sell trigger levels (grey/green arrows and solid lines)
  3. Directional channels formed by long term algorithmic modeled support and resistance
  4. Horizontal Fibonacci support and resistance (multi-colored horizontal lines)
  5. Conventional Natural support and resistance (purple horizontal lines)
  6. Long term conventional trend lines (red diagonal lines)
  7. Conventional MA’s 

Bitcoin Algorithm (Daily Chart – Swing Trading):

Click link to open initial chart viewer screen, then share button at bottom right of screen, then make it mine, then double click on chart body to hide or reveal indicators at bottom of chart (MACD etc).

Algorithm model on the Daily Bitcoin Chart: 

Bitcoin Daily Chart is still in uptrend. 50 MA tested as support. Price targets are in play. May 13 2018 $BTC $XBTUSD #Bitcoin

https://www.tradingview.com/chart/XBTUSD/Zb6Gqv95-Bitcoin-Daily-Chart-is-still-in-uptrend-50-MA-tested-as-support/

Price Targets on Daily Chart Model:

Trading 8645.00 intraday;

May 21 Bitcoin Price Targets:

Bearish 5824.00

Moderate 9808.00

Bullish 13821.00

July 4 Bitcoin Price Targets:

Bearish 9808.00

Moderate 13821.00

Bullish 17745.00

Bitcoin, daily, chart, algorithm, $BTC, $XBTUSD
Bitcoin Daily Chart is still in uptrend. 50 MA tested as support. Price targets are in play. May 13 2018 $BTC $XBTUSD #Bitcoin

Observations / Chart Indicators: Trading Plan for Current Area of Bitcoin Trade:

May 13 – The mid channel quad (horizontal fib) held price down and a retrace occurred.

The Bitcoin daily chart is still in the uptrend channel. Trading under the mid channel line (green dotted), so it is likely to near the bottom of the uptrending channel (yellow line arrow). But not likely to hit it perfectly as it is in an uptrend. It is likely to continue up prior to trade hitting the bottom of the channel. The opposite is true in down trends.

When price dumped it cradled in the 50 MA and bounced. Before a return to the bottom of the channel (per above paragraph) it is probable that trade will stay bullish in to that target in the 9808.00 region on May 21, this is a decent return considering intra-day trade at 8645.00 today. However, if price is lost to the downside of the 50 MA then a target hit is unlikely.

Those are your probabilities and my personal trading plan specific to the day model.

Daytrading Bitcoin – 30 Minute Charting

May 21 Price Targets:

Most bullish 9867.60 

Moderate Bullish 8869.30

Bearish 7879.30

Most Bearish 6046.00

Bitcoin trade needs the 200 MA that’s overhead and 8873.00 mid quad to get higher short term. 130PM May 13 2018 $BTC $XBTUSD #Bitcoin

https://www.tradingview.com/chart/XBTUSD/KTRK3ywy-Bitcoin-trade-needs-the-200-MA-that-s-overhead-and-8873-00-mid-q/

Bitcoin, trade, $BTC, $XBTUSD, daytraading, algorithm
Bitcoin trade needs the 200 MA that’s overhead and 8873.00 mid quad to get higher short term. 130PM May 13 2018 $BTC $XBTUSD #Bitcoin

Per recent;

May 10 – Bitcoin daytrading model on 30 minute chart. Near 200 MA breach intraday. $BTC $XBTUSD #Bitcoin

https://www.tradingview.com/chart/XBTUSD/h4FNmwVs-Bitcoin-daytrading-model-on-30-minute-chart-Near-200-MA-breach/

$BTC, daytrading, algorithm, chart
Bitcoin daytrading model on 30 minute chart. Near 200 MA breach intraday. $BTC $XBTUSD #Bitcoin

Per recent;

April 29 – Most bullish price target 9867.00 April 28 scenario didn’t quite hit… next time cycle Bitcoin daytrading model $BTC $XBTUSD #Bitcoin

https://www.tradingview.com/chart/XBTUSD/6VN69FR6-Most-bullish-price-target-9867-00-May-28-scenario-didn-t-quite-h/

Bitcoin, daytrading, model
Most bullish price target 9867.00 May 28 scenario didn’t quite hit… next time cycle Bitcoin daytrading model $BTC $XBTUSD #Bitcoin

April 22 – Bullish scenario price target 9867.00 possible April 28 on Bitcoin daytrading model $BTC $XBTUSD #Bitcoin

https://www.tradingview.com/chart/XBTUSD/nw3oiYLw-Bullish-scenario-price-target-9867-00-possible-May-28-on-Bitcoin/

Price target, Bitcoin, daytrading, chart
Bullish scenario price target 9867.00 possible April 28 on Bitcoin daytrading model $BTC $XBTUSD #Bitcoin

Recent Bitcoin Real-Time Trade Alerts / Charting Set-up Alerts

If you are reviewing this newsletter (as a historical unlocked post) and not a member of our service and would like a tour of our private discord server (trading chat / alerts etc) or our private Twitter member $BTC alert feed let us know. You can check out our call rate for yourself. Transparent trading is important to us.

May 13 – Will post recent alerts soon when time allows.

Per recent;

April 29 – There have been many calls since bottom on our private server and private twitter feed… I’m not going to take the time to post them here right now but I will post this rant of tweets… the private member alerts I’ll post next report if time (they were all spot on alerts).

I even told ya how I knew where the bottom was. $BTC #Bitcoin #algorithm

I even told ya how I knew where the bottom was. $BTC #Bitcoin #algorithm

Next should be insane trading in crypto space. Could be wrong… but I’m feelin it. #crypto $BTC $XBT $ETH $LTC #trading screenshot

Next should be insane trading in crypto space. Could be wrong… but I’m feelin it. #crypto $BTC $XBT $ETH $LTC #trading screenshot

Next should be insane trading in crypto space. Could be wrong… but I’m feelin it. #crypto $BTC $XBT $ETH $LTC #trading

Next should be insane trading in crypto space. Could be wrong… but I’m feelin it. #crypto $BTC $XBT $ETH $LTC #trading

$BTC near HOD and some bullish action on intra. Tweet screen shot.

$BTC near HOD and some bullish action on intra. Tweet screen shot.

$BTC near HOD and some bullish action on intra. $BTC #bitcoin #calls

$BTC near HOD and some bullish action on intra. $BTC #bitcoin #calls

Technical precision trading. Price target hit perfect on daytrading algorithm model charting. $BTC $XBT #Bitcoin #Crypto #Trading

Bitcoin, price, target, hit, alert
Technical precision trading. Price target hit perfect on daytrading algorithm model charting. $BTC $XBT #Bitcoin #Crypto #Trading

Technical precision trading. Price target hit perfect on daytrading algorithm model charting. $BTC $XBT #Bitcoin #Crypto #Trading pic.twitter.com/l1pafs56QD

— Crypto the BTC Algo (@CryptotheAlgo) April 18, 2018

Bitcoin coming in to a possible buy trigger zone on daytrading chart. $BTC #Bitcoin

https://twitter.com/BTCAlerts_CT/status/978317583987429376

Bitcoin, realtime, trade, alert
Bitcoin coming in to a possible buy trigger zone on daytrading chart. $BTC #Bitcoin

$BTC Bitcoin popped now 400 points since alert of support. Not a bad RR here for long test. If nothing else a day trade.

https://twitter.com/BTCAlerts_CT/status/978397655796801538

Bitcoin time price cycle peak coming April 7 – path of least resistance down target but my bias is to up. Trade price. We start trading live again Monday so I’ll broadcast our trading group moves live for this setup. $BTC #Bitcoin #trading #crypto (alerted in private member Discord server)

Bitcoin, trading, timecycle, chart
Bitcoin time price cycle peak coming April 7 – path of least resistance down target but my bias is to up. Trade price. $BTC #Bitcoin #trading #crypto.png

And the result…. price is dumping in to lower target identified on trade alert…. intrad-day getting close. Charting wins. Trader bias not so good on this one.

price tragets, Bitcoin
Bitcoin did dump in to down target.

Ethereum Basic Algorithm Charting Model on Daily Time Frame:

Ethereum Daily Chart – Bounced before mid quad – bulls are in – channel in play. Main buy sell triggers noted with white arrows. $ETH $ETHUSD

Ethereum continues to be one of the most structured daily charts on any market. Love it. Very predictable trade. #algorithm #models $ETHUSD #crypto $STUDY

Ethereum continues to be one of the most structured daily charts on any market. Love it. Very predictable trade. #algorithm #models $ETHUSD #crypto $STUDY

— Melonopoly (@curtmelonopoly) May 13, 2018

https://www.tradingview.com/chart/ETHUSD/9ohNQFqv-Ethereum-Daily-Chart-Bounced-before-mid-quad-bulls-are-in/

$ETHUSD, Ethereum, Algorithm
Ethereum Daily Chart – Bounced before mid quad – bulls are in – channel in play. Main buy sell triggers noted with white arrows. $ETH $ETHUSD

Per recent;

May 10 – Ethereum Daily Chart – One of my favs on any market. Channel working. Main buy sell triggers noted with white arrows. $ETH $ETHUSD

https://www.tradingview.com/chart/ETHUSD/OQA1VBrX-Ethereum-Daily-Chart-One-of-my-favs-on-any-market-Channel-wor/

$ETHUSD, $ETH, Daily, Chart, Algorithm
Ethereum Daily Chart – One of my favs on any market. Channel working. Main buy sell triggers noted with white arrows. $ETH $ETHUSD

Per recent;

April 29 – Ethereum coming up on 100 MA resistance, trim in to it and add above. $ETH

https://www.tradingview.com/chart/ETHUSD/hBr0bcky-Ethereum-May-2-price-target-hit-early-If-channel-reversal-holds/

Ethereum coming up on 100 MA resistance, trim in to it and add above. $ETH

Litecoin Basic Algorithm Charting Model

Primary buy sell triggers on Litecoin daily chart:

475.00

381.00

287.00

192.00

98.00

Litecoin still holding near bottom range of channel but it doesn’t look great – to be determined. May 13 147 PM $LTC $LTCUSD

https://www.tradingview.com/chart/LTCUSD/YTMcvadh-Litecoin-still-holding-near-bottom-range-of-channel-but-it-doesn/

$LTC, algorithm, Litecoin
Litecoin still holding near bottom range of channel but it doesn’t look great – to be determined. May 13 147 PM $LTC $LTCUSD

May 10 – Litecoin still running bottom of algorithmic channel charted long in advance of trade in that area. $LTC

https://www.tradingview.com/chart/LTCUSD/wh7zibon-Litecoin-still-running-bottom-of-algorithmic-channel-charted-lon/

$LTC, algorithm, chart
Litecoin still running bottom of algorithmic channel charted long in advance of trade in that area. $LTC

Per recent;

April 29 – $LTC running bottom side of channel testing 200 MA upside resistance.

https://www.tradingview.com/chart/LTCUSD/t8Yjsog9-LTC-running-bottom-side-of-channel-testing-200-MA-upside-resist/

$LTC running bottom side of channel testing 200 MA upside resistance.

Ripple Basic Algorithm Charting Model $XRP

May 13 – Ripple needs .932 for a chance for a bullish structured run. $XRP $XRPUSD.

I put some tighter time from Fib structure in the model for those that asked for daytrading signals.

$XRP. algorithm
Ripple needs .932 for a chance for a bullish structured run. $XRP $XRPUSD

Per recent;

May 10 – Nothing to report. Flat.

April 29 – $XRP flat but over 200 MA on daily.

BUT still great returns from 40s to near 90s WOW.

https://www.tradingview.com/chart/XRPUSD/0aDABOJz-XRP-flat-but-over-200-MA-on-daily/

$XRP flat but over 200 MA on daily.

Per recent;

April 22 – $XRP over .888 targets 1.31 then 1.65 mid term. Daytrading model on -deck. #ripple

https://www.tradingview.com/chart/XRPUSD/zIn8bXCj-XRP-over-888-targets1-31-then-1-65-mid-term-Daytrading-model/

$XRP, price targets, chart, Ripple
$XRP over .888 targets1.31 then 1.65 mid term. Daytrading model on -deck. #ripple


< End of report >

Any questions give us a shout anytime!

Follow Me:

Live Twitter Alert Feed for Bitcoin Trade Set-ups: @BTCAlerts_CT, Public Feed: @cryptothealgo

To Subscribe to our Crypto Services:

Link to Services and Pricing Overview (master list).

Link to Standalone $BTC Crypto Newsletter.

Link to Real-Time Live Bitcoin Alerts (Twitter).

Link to Crypto Bundle (Alerts, Private Trading Discord Server, Newsletter).

Review historical (unlocked to public) Weekly Bitcoin Newsletter Algorithm Reporting. Scroll down landing page to get to historical reports.

Post topics; Crypto, chart, $BTC, $BTCUSD, $XBTUSD, $BTC.X, $ETH, $LTC, $XRP, Bitcoin, trade, price targets, time cycles, algorithm

Read More
EPIC Oil Algorithm Report Sun May 13 FX: $USOIL $WTIC $CL_F $USO $CL_F $UWT $DWT $UCO $SCO

EPIC Oil Algorithm Report Sun May 13 FX: $USOIL $WTIC $CL_F $USO $CL_F $UWT $DWT $UCO $SCO

May 13, 2018July 8, 2018 Epic the AlgoCrude Oil Trading Algorithm (EPIC)$CL_F, $UCO, $USO, $USOIL, $UWT, $WTI, Algorithm, Chart, Crude, DWT, EPIC, Oil, Trading Room

EPIC the Oil Trading Algorithm Charting Report Sunday May 13, 2018 (Member Edition). FX: $USOIL $WTIC – $USO $CL_F $UWT $DWT $UCO $SCO $ERX $ERY $GUSH $DRIP

Welcome to my new FX: $USOIL $WTI oil trade report. My name is EPIC the Oil Algo and I am one of six Algorithmic Charting services in development at Compound Trading.

NOTICES:

New members to our oil algorithm chart model service – please on-board in a way that best equips you to be profitable. Visit my Twitter feed (@EPICtheAlgo) and review tweets over the last few months, visit our blog and review my recent blog posts, our You Tube channel “how my algorithm works”, “how to use my charting”, the weekly EIA report videos and our website (it explains how I was developed). Reviewing those points of reference will increase your chance of success considerably. In this report, some recent example “how-to” videos are include below.

Oil Trade Coaching – Users of this algorithm chart model may opt for private one-on-one coaching with our lead trader and / or an experienced trader that has worked under our lead trader. On our website standard one-on-one online coaching packages are made available (coaching via Skype) or you can request a customized package (reflecting the time you wish to invest in learning). To request a custom package suited to your needs email info@compoundtrading.com or click here for standard private trade coaching packages. Other options for coaching include online webinars and private on location and in-person coaching sessions. 

Oil Trading Room – How to Use My Oil Algorithm

Oil Trading Room – How to Trade Intra-day with my Algorithm Charting

MULTI-USERS: Institutional / commercial platform now available.

SOFTWARE: My algorithmic charting is planned to go to developer coding phase for our trader’s dashboard program. Please review my algorithm development process, about my oil algorithm story on our website www.compoundtrading.com and my oil algo charting posts on my Twitter feed and/or this blog.

HOW MY ALGORITHM WORKS: I am an oil algorithm model in development. My math is based on traditional indicators (up to fifty at any given time each weighted on win ratio merit – all not shown on chart at any given time) – such as simple math calculations relating to price and volume, Fibonacci, simple pivots, moving averages, Gann, Schiff and various other charting, geometric and mathematical factors. I do not yet have AI or Geo Political integration – only math as it relates to traditional indicators with the primary goal being probabilities. I am not a high frequency robot type algorithm – I am presented on (and used on) a traditional trading chart as one would normally use as a probability indicator. The goal is to provide our trader’s with an edge when triggering entries and exits on trades with instruments that rely on the price of crude oil.

Below you will find a simplified view of levels that can be used on a traditional chart (both intra-day and as a swing trader or investor). This work and associated trade, should be considered one decision at a time, “if this happens then this or this are my targets”… price – trigger – trade and so on. Questions to; info@compoundtrading.com, message our lead trader on Twitter, or message a lead trader in the trade room.

Visit this link for more information about my oil algorithm development, this link explains how our algorithmic charting is done, this YouTube video explains in summary how my algorithm works https://www.youtube.com/watch?v=LUNyxFoXJp8 this link for more information about our algorithmic stock charting models and what makes them different than most.

EVERY CALL WE MAKE, EVERY PUBLIC INTERACTION, REPRESENTATION OF TRADE SIGNAL (ON EVERY VENUE) IS VIDEO RECORDED (TRADING ROOM), ON SOCIAL MEDIA OR ON BLOG / WEBSITE TIME-STAMPED FOR PERMANENT RECORD AND TRANSPARENCY. PLEASE ALSO REFER TO OUR PUBLIC DISCLOSURE https://compoundtrading.com/disclosure-disclaimer/.

FX: $USOIL $WTI Observations:

Below is the link for the live chart version of EPIC the Oil Algorithm Live Real-Time Trading Chart for May 13, 2018. Click on share button (bottom right beside flag) and when that screen opens you can click on make it mine to make edits etc:

https://www.tradingview.com/chart/USOIL/z8meFqNU-Oil-up-channel-scenario-May-13-1122-AM-EPIC-Oil-Algorithm-Chart/

Oil, algorithm, trade, $USOIL. $WTI
Oil current trade. May 13 1122 AM EPIC Oil Algorithm Chart FX $USOIL $WTI #OIL $USO $UWT $DWT $CL_F #OOTT #Algo

May 13, 2018

The first most predictable trade is the significant resistance cluster area formed by red trend lines (see previous posts and supplemental conventional charting below). As noted in the previous reports, at this point (as you will note when reviewing the charting below) trade has cleared all conventional trend-line resistance points to the upside.

The second most predictable trade (wide trading range primary resistance and support that become predictable buy and sell triggers). Current algorithmic model wide trading range resistance (grey arrow – grey horizontal line) at approximately 72.54 in the current trading range. Current algorithmic model wide trading range support (grey arrow – grey horizontal line) at approximately 68.93 in the current trading range – these areas are general range support and resistance areas (our algorithm uses a .15 – .20 cent buffer on either side for these trades). Trading between the resistance / support horizontal grey lines is extremely profitable risk – reward if one is disciplined to the patience required and follows the trend of trade.

The lower trading range is 65.32 to 68.93

The upper trading range is 72.54 to 76.15

Trading Bias / Forward Guidance: As the week last week progressed trade became more structured in the model, so this week should be a decent trading week. And per recent posts I am looking for continued long bias trading to resistance at 72.50 – 73.50 region (could over shoot near 75.00). Trade price and watch for alerts..

Third most predictable trade (support and resistance of uptrend or down trend channels). On the chart an upward trending trade channel is presented and a downward option (channel support and resistance / trading range is represented as diagonal dotted orange lines and purple arrows – as made available, assist in displaying directional trade decision areas).

Fourth most predictable trade (support and resistance of 30 min quadrants). The diagonal lines make up quadrants (in this instance on a 30 min chart) and are represented as orange diagonal lines that make up geometric diamond shapes. These lines also assist in intra-day trade.

Fifth most predictable trade (support and resistance of most applicable Fibonacci) the Fib support and resistance lines are the horizontal lines in various colors with the exception of purple and yellow (see below). These horizontal lines become support and resistance for intra-day trade.

Sixth most predictable trade (support and resistance of historical support and resistance) Natural / historical support and resistance lines shown in purple or yellow – they represent historical support and resistance. The strongest of the historical support and resistance lines are shown in yellow horizontal and are typically accompanied by a yellow arrow marker.

Seventh most predictable trade signal we use are the time and price targets (red circles). When trade is in a significant uptrend or downtrend the targets become very precise and move up the indicator priority list quick.

Current and more recent trade has not been predictable due to divergent trade (associated geopolitical catalysts). Tues, Wed and Fri targets are most predictable in extended multi week uptrends or downtrends.

The Eighth most predictable trade is intra-day. You will notice on some of the charting geometric shapes in green on some of my charting (at times). They are charted live in the trading room and at times the lead trader will highlight these areas intra with white outlines (typically geometric shapes such as diamonds or triangles).

Wide Trading Range – Buy and Sell Triggers for Swing Trading:

Trade the ranges noted above between the thick grey lines (grey arrows) for the most predictable swing trades in the lower region are between 58.13 to 61.72, 61.72 to 65.32, 65.32 to 68.92, 68.93 to 72.54 and 72.54 to 76.15. This is a highly profitable risk-reward way to trade oil if you can be patient to trigger at only the break of the wide range charting areas and are disciplined to cut a losing trade that does not prove in your anticipated trend.

Or trade the range between the channel diagonal lines at support and resistance in up or down channel.

Oil down channel scenario. May 13 1123 AM EPIC Oil Algorithm Chart FX $USOIL $WTI #OIL $USO $UWT $DWT $CL_F #OOTT #Algo

Oil, down channel, trend, chart
Oil down channel scenario. May 13 1123 AM EPIC Oil Algorithm Chart FX $USOIL $WTI #OIL $USO $UWT $DWT $CL_F #OOTT #Algo

Oil up channel scenario. May 13 1122 AM EPIC Oil Algorithm Chart FX $USOIL $WTI #OIL $USO $UWT $DWT $CL_F #OOTT #Algo

Oil, up channel, trend, chart
Oil up channel scenario. May 13 1122 AM EPIC Oil Algorithm Chart FX $USOIL $WTI #OIL $USO $UWT $DWT $CL_F #OOTT #Algo

Oil Swing Trading Chart Considerations with Price Targets:

Monthly charting review:

May 13 – Oil Monthly. Right at pivot, between 100 MA Resistance 200 MA Support. MACD SQZMOM trending up Stoch high. $USOIL $WTI $USO #OIL

https://www.tradingview.com/chart/USOIL/2gBYBkaA-Oil-Monthly-At-pivot-btwn-100MA-res-200-MA-sup-Notes/

OIl, monthly, chart, MACD, pivot
Oil Monthly. Right at pivot, between 100 MA Resistance 200 MA Support. MACD SQZMOM trending up Stoch high. $USOIL $WTI $USO #OIL

Oil Monthly. Right at pivot, between 100 MA Resistance 200 MA Support. MACD SQZMOM trending up Stoch high. $USOIL $WTI $USO #OIL

Watch the indicators close for a turn if trade nears that 100 MA (Stochastic RSI, MACD and SQMOM).

I would expect oil to coil that pivot (yellow line) and bounce between 100 MA and 200 MA range on monthly for some time. Yet to be seen… but it’s highly probable imo.

Per recent;

Oil Monthly chart. Likely resistance at 100 MA support at 200 MA pivot at yellow line. $USOIL $WTI #OIL

https://www.tradingview.com/chart/USOIL/SkIPxh5z-Oil-Monthly-chart-Likely-resistance-at-100-MA-support-at-200-MA/

Oil, pivot, chart
Oil Monthly chart. Likely resistance at 100 MA support at 200 MA pivot at yellow line. $USOIL $WTI #OIL

Per recent;

100 MA resistance test on oil monthly chart comes in right where Fib resistance comes in on weekly chart. $USOIL $WTI

https://www.tradingview.com/chart/USOIL/AA9666zc-100-MA-resistance-test-on-oil-monthly-chart-comes-in-right-where/

Oil, monthly, chart, 100MA
100 MA resistance test on oil monthly chart comes in right where Fib resistance comes in on weekly chart. $USOIL $WTI

Per recent;

April 29 – Oil Monthly chart shows next significant resistance at 100 MA. $USOIL $WTI #OIL

https://www.tradingview.com/chart/USOIL/xPmCUevh-Oil-Monthly-chart-shows-next-significant-resistance-at-100-MA/

Oil, monthly, chart
Oil Monthly chart shows next significant resistance at 100 MA. $USOIL $WTI #OIL

Weekly Charting Review:

Oil near weekly model target. Historical probability high for retrace. #timecycle $USOIL $WTIC $USO $UWT $DWT $UCO

https://www.tradingview.com/chart/USOIL/1QewEsoM-Oil-retrace-probability-high-historically-timecycle-Notes/

Oil, weekly, target, retrace
Oil near weekly model target. Historical probability high for retrace. #timecycle $USOIL $WTI $USO #OIL

Per recent;

Significant resistance at 74.71 on weekly nearing FX $USOIL $WTI Weekly Chart.

https://www.tradingview.com/chart/USOIL/gV6rqCeW-Significant-resistance-at-74-71-on-weekly-nearing-FX-USOIL-WTI/

Oil, weekly, chart
Significant resistance at 74.71 on weekly nearing FX $USOIL $WTI Weekly Chart.

Per recent;

Oil weekly chart says we may be range bound 65.00 – 75.00 for some time. YTBD. $USOIL $WTI

https://www.tradingview.com/chart/USOIL/jYNcsu1c-Oil-weekly-chart-says-we-may-be-range-bound-65-00-75-00-for-so/

Oil, weekly, chart
https://www.tradingview.com/chart/USOIL/jYNcsu1c-Oil-weekly-chart-says-we-may-be-range-bound-65-00-75-00-for-so/

Diagonal Trend Lines:

Diagonal trend-lines are critical inflection points (currently represented in red below on our conventional charting).

Please review many of my recent posts so you can learn about how important these diagonal trend-lines are. If one is breached you can look to pull-back to next diagonal trend line about 90% of the time. Also pay attention to how thick the lines are – the thicker the line the more important because they represent extensions from previous time / price cycles.

Remember you can come in to the chat room to message the trader and REMEMBER I have posted a live chart link in this post so if you can’t see the lines well on this chart above you can go to the live chart link and watch for member live algo chart links through-out the day in your email inbox!

The diagonal trend-lines are marked on chart below:

Per previous:

Oil has now cleared every trendline resistance provided on conventional charting I’ve posted last year. $USOIL $WTI $CL_F #OOTT #OIL $USO $UWT $DWT 233 PM Jan 1

Oil, trendline, resistance, chart
Oil has now cleared every trendline resistance provided on conventional charting I’ve posted last year. $USOIL $WTI $CL_F #OOTT #OIL $USO $UWT $DWT 233 PM Jan 1

Oil chart. Conventional indicator considerations (notes on chart). $USOIL $WTI $CL_F #OOTT #OIL $USO $UWT $DWT 608 PM Dec 17, 2017

https://www.tradingview.com/chart/USOIL/MloezxWQ-Oil-chart-Conventional-indicator-considerations-notes-on-chart/

OIL, WTI, Chart, Indicators, Daily
Oil chart. Conventional indicator considerations (notes on chart). $USOIL $WTI $CL_F #OOTT #OIL $USO $UWT $DWT 608 PM Dec 17, 2017

Previous posts for perspective;

$USOIL, $WTI, Chart, Trendlines
Simple lines show expose clusters of resistance. Crude algo intra work sheet 201 AM Apr 10 FX $USOIL $WTIC #OIL $CL_F CL $USO $UCO $SCO $UWT $DWT #OOTT

Notice how when the daily chart is opened, the simple lines extend to current day trade.

Daily chart view. Simple lines show expose clusters of resistance. Crude algo intra work sheet 213 AM Apr 10 FX $USOIL $WTIC #OIL $CL_F CL $USO $UCO $SCO $UWT $DWT #OOTT

Daily, $USOIL $WTI, Chart, Trendlines
Daily chart view. Simple lines show expose clusters of resistance. Crude algo intra work sheet 213 AM Apr 10 FX $USOIL $WTIC #OIL $CL_F CL $USO $UCO $SCO $UWT $DWT #OOTT

Fibonacci Levels:

Watch the lines for support and resistance. Careful using them as traditional retracement levels with crude because the algo lines etc are more dominant / predictable. But the Fib lines are excellent indicators for intra-day trade support and resistance.

The Fibonacci lines are marked on main chart above.

Horizontal Trend-Lines (purple):

Horizontal trend-lines are not as important as the other indicators reviewed above, however, they do serve as important resistance and support intra-day for tight trading and they are important if thick (in other words they come from previous time / price cycles). WE STARTED TO REPRESENT THE REALLY IMPORTANT LINES IN YELLOW FYI FOR EASE. Refer to chart for current applicable horizontal trend-lines.

Horizontal trend-lines are marked on charts above.

Oil Time / Price Cycles:

Watch your email and / or my Twitter feed for time price cycles they may start to terminate.

Time / price cycles are the single most important indicator and my record calling them is near 100% – since inception seven months ago. The reason they are so important is that a trader does not want to be holding a crude oil instrument at termination of a time cycle if not absolutely sure if price will go up or down. A trade may choose to enter a large position in advance of a time price cycle termination IF THERE IS A HIGH PROBABILITY OF A DIRECTION IN PRICE and if the market is trading at a really important pivot area. In other words, if the market is trading at the bottom of the upward trending channel at a support (yellow lines) and we knew there was a significant probability of a time cycle about to terminate a trader may enter with a long position. The price really spikes or drops significantly when these important time cycles terminate.

The problem with time / price cycle terminations is they change from minute to minute (depending on where price is on the chart) so you have to be in the trade room to get the alert. Our lead traders will do everything they can in future to send these on SMS but we have to be careful because it can be difficult with so much going on in the room. The reason they (time cycles) change is because they are actually represented by or are geometric shapes in the chart – I know it sounds odd but I have (as I mentioned) hit these calls just shy of 100%. The oil political people know the same algorithmic modeling principles and they ALWAYS TIME THEIR BIG ANNOUNCEMENTS AROUND THE TIME PRICE CYCLE TERMINATIONS.

So if you can picture a triangle on the chart – and price is trading in the triangle – and price is going to come to the edge of the triangle and there is a significant support or resistance or an algo line terminating there too or a target (those type of indications)… then we know there is a high probability of a time and price change. In other words, it is where there are clusters of algorithm points that cross and when price is going to cross over that cluster is where they are. And these are represented on all the different time frames – the larger the time frame – the larger the time price cycle termination – the larger the spike or downdraft. This is where we establish our intra-day quadrants from for sniping trades (which we will put in to the room soon because it looks like the geo political rhetoric is over for a while making them more predictable). Difficult to explain in short. So we will do our best to SMS alert these in future.

Also, the real large or important time / price cycle terminations we know far in advance and they can be put in these newsletters.

If you review my Epic the Oil Algo Twitter feed, my blog posts and my story on our website you will get a feel for how accurate these calls are.

Alpha Algo Trading Trend-Lines (Primary – Red dotted lines. Secondary – White dotted lines):

To determine which algo line is most alpha (or probable) intra day, it is the nearest line to price action. This can also help you determine the trend of trade. If the algo line is trending up the price will follow it up until price is tested at an algorithm indicator (the main tests are diagonal trendlines, horizontal trendlines, time / price cycles etc – as I have shared with you). This is why it is important to watch all the lines because they are all support and resistance. To keep it simple trade the range (yellow lines) as I’ve mentioned but keep an eye on these indicators.

Current Alpha Algo Targets (Red circles):

Your closest target that crude is trending toward is always the most probable.Then, your second most probable is the one that is up or down trend depending on whether general price is in an upward or downtrend for the most recent week or so and what your other indicators look like (such as the MA’s I explained above).

The other way to determine which targets are in play is actually quite simple, you will notice that crude trades between the channel lines up and down and up and down and there are various support and resistance along the way. If it hits a target at the top of the channel you can bet most times (unless the next day like today) that the next target hit will be at the bottom of the channel.

Wait for the price to trend toward a target and take your position and watch as price gets closer and closer to the target. Remember, that the machines trade from decision to decision – or in other words from support to next resistance or resistance to next support or when the times come each week on Tuesday Wednesday and Friday they will trend toward the target that market price action determines they go to.

Our lead trader will explain more in the room and do not hesitate to ask our lead trader in the room by private message or on twitter to explain intra day decisions.

Recent Live Oil Trade Alerts:

May 13 – Will update the alerts section soon.

April 29 – I will update the trade alerts on the next report when there is more time. The bottom line is that since last report the trades have been fantastic winners.

EPIC on fire, not quite 100% win rate, but close. Oil hit all 5 price targets from Friday alert. I left early so only got a piece of it. Alert- Long 67.73 scalp intra on FX $USOIL $WTI with 67.43 stop. PT 68.49. Trim at and add over res 67.85 68.07 68.14 @OilAlerts_CT

EPIC on fire, not quite 100% win rate, but close. Oil hit all 5 price targets from Friday alert. I left early so only got a piece of it. Alert- Long 67.73 scalp intra on FX $USOIL $WTI with 67.43 stop. PT 68.49. Trim at and add over res 67.85 68.07 68.14 @OilAlerts_CT pic.twitter.com/PJuxQw9nqZ

— Melonopoly (@curtmelonopoly) April 22, 2018

Oil hit all 5 price targets from Friday alert. I left early so only got a piece of it.

Oil, alert
Oil hit all 5 price targets from Friday alert. I left early so only got a piece of it.

Just noticed I accidentally put the short side trade alert on my personal twitter feed https://twitter.com/curtmelonopoly/status/986147196658647040 … “Oil short side bias trade setup intra trading 66.47 with 66.20 target expiring btwn 230 and 630 AM ET. Tight stop SS initial alert. Unclear at this point.”

https://twitter.com/OilAlerts_CT/status/986152086806192128

Trading 66.30 from 66.47 entry nearing 66.20 SS target – trim short bias

https://twitter.com/OilAlerts_CT/status/986151044949381121

Trading 66.24 cover trim on way to target

https://twitter.com/OilAlerts_CT/status/986156872729350144

There it is – 66.20 intra day short target reached – bias to all or near all cover here from 66.47 intra scalp alert.

https://twitter.com/OilAlerts_CT/status/986159824491696128

Oil, trade, set-up, alert
Oil short side trade intra set-up on watch at top of quad.

Per recent;

“Oil is very near a quad trading range support area (gray) and lower quad time cycle peak. $USOIL $WTI $CL_F $USO $UWT $DWT #OOTT”

https://twitter.com/OilAlerts_CT/status/981524847703490560

Fantastic #EIA trade near quad support, buy side steps in, first resistance hits, boom. Near perfect. $USOIL $WTI $CL_F $USO $UWT $DWT #OOTT

EIA, oil, report, trade
Fantastic #EIA trade near quad support, buy side steps in, first resistance hits, boom. Near perfect. $USOIL $WTI $CL_F $USO $UWT $DWT #OOTT

Oil is very near a quad trading range support area (gray) and lower quad time cycle peak. $USOIL $WTI $CL_F $USO $UWT $DWT #OOTT

oil, live, trade, alerts
Oil is very near a quad trading range support area (gray) and lower quad time cycle peak. $USOIL $WTI $CL_F $USO $UWT $DWT #OOTT

The alert detail as it was posted on feed. Short side trade alert. EPIC Oil Algorithm Chart Model FX $USOIL $WTI #OIL $USO $UWT $DWT $CL_F #OOTT #Algo

The alert detail as it was posted on feed. Short side trade alert. EPIC Oil Algorithm Chart Model FX $USOIL $WTI #OIL $USO $UWT $DWT $CL_F #OOTT #Algo pic.twitter.com/kTZZEvi9MX

— Melonopoly (@curtmelonopoly) March 22, 2018

Summary of short side trade alert. EPIC Oil Algorithm Chart Model FX $USOIL $WTI #OIL $USO $UWT $DWT $CL_F #OOTT #Algo https://www.tradingview.com/chart/USOIL/yi9JI683-Summary-of-short-side-trade-alert-EPIC-Oil-Algorithm-Chart-Model/ …

Summary of short side trade alert. EPIC Oil Algorithm Chart Model FX $USOIL $WTI #OIL $USO $UWT $DWT $CL_F #OOTT #Algo https://t.co/wOjTLdGph2 pic.twitter.com/GwCWlGMiR9

— Melonopoly (@curtmelonopoly) March 22, 2018

Recent Oil Algorithm Price Target Hits:

May 13 – Will update target hits section soon..

Perfect price target hit Wed 1030 as provided on weekend report. EPIC Oil Algorithm $USOIL $WTI #OIL $USO $UWT $DWT $CL_F #OOTT #Algo #EIA

Perfect price target hit Wed 1030 as provided on weekend report. EPIC Oil Algorithm $USOIL $WTI #OIL $USO $UWT $DWT $CL_F #OOTT #Algo #EIA

Trade moving in to Wed 1030 PT as provided on weekend report. EPIC Oil Algorithm $USOIL $WTI #OIL $USO $UWT $DWT $CL_F #OOTT #Algo

Trade moving in to Wed 1030 PT as provided on weekend report. EPIC Oil Algorithm $USOIL $WTI #OIL $USO $UWT $DWT $CL_F #OOTT #Algo

Trade fell in to Tues 430 price target (early) and on track to Wed 1030 PT as provided on weekend report. EPIC Oil Algorithm $USOIL $WTI #OIL $USO $UWT $DWT $CL_F #OOTT #Algo

Trade fell in to Tues 430 price target (early) and on track to Wed 1030 PT as provided on weekend report. EPIC Oil Algorithm $USOIL $WTI #OIL $USO $UWT $DWT $CL_F #OOTT #Algo

Keep in mind that there are three price targets per week for down channel and up channel scenarios. Below are examples of targets hit to upside channel or down channel.

Price target hit for Tues 1030 #EIA as provided on weekend report. EPIC Oil Algorithm $USOIL $WTI #OIL $USO $UWT $DWT $CL_F #OOTT #Algo

EPIC, oil, algorithm, price, targets
Price target hit for Tues 1030 #EIA as provided on weekend report. EPIC Oil Algorithm $USOIL $WTI #OIL $USO $UWT $DWT $CL_F #OOTT #Algo

Tues 430 price target hit as provided on weekend report. EPIC Oil Algorithm $USOIL $WTI #OIL #OOTT $UWT $DWT $USO

Price target, hit, EPIC, oil, Algorithm
Tues 430 price target hit as provided on weekend report. EPIC Oil Algorithm $USOIL $WTI #OIL #OOTT $UWT $DWT $USO

Tues Mar 13 430 #OIL perfect hit to price predict target as provided on prior wknd report. EPIC Oil Algorithm Chart FX $USOIL $WTI $USO $UWT $DWT $CL_F #OOTT #Algo

OIL, Algorithm, EPIC, price target
Tues Mar 13 430 #OIL perfect hit to price predict target as provided on prior wknd report. EPIC Oil Algorithm Chart FX $USOIL $WTI $USO $UWT $DWT $CL_F #OOTT #Algo

Wed 1030 Mar 14 #EIA #OIL perfect hit to price predict target as provided on prior wknd report. EPIC Oil Algorithm Chart FX $USOIL $WTI $USO $UWT $DWT $CL_F #OOTT #Algo

Oil, Algorithm, price, target, $WTI, USOIL
Wed 1030 Mar 14 #EIA #OIL perfect hit to price predict target as provided on prior wknd report. EPIC Oil Algorithm Chart FX $USOIL $WTI $USO $UWT $DWT $CL_F #OOTT #Algo

Per recent;

Tues Mar 6 price target perfect hit to minute and penny as provided on prior weekend report. EPIC Oil Algorithm Chart FX $USOIL $WTI #OIL $USO $UWT $DWT $CL_F #OOTT #Algo

Private Member Server Screen shot of #EIA #OIL targets in play from wknd report. EPIC Oil Algorithm Chart FX $USOIL $WTI $USO $UWT $DWT $CL_F #OOTT #Algo

Private Member Server Screen shot of #EIA #OIL targets in play from wknd report. EPIC Oil Algorithm Chart FX $USOIL $WTI $USO $UWT $DWT $CL_F #OOTT #Algo

#EIA #OIL price target in play as provided on wknd report (Tues hit perfect). EPIC Oil Algorithm Chart FX $USOIL $WTI $USO $UWT $DWT $CL_F #OOTT #Algo

#EIA #OIL price target in play as provided on wknd report (Tues hit perfect). EPIC Oil Algorithm Chart FX $USOIL $WTI $USO $UWT $DWT $CL_F #OOTT #Algo

#EIA #OIL upper price target touch only and dumped in to lower target as provided on prior wknd report . EPIC Oil Algorithm Chart FX $USOIL $WTI $USO $UWT $DWT $CL_F #OOTT #Algo

#EIA #OIL upper price target touch only and dumped in to lower target as provided on prior wknd report . EPIC Oil Algorithm Chart FX $USOIL $WTI $USO $UWT $DWT $CL_F #OOTT #Algo

#EIA #OIL in to lower target as provided on prior wknd report . EPIC Oil Algorithm Chart FX $USOIL $WTI $USO $UWT $DWT $CL_F #OOTT #Algo

#EIA #OIL in to lower target as provided on prior wknd report . EPIC Oil Algorithm Chart FX $USOIL $WTI $USO $UWT $DWT $CL_F #OOTT #Algo

Screen shot of price and time target hit as provided on report 5 days prior. EPIC Oil Algorithm FX $USOIL $WTI #OIL $USO $UWT $DWT $CL_F #OOTT #Algo

oil, algorithm, price, target, EPIC
Screen shot of price and time target hit as provided on report 5 days prior. EPIC Oil Algorithm FX $USOIL $WTI #OIL $USO $UWT $DWT $CL_F #OOTT #Algo

Wed #EIA 1030 Feb 28 perfect hit to target at exact cent and minute as provided on weekend report. EPIC Oil Algorithm FX $USOIL $WTI #OIL $USO $UWT $DWT $CL_F #OOTT #Algo

oil, algorithm, EIA, price, target
Wed #EIA 1030 Feb 28 perfect hit to target at exact cent and minute as provided on weekend report. EPIC Oil Algorithm FX $USOIL $WTI #OIL $USO $UWT $DWT $CL_F #OOTT #Algo

Tues 430 Feb 27 price time target perfect hit as provided on weekend report. EPIC Oil Algorithm FX $USOIL $WTI #OIL $USO $UWT $DWT $CL_F #OOTT #Algo

$WTI, $USOIL, Algorithm, target
Tues 430 Feb 27 price time target perfect hit as provided on weekend report. EPIC Oil Algorithm FX $USOIL $WTI #OIL $USO $UWT $DWT $CL_F #OOTT #Algo

Fri Feb 23 price time target perfect hit as provided on report 5 days prior. EPIC Oil Algorithm FX $USOIL $WTI #OIL $USO $UWT $DWT $CL_F #OOTT #Algo

oil, algorithm
Fri Feb 23 price time target perfect hit as provided on report 5 days prior. EPIC Oil Algorithm FX $USOIL $WTI #OIL $USO $UWT $DWT $CL_F #OOTT #Algo

Per recent;

Oil Wed 1030 AM EIA report price target perfect hit, as provided on weekend report. EPIC Oil Algorithm Chart FX $USOIL $WTI #OIL $USO $UWT $DWT $CL_F #OOTT #Algo

Wed, Algorithm, Price, Target, USOIL, WTI
Oil Wed 1030 AM EIA report price target perfect hit, as provided on weekend report. EPIC Oil Algorithm Chart FX $USOIL $WTI #OIL $USO $UWT $DWT $CL_F #OOTT #Algo

Oil Intra-Day Algo Trading Quadrants (white dotted lines):

Trading quadrants are simply support and resistance lines that can assist your intra-day trading – they are not alpha or primary support and resistance by any measure. Price action does however typically move more assertively when leaving a trading quadrant.

Indicator Methods:

As explained above, my algorithm is a consideration of up to fifty traditional indicators at any one time – each one given its own weight in accordance to its accuracy (win rate). This is how we establish the probability of specific targets hitting (we call them alpha algo targets).

Alpha Algo Targets, Algo Trend-lines, Algo Timing, Quadrants for Intra Snipes

Algo targets are the red circles – they correspond with important times each week in oil reporting land. Tuesday 4:30 PM, Wednesday 10:30 AM and Friday at 1:00 PM. The red dotted diagonal lines are the algo trend-lines. And the vertical dotted (red or green) are marking the important times each week. You will find that the price of crude will hit one of the alpha algo targets about 90% of the time. In the absence of market direction the machines take price to the next algo line and/or target. Understanding how the price of crude reacts to the algos and how they move price from target to target is critical for intra-day and swing trading crude oil and associated instruments.

You will notice that price action of crude will use these algo trend-lines and act as support and resistance, and that price also often violently moves when an alpha algo line is breached either upward or downward.

We cover this in much more detail in the member updates, trading room. A review of my Twitter feed and previous blog posts will help you understand the relation of these indicators. We will start posting video blogs (for my subscribers) on YouTube (in addition to my daily blog posts) for swing traders that work during regular trading hours.

Also… we will cover how to establish algo trend-lines and price targets future forward (as you have seen me do on my Twitter feed for some time now).

Conclusion:

See you in the live trade room! And again, if you struggle to know how to use these indicators as a trader’s edge, it is recommended (if you have earnestly reviewed all of our documentation first) that you obtain private coaching prior to trading a real account with real money – we recommend you use a paper trading account at first.

You can also send specific questions to our email inbox at info@compoundtrading.com – if you do this be sure to ask a specific question so it can be answered specifically. When the 24 hour oil trading room opens you will have ample opportunity in that 24 hour room to ask questions also.

Subscribe:

Temporary Discount Offers (for new member only).

30% off Oil Trading Newsletter: Use Promo Coupon Code “epic30” When Subscribing to Weekly Newsletter (regular 299.00, 209.30 with discount) here: https://compoundtrading.com/product/standalone-epic-newsletter/ (cancel anytime, for new members only to trial the service).

30% off Oil Trading Alerts: Use Promo Coupon Code “oilalerts30” for Real-Time Oil Trade Alerts via Private Twitter Feed @OilAlerts_CT (regular 199.00, 139.30 with discount) here: https://compoundtrading.com/product/live-oil-trading-alerts/?attribute_plan=One+Month (cancel anytime, for new members only to trial the service).

30% off Oil Trading Bundle: (Weekly Newsletter, Trading Alerts, Private Discord Oil Chat Room): Use Promo Coupon Code “epic30” for the Oil Trading Bundle (regular 399.00, 279.30 with discount) here: https://compoundtrading.com/product/fx-usoil-epic-oil-algorithm/

Click here to find all information and pricing on Oil Newsletter, Trading Chat Room, Oil Alerts and more.

Connect:

Register to free email list for trade set-ups, webinars, special events: https://compoundtrading.com/contact/

Website: https://compoundtrading.com

Blog: https://compoundtrading.com/blog/

Free chat room: https://discord.gg/2HRTk6n

Subscribe: https://compoundtrading.com/overview-…

Twitter: https://twitter.com/CompoundTrading

Lead Trader: https://twitter.com/curtmelonopoly

Tradingview: https://www.tradingview.com/u/curtmel…

Facebook: https://www.facebook.com/compoundtrad…

StockTwits: https://stocktwits.com/compoundtrading

Email: https://info@compoundtrading.com

Tweets by EPICtheAlgo

PS If you are not yet reviewing the daily post market trading results blog posts, please do so, they are on the blog daily and often there is information that also may assist your trading. Trade room transcripts (for example) may review topics pertinent to your trading.

Article topics: EPIC, Oil, Trading Room, Crude, $USOIL, $WTI, $USO, $UCO, $CL_F, $UWT, $DWT, Chart, Algorithm

Read More
Freedom S&P 500 $SPY Algorithm Chart Model Update Fri May 11 $ES_F $SPXL, $SPXS

Freedom S&P 500 $SPY Algorithm Chart Model Update Fri May 11 $ES_F $SPXL, $SPXS

May 11, 2018December 30, 2018 FREEDOM SPYSP500 (SPY) Algorithm$ES_F, $SPXL, $SPXS, Algorithm, Chart, Freedom, Model, SPY

S&P 500 $SPY Algorithm Update Friday May 11, 2018 $ES_F ($SPXL, $SPXS) Chart Observations

My name is Freedom the $SPY Algo. Welcome to my new S&P 500 trade report for Compound Trading.

Below you will find algorithmic model charting based on Fibonacci extensions, timing and various other principles. This is a very early stage development model (generation 2 – 5 modeling rolls out in 2018 and as a result the reporting frequency increase significantly – our more advanced algorithm chart models are 4th and 5th generation, such as EPIC the Oil Algo that is graduating to #IA coding).

Notices:

May 11 – Our apologies the reporting was late this week – we had trade coaching events and the new coding office set-up. Next week will be on schedule.

How to use this charting model:

The S & P 500 model is different than others we have in development in that it functions on a number of time-cycles or time-frames, as such, you will see on some reporting a series of time-frames. This report includes a 1 minute model and a 60 minute model with buy sell triggers and reports in near future will include other time-frames for different styles / time-frames of trade.

The simplest way to use the charting is to consider all lines support and resistance decisions with the horizontal grey lines (marked with grey arrows) to be significant trading ranges in the model. The thicker the line the more important. And please consider that all support and resistance lines are approximate as this is a working chart model (a work-sheet). Horizontal and diagonal dotted lines are consider support and resistance.

This chart model is best weighed against conventional charting and used in conjunction with a conventional chart.

If you have questions about the best use of the chart model or private coaching options email our developers anytime at info@compoundtrading.com.

$SPY Algorithm – 1 Minute Charting (Intra-Day):

When you open the live chart below in “viewer” mode you can then click on the share button at bottom right and then click on “make it mine” to open real-time chart. Double click the body of the chart to remove or institute indicators at bottom of chart (MACD, Stoch RSI, SQZMOM).

$SPY 1 Min model with current trading range buy sell triggers, fibs, quads, moving averages May 11 654 AM $SPXL $SPXS

https://www.tradingview.com/chart/SPY/XG8QFXjm-SPY-1-Min-model-with-current-trading-range-buy-sell-triggers-f/

$SPY, algorithm
$SPY 1 Min model with current trading range buy sell triggers, fibs, quads, moving averages May 11 654 AM $SPXL $SPXS

Per recent;

$SPY 1 Min model with current trading range buy sell triggers, fibs, quads, moving averages Apr 30 140 AM $SPXL $SPXS

https://www.tradingview.com/chart/SPY/cRFHocGS-SPY-1-Min-model-with-current-trading-range-buy-sell-triggers-f/

$SPY, chart, model, 1 min
$SPY 1 Min model with current trading range buy sell triggers, fibs, quads, moving averages Apr 30 140 AM $SPXL $SPXS

Per recent;

$SPY 1 Min model with current trading range buy sell triggers, fibs, quads, moving averages Apr 23 246 AM $SPXL $SPXS

https://www.tradingview.com/chart/SPY/zAc9rTLP-SPY-1-Min-model-with-current-trading-range-buy-sell-triggers-f/

$SPY, algorithm, chart
$SPY 1 Min model with current trading range buy sell triggers, fibs, quads, moving averages Apr 23 246 AM $SPXL $SPXS

Current Buy / Sell Triggers for $SPY SP500:

292.29

290.70

289.15

287.58

286.00

284.45

282.88

281.30

279.74

278.17

276.61

275.02

273.46

271.89

270.33

268.75

267.20

265.62

264.04

262.47

260.92

259.37

257.80

256.20

254.64

$SPY Algorithm Model – 60 Minute Charting (Swing Trading):

$SPY 60 Min model 700 AM May 11. Channels, quads, price targets, horizontal Fib support resistance buy sell triggers. $ES_F $SPXL $SPXS

https://www.tradingview.com/chart/SPY/yyPMMSvg-SPY-60-Min-model-700-AM-May-11-Channels-quads-price-targets/

$SPY, 60 Min, Chart, Algorithm
$SPY 60 Min model 700 AM May 11. Channels, quads, price targets, horizontal Fib support resistance buy sell triggers. $ES_F $SPXL $SPXS

Per recent;

$SPY 60 minute chart model with possible up and down trend channels, quads, price targets, horizontal Fib support / resistance.

https://www.tradingview.com/chart/SPY/HYWf7Puw-SPY-60-minute-chart-model-with-possible-up-and-down-trend-chann/

$SPY, 60 Min, chart, channels
$SPY 60 minute chart model with possible up and down trend channels.

Per recent;

$SPY 60 Min model working well for swing trading.

https://www.tradingview.com/chart/SPY/U4iGOM7n-SPY-60-Min-model-working-well-for-swing-trading/

$SPY, 60 Min, chart, model
$SPY 60 Min model working well for swing trading.

$SPY The early April wash-out snap back chart structure we nailed with this model. #swingtrading

$SPY, wash-out, swing trade
$SPY The early April wash-out snap back chart structure we nailed with this model. #swingtrading

Wider view of the structure of the 60 minute model for swing trading. Trade over 200 MA. $SPY $SPXL $SPXS $ES_F

https://www.tradingview.com/chart/SPY/uBBvU8Ep-Wider-view-of-the-structure-of-the-60-minute-model-for-swing-tra/

$SPY, 60 min, chart, 200 MA
Wider view of the structure of the 60 minute model for swing trading. Trade over 200 MA. $SPY $SPXL $SPXS $ES_F


$SPY Conventional Charting Considerations:

$SPY Daily Chart, ending week bullish with MACD turned up, price above MA’s and 20 MA about to cross. $ES_F $SPXL $SPXS

https://www.tradingview.com/chart/SPY/KC1VIKBi-SPY-Daily-Chart-ending-week-bullish-with-MACD-turned-up-price/

$SPY, conventional, Daily, Chart
$SPY Daily Chart, ending week bullish with MACD turned up, price above MA’s and 20 MA about to cross. $ES_F $SPXL $SPXS

Per recent;

$SPY ended week under 50 MA (bearish) and MACD flat.

$SPY, MACD, 200MA
$SPY ended week under 50 MA (bearish) and MACD flat.

Per recent;

$SPY ended week under 50 MA (bearish) however, MACD is still trending up and earnings season in full swing. Indecisive.

https://www.tradingview.com/chart/SPY/V3A76XiP-SPY-ended-week-under-50-MA-bearish-however-MACD-is-still-tre/

$SPY, daily, chart, MACD, 50 MA
$SPY ended week under 50 MA (bearish) however, MACD is still trending up and earnings season in full swing.


Recent Real-Time Alerts, Trading, Model Price Target hits etc.

May 11 – Next report when there is more time I will update the most recent alert and price target examples.

Per recent;

9:56 AM – 19 Apr 2018 $SPY Divergent trade returning to target area it tried to pass in the fast lane. See previous recent posts.

$SPY Divergent trade returning to target area it tried to pass in the fast lane. See previous recent posts. pic.twitter.com/3vo4sgNXKH

— Melonopoly (@curtmelonopoly) April 19, 2018

$SPY, divergent, trade, alert
$SPY Divergent trade returning to target area it tried to pass in the fast lane. See previous posts..png

5:18 AM – 18 Apr 2018 That 273.20 mark that comes due in a time cycle peak for $SPY at around 2:00 EST today…. that’s the start of a double extension getting really stretched on the models – corresponds with everything that moved. There ain’t much room available above that short term. Rest on deck.

That 273.20 mark that comes due in a time cycle peak for $SPY at around 2:00 EST today…. that's the start of a double extension getting really stretched on the models – corresponds with everything that moved. There ain't much room available above that short term. Rest on deck. pic.twitter.com/wKfBQ9njDc

— Melonopoly (@curtmelonopoly) April 18, 2018

4:48 AM – 18 Apr 2018 $SPY long side trade cleared mid quad and quad wall. Closed 270.19, next res trims 270.22, 270.45, 271.99, 273.25

https://twitter.com/SwingAlerts_CT/status/986526884790927360

$SPY, trade, alert, chart
$SPY long side trade cleared mid quad and quad wall. Closed 270.19, next res trims 270.22, 270.45, 271.99, 273.25

3:37 PM – 13 Apr 2018 The resistance dump after the alert and the 50 MA support may become your buy area Mon morning. $SPY #swingtrading https://www.tradingview.com/chart/SPY/H375XWXb-The-resistance-dump-after-the-alert-and-the-50-MA-support-may-be/ …

https://twitter.com/SwingAlerts_CT/status/984878380284858369

$SPY, alert, feed
The resistance dump after the alert and the 50 MA support may become your buy area Mon morning. $SPY #swingtrading.png

11:05 AM – 13 Apr 2018 $SPY trim quad resistance alert worked well.

https://twitter.com/SwingAlerts_CT/status/984809783768346624

$SPY, trading, alert
$SPY trim quad resistance alert worked well.

9:31 AM – 13 Apr 2018 $SPY upside resistance trim alert to long side as it approaches 268.00 mid quad res

https://twitter.com/SwingAlerts_CT/status/984786277189988352

$SPY, twitter, alert
$SPY upside resistance trim alert to long side as it approaches 268.00 mid quad res

$SPY at upside resistance pivot and structured trade worked out. Trim longs add above.

https://www.tradingview.com/chart/SPY/JbhGvFKm-SPY-at-upside-resistance-pivot-and-structured-trade-worked-out/

$SPY, upside resistance
$SPY at upside resistance pivot and structured trade worked out. Trim longs add above.

$SPY building structure near the buy trigger and channel bottom we expected. It’s long while it holds area. Trading 261.23 intra day.

https://twitter.com/SwingAlerts_CT/status/981571557771350018

https://www.tradingview.com/chart/SPY/hmAGDbrc-SPY-building-structure-near-the-buy-trigger-and-channel-bottom/

$SPY, chart, structure
$SPY building structure near the buy trigger and channel bottom we expected. It’s long while it holds area.

$SPY Time cycle peak on this simple model is now. If its going to follow channel up it will be soon that it starts. If not, it could be another channel down yet.

https://www.tradingview.com/chart/SPY/IDiDMAVs-SPY-Time-cycle-peak-on-this-simple-model-is-now-If-its-going-t/ …

https://twitter.com/DayAlerts_CT/status/978990333278253056/photo/1pic.twitter.com/50zcoPctuv

$SPY, timecycle, charting
$SPY Time cycle peak on this simple model is now. If its going to follow channel up it will be soon that it starts.

Best with your trades and look forward to seeing you in the room!

Freedom the $SPY Algo

Tweets by FREEDOMtheAlgo

Article Topics: Freedom, Algorithm, Chart, Model, $SPY, $ES_F, $SPXL, $SPXS

Read More

Posts navigation

Older posts
Newer posts
Proudly powered by WordPress | Theme: sharksdesign by reviewexchanger.
 

Loading Comments...