Skip to content

Compound Trading Group

  • About
  • White Paper
  • Returns
  • News
    • NOTICE of Online Information Meetings
  • Order
    • Terms
  • About
  • White Paper
  • Returns
  • News
    • NOTICE of Online Information Meetings
  • Order
    • Terms

Yearly Archives: 2018

  1.   »  
  2. Yearly Archives: 2018

Year: 2018

Bitcoin / Crypto Algorithm Model(s) Mon May 21 $BTC $XBTUSD $XBT $ETH $LTC $XRP #Bitcoin #Crypto

Bitcoin / Crypto Algorithm Model(s) Mon May 21 $BTC $XBTUSD $XBT $ETH $LTC $XRP #Bitcoin #Crypto

May 21, 2018August 11, 2018 Crypto the AlgoBitcoin (BTC) Algorithm (Crypto)$BTC, $BTC.X, $BTCUSD, $ETH, $LTC, $XBTUSD, $XRP, Algorithm, BITCOIN, Chart, Crypto, price targets, time cycles, Trade

Crypto the Bitcoin Algorithm Charting Model Newsletter including Specific Time Cycle Price Targets and Buy / Sell Triggers Monday May 21, 2018.

Charts for $BTC $BTCUSD $XBTUSD $XBT $BTC.X $ETH $LTC $XRP #Bitcoin #Crypto

Hello! My name is Crypto the Bitcoin Algo. Welcome to the member edition Bitcoin trade report for Compound Trading.

Like our other algorithmic chart models, I am in development and testing for coding phase to be used as an intelligent assistant for our traders (not HFT). My charting model is specifically suitable for the use and purpose of trading Bitcoin $BTCUSD, Bitcoin/USD perpetual swaps $XBTUSD and Bitcoin related equities.

Note: The $XBTUSD (Bitcoin swaps) model is built on a chart from BitMEX. Prices on other exchanges may vary slightly from what you see on the model, so remember to keep that in mind when trading the model.

Notices: 

  • Our 24 hour crypto trading desk was launched May 15. This team of three is also responsible for the development and coding of our algorithms and alerting to realtime Twitter alert feeds. Read more here; https://compoundtrading.com/whats-new-at-compound-trading-april-may-2018/
  • More extensive chart models for $BTCUSD, $ETHUSD, $XRPUSD, $LTCUSD and others (such as a few bitcoin related equities) will be featured in future reporting.
  • Join us in our private Crypto Trading room on discord!
  • For newer users – read the blog post about how to trade Bitcoin here.

Primary Methods of Bitcoin Trade: 

The primary method of trade we have found works with the most predictability is to wait for bitcoin to breach the upper right wall of a quadrant (the orange, blue or grey diagonal dotted lines – the thicker lines are more significant as they represent wider time-frames) and confirm over the next horizontal Fibonacci resistance. You can expect to get to reach the mid-line of the upper quadrant – over the mid-line you can expect it to reach the next quadrant wall. Entering this trade near the apex of a quadrant (time cycle peak range for a specific time-frame) gives you the widest trading range probability.

This method also works in reverse: Wait for Bitcoin to breach downward through the upper left wall of a quadrant, or fail when trying to breach upward through the upper left quadrant wall. Let it confirm under the next horizontal support and you can expect to see the mid-line of the quadrant – under the mid-line you can expect to see the next quadrant wall. Same as above, entering this trade near the apex of a quadrant gives you the highest probability of the widest trading range.

Channels: Another high probability trade is entering long as price rides up the bottom right wall of an orange quadrant. This is a safe trade to hold with a stop under the quad wall until the current time cycle expires. This trade works in reverse as well. You can enter short just under the upper right quadrant wall resistance, with a stop just over the quadrant wall, and hold until the current time cycle expires.

Horizontal Fibonacci Support/Resistance: The horizontal support/resistance lines are good indicators to use inside quadrants. The light green 0.5 Fibonacci line and the grey 1.0 or 0 Fibonacci levels (mid-lines) are the most significant. Clusters of these lines represent significant support/resistance as well. Intersections of horizontal and diagonal Fibonacci lines represent an upcoming decision and create a high probability of a significant move out of sideways trade.

Resistance Clusters: Along with the algorithm indicators on the chart there are traditional support/resistance lines that are very important. When these lines converge volatility tends to increase. Under the cluster is a high probability short. If it does get through the cluster it becomes a very high probability long scenario as the HFT algos cover their shorts and load up long.

Targets: Red circles on charting. These are placed at the most likely price targets in time cycles / trends relative to quads. These are still in very early stage of development/testing and should be used for observation only at this point. Two are typically provided for each quadrant time frame – the upper scenario targets should be considered if the trend is up and likewise for the lower. I do not recommend entering trades based on these targets. Also, at times the mid quad support / resistance line is highlighted with a target if trade is not extremely bullish or bearish.

Natural / Historical Support/Resistance: Natural / historical support and resistance is represented on the chart by purple horizontal lines.

Conventional Charting: Conventional charting should be weighed against the model(s) with all trade decisions.

In summary, our first generation Bitcoin algorithm chart model uses the following indicators (listed from most predictable to least in terms of win rate): 

  1. Trading range created by long term algorithmic modeled quadrant support and resistance (blue dotted lines)
  2. Trading range between buy/sell trigger levels (grey/green arrows and solid lines)
  3. Directional channels formed by long term algorithmic modeled support and resistance
  4. Horizontal Fibonacci support and resistance (multi-colored horizontal lines)
  5. Conventional Natural support and resistance (purple horizontal lines)
  6. Long term conventional trend lines (red diagonal lines)
  7. Conventional MA’s 

Bitcoin Algorithm (Daily Chart – Swing Trading):

Click link to open initial chart viewer screen, then share button at bottom right of screen, then make it mine, then double click on chart body to hide or reveal indicators at bottom of chart (MACD etc).

Algorithm Model on the Daily Bitcoin Chart: 

Bitcoin Daily Chart is still in uptrend. Recent price action sideways however. 507 AM May 21 2018 $BTC $XBTUSD #Bitcoin

https://www.tradingview.com/chart/XBTUSD/Q7zdk1DI-Bitcoin-Daily-Chart-is-still-in-uptrend-Recent-price-action-sid/

Price Targets on Daily Chart Model:

Trading 8515.00 intraday;

May 21 Bitcoin Price Targets:

Bearish 5824.00

Moderate 9808.00

Bullish 13821.00

July 4 Bitcoin Price Targets:

Bearish 9808.00

Moderate 13821.00

Bullish 17745.00

Bitcoin, daily, chart, algorithm, $BTC, $XBTUSD
Bitcoin Daily Chart is still in uptrend. 50 MA tested as support. Price targets are in play. May 13 2018 $BTC $XBTUSD #Bitcoin

Observations / Chart Indicators: Trading Plan for Current Area of Bitcoin Trade:

May 21 – Trade is in sideways action recently but still in uptrend channel.

Per recent;

May 13 – The mid channel quad (horizontal fib) held price down and a retrace occurred.

The Bitcoin daily chart is still in the uptrend channel. Trading under the mid channel line (green dotted), so it is likely to near the bottom of the uptrending channel (yellow line arrow). But not likely to hit it perfectly as it is in an uptrend. It is likely to continue up prior to trade hitting the bottom of the channel. The opposite is true in down trends.

When price dumped it cradled in the 50 MA and bounced. Before a return to the bottom of the channel (per above paragraph) it is probable that trade will stay bullish in to that target in the 9808.00 region on May 21, this is a decent return considering intra-day trade at 8645.00 today. However, if price is lost to the downside of the 50 MA then a target hit is unlikely.

Those are your probabilities and my personal trading plan specific to the day model.

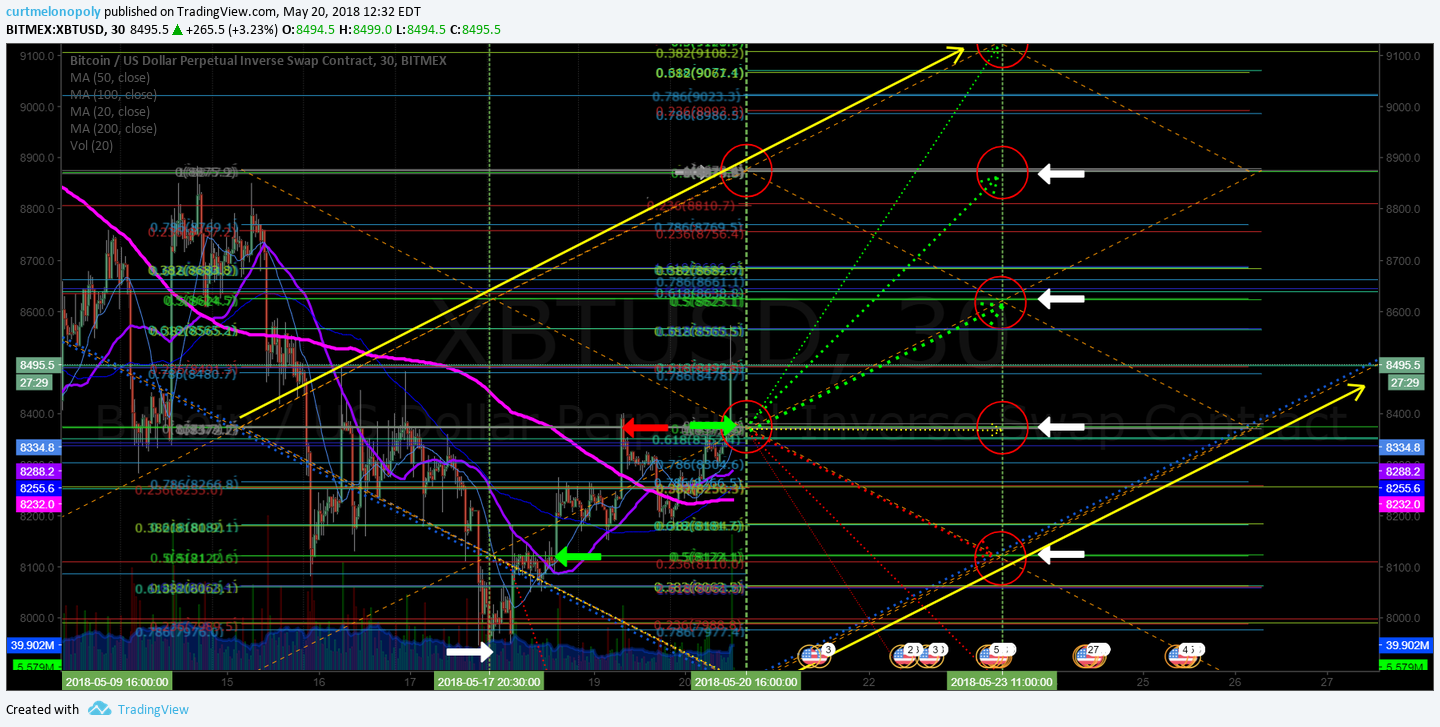
Daytrading Bitcoin – 30 Minute Charting

May 21 Price Targets:

Most bullish 9867.60 

Moderate Bullish 8869.30

Bearish 7879.30

Most Bearish 6046.00

May 21 Daytrading 30 Min Chart that our machine trading team is using intra. $BTC $XBTUSD #bitcoin #crypto #trading

Bitcoin, algorithm, machine trading, $BTC
Bitcoin Daytrading 30 Min Chart that our machine trading team is using intra. $BTC $XBTUSD #bitcoin #crypto #trading

Per recent;

Bitcoin trade needs the 200 MA that’s overhead and 8873.00 mid quad to get higher short term. 130PM May 13 2018 $BTC $XBTUSD #Bitcoin

https://www.tradingview.com/chart/XBTUSD/KTRK3ywy-Bitcoin-trade-needs-the-200-MA-that-s-overhead-and-8873-00-mid-q/

Bitcoin, trade, $BTC, $XBTUSD, daytraading, algorithm
Bitcoin trade needs the 200 MA that’s overhead and 8873.00 mid quad to get higher short term. 130PM May 13 2018 $BTC $XBTUSD #Bitcoin

Per recent;

May 10 – Bitcoin daytrading model on 30 minute chart. Near 200 MA breach intraday. $BTC $XBTUSD #Bitcoin

https://www.tradingview.com/chart/XBTUSD/h4FNmwVs-Bitcoin-daytrading-model-on-30-minute-chart-Near-200-MA-breach/

$BTC, daytrading, algorithm, chart
Bitcoin daytrading model on 30 minute chart. Near 200 MA breach intraday. $BTC $XBTUSD #Bitcoin

Per recent;

April 29 – Most bullish price target 9867.00 April 28 scenario didn’t quite hit… next time cycle Bitcoin daytrading model $BTC $XBTUSD #Bitcoin

https://www.tradingview.com/chart/XBTUSD/6VN69FR6-Most-bullish-price-target-9867-00-May-28-scenario-didn-t-quite-h/

Bitcoin, daytrading, model
Most bullish price target 9867.00 May 28 scenario didn’t quite hit… next time cycle Bitcoin daytrading model $BTC $XBTUSD #Bitcoin

Recent Bitcoin Real-Time Trade Alerts / Charting Set-up Alerts

If you are reviewing this newsletter (as a historical unlocked post) and not a member of our service and would like a tour of our private discord server (trading chat / alerts etc) or our private Twitter member $BTC alert feed let us know. You can check out our call rate for yourself. Transparent trading is important to us.

May 21 – I will update recent alerts soon.

Intra bottom call. White arrow – alert sent. Green arrow – buy trigger. Red arrow – resistance (mid quad) on chart per alert sent. $BTC $XTUSD #Bitcoin #Cryptotrading

Intra bottom call. White arrow – alert sent. Green arrow – buy trigger. Red arrow – resistance (mid quad) on chart per alert sent. $BTC $XTUSD #Bitcoin #Cryptotrading pic.twitter.com/RM68yktgur

— Melonopoly (@curtmelonopoly) May 20, 2018

May 13 – Will post recent alerts soon when time allows.

Per recent;

April 29 – There have been many calls since bottom on our private server and private twitter feed… I’m not going to take the time to post them here right now but I will post this rant of tweets… the private member alerts I’ll post next report if time (they were all spot on alerts).

I even told ya how I knew where the bottom was. $BTC #Bitcoin #algorithm

I even told ya how I knew where the bottom was. $BTC #Bitcoin #algorithm

Next should be insane trading in crypto space. Could be wrong… but I’m feelin it. #crypto $BTC $XBT $ETH $LTC #trading screenshot

Next should be insane trading in crypto space. Could be wrong… but I’m feelin it. #crypto $BTC $XBT $ETH $LTC #trading screenshot

Next should be insane trading in crypto space. Could be wrong… but I’m feelin it. #crypto $BTC $XBT $ETH $LTC #trading

Next should be insane trading in crypto space. Could be wrong… but I’m feelin it. #crypto $BTC $XBT $ETH $LTC #trading

$BTC near HOD and some bullish action on intra. Tweet screen shot.

$BTC near HOD and some bullish action on intra. Tweet screen shot.

$BTC near HOD and some bullish action on intra. $BTC #bitcoin #calls

$BTC near HOD and some bullish action on intra. $BTC #bitcoin #calls

Technical precision trading. Price target hit perfect on daytrading algorithm model charting. $BTC $XBT #Bitcoin #Crypto #Trading

Bitcoin, price, target, hit, alert
Technical precision trading. Price target hit perfect on daytrading algorithm model charting. $BTC $XBT #Bitcoin #Crypto #Trading

Technical precision trading. Price target hit perfect on daytrading algorithm model charting. $BTC $XBT #Bitcoin #Crypto #Trading pic.twitter.com/l1pafs56QD

— Crypto the BTC Algo (@CryptotheAlgo) April 18, 2018

Bitcoin coming in to a possible buy trigger zone on daytrading chart. $BTC #Bitcoin

https://twitter.com/BTCAlerts_CT/status/978317583987429376

Bitcoin, realtime, trade, alert
Bitcoin coming in to a possible buy trigger zone on daytrading chart. $BTC #Bitcoin

$BTC Bitcoin popped now 400 points since alert of support. Not a bad RR here for long test. If nothing else a day trade.

https://twitter.com/BTCAlerts_CT/status/978397655796801538

Bitcoin time price cycle peak coming April 7 – path of least resistance down target but my bias is to up. Trade price. We start trading live again Monday so I’ll broadcast our trading group moves live for this setup. $BTC #Bitcoin #trading #crypto (alerted in private member Discord server)

Bitcoin, trading, timecycle, chart
Bitcoin time price cycle peak coming April 7 – path of least resistance down target but my bias is to up. Trade price. $BTC #Bitcoin #trading #crypto.png

And the result…. price is dumping in to lower target identified on trade alert…. intrad-day getting close. Charting wins. Trader bias not so good on this one.

price tragets, Bitcoin
Bitcoin did dump in to down target.

Ethereum Basic Algorithm Charting Model on Daily Time Frame:

Ethereum Daily Chart – Uptrend channel in play. Buy sell triggers at white arrows. Has 200 MA. Quad test on deck. $ETH $ETHUSD

https://www.tradingview.com/chart/ETHUSD/uLkMwbKR-Ethereum-Daily-Chart-Uptrend-channel-in-play-Buy-sell-trigger/

$ETH, Ethereum, algorithm, chart
Ethereum Daily Chart – Uptrend channel in play. Buy sell triggers at white arrows. Has 200 MA. Quad test on deck. $ETH $ETHUSD

Per recent;

Ethereum Daily Chart – Bounced before mid quad – bulls are in – channel in play. Main buy sell triggers noted with white arrows. $ETH $ETHUSD

Ethereum continues to be one of the most structured daily charts on any market. Love it. Very predictable trade. #algorithm #models $ETHUSD #crypto $STUDY

Ethereum continues to be one of the most structured daily charts on any market. Love it. Very predictable trade. #algorithm #models $ETHUSD #crypto $STUDY

— Melonopoly (@curtmelonopoly) May 13, 2018

https://www.tradingview.com/chart/ETHUSD/9ohNQFqv-Ethereum-Daily-Chart-Bounced-before-mid-quad-bulls-are-in/

$ETHUSD, Ethereum, Algorithm
Ethereum Daily Chart – Bounced before mid quad – bulls are in – channel in play. Main buy sell triggers noted with white arrows. $ETH $ETHUSD

Per recent;

May 10 – Ethereum Daily Chart – One of my favs on any market. Channel working. Main buy sell triggers noted with white arrows. $ETH $ETHUSD

https://www.tradingview.com/chart/ETHUSD/OQA1VBrX-Ethereum-Daily-Chart-One-of-my-favs-on-any-market-Channel-wor/

$ETHUSD, $ETH, Daily, Chart, Algorithm
Ethereum Daily Chart – One of my favs on any market. Channel working. Main buy sell triggers noted with white arrows. $ETH $ETHUSD

Litecoin Basic Algorithm Charting Model

Primary buy sell triggers on Litecoin daily chart:

475.00

381.00

287.00

192.00

98.00

May 21 – No significant change in charting, use previous link below. It has lost the lower channel support, is significantly under 200 MA and bearish unless it regains at minimum lower channel support.

Litecoin still holding near bottom range of channel but it doesn’t look great – to be determined. May 13 147 PM $LTC $LTCUSD

https://www.tradingview.com/chart/LTCUSD/YTMcvadh-Litecoin-still-holding-near-bottom-range-of-channel-but-it-doesn/

$LTC, algorithm, Litecoin
Litecoin still holding near bottom range of channel but it doesn’t look great – to be determined. May 13 147 PM $LTC $LTCUSD

May 10 – Litecoin still running bottom of algorithmic channel charted long in advance of trade in that area. $LTC

https://www.tradingview.com/chart/LTCUSD/wh7zibon-Litecoin-still-running-bottom-of-algorithmic-channel-charted-lon/

$LTC, algorithm, chart
Litecoin still running bottom of algorithmic channel charted long in advance of trade in that area. $LTC

Ripple Basic Algorithm Charting Model $XRP

May 21 – No noteworthy change in charting – use link below.

May 13 – Ripple needs .932 for a chance for a bullish structured run. $XRP $XRPUSD.

https://www.tradingview.com/chart/XRPUSD/Bh8cPwbQ-Ripple-needs-932-for-a-chance-for-a-bullish-structured-run-XR/

I put some tighter time from Fib structure in the model for those that asked for daytrading signals.

$XRP. algorithm
Ripple needs .932 for a chance for a bullish structured run. $XRP $XRPUSD

Per recent;

May 10 – Nothing to report. Flat.

April 29 – $XRP flat but over 200 MA on daily.

BUT still great returns from 40s to near 90s WOW.

https://www.tradingview.com/chart/XRPUSD/0aDABOJz-XRP-flat-but-over-200-MA-on-daily/

$XRP flat but over 200 MA on daily.

Per recent;

April 22 – $XRP over .888 targets 1.31 then 1.65 mid term. Daytrading model on -deck. #ripple

https://www.tradingview.com/chart/XRPUSD/zIn8bXCj-XRP-over-888-targets1-31-then-1-65-mid-term-Daytrading-model/

$XRP, price targets, chart, Ripple
$XRP over .888 targets1.31 then 1.65 mid term. Daytrading model on -deck. #ripple

< End of report >

Any questions give us a shout anytime!

Follow Me:

Live Twitter Alert Feed for Bitcoin Trade Set-ups: @BTCAlerts_CT, Public Feed: @cryptothealgo

To Subscribe to our Crypto Services:

Link to Services and Pricing Overview (master list).

Link to Standalone $BTC Crypto Newsletter.

Link to Real-Time Live Bitcoin Alerts (Twitter).

Link to Crypto Bundle (Alerts, Private Trading Discord Server, Newsletter).

Review historical (unlocked to public) Weekly Bitcoin Newsletter Algorithm Reporting. Scroll down landing page to get to historical reports.

Post topics; Crypto, chart, $BTC, $BTCUSD, $XBTUSD, $BTC.X, $ETH, $LTC, $XRP, Bitcoin, trade, price targets, time cycles, algorithm

Read More
Freedom S&P 500 $SPY Algorithm Chart Model Update Mon May 21 $ES_F $SPXL, $SPXS

Freedom S&P 500 $SPY Algorithm Chart Model Update Mon May 21 $ES_F $SPXL, $SPXS

May 21, 2018December 30, 2018 FREEDOM SPYSP500 (SPY) Algorithm$ES_F, $SPXL, $SPXS, Algorithm, Chart, Freedom, Model, SPY

S&P 500 $SPY Algorithm Update Monday May 21, 2018 $ES_F ($SPXL, $SPXS) Chart Observations

My name is Freedom the $SPY Algo. Welcome to my new S&P 500 trade report for Compound Trading.

Below you will find algorithmic model charting based on Fibonacci extensions, timing and various other principles. This is a very early stage development model (generation 2 – 5 modeling rolls out in 2018 and as a result the reporting frequency increase significantly – our more advanced algorithm chart models are 4th and 5th generation, such as EPIC the Oil Algo that is graduating to #IA coding).

Notices:

NA

How to use this charting model:

The S & P 500 model is different than others we have in development in that it functions on a number of time-cycles or time-frames, as such, you will see on some reporting a series of time-frames. This report includes a 1 minute model and a 60 minute model with buy sell triggers and reports in near future will include other time-frames for different styles / time-frames of trade.

The simplest way to use the charting is to consider all lines support and resistance decisions with the horizontal grey lines (marked with grey arrows) to be significant trading ranges in the model. The thicker the line the more important. And please consider that all support and resistance lines are approximate as this is a working chart model (a work-sheet). Horizontal and diagonal dotted lines are consider support and resistance.

This chart model is best weighed against conventional charting and used in conjunction with a conventional chart.

If you have questions about the best use of the chart model or private coaching options email our developers anytime at info@compoundtrading.com.

$SPY Algorithm – 1 Minute Charting (Intra-Day):

Current Buy / Sell Triggers for $SPY SP500:

292.29

290.70

289.15

287.58

286.00

284.45

282.88

281.30

279.74

278.17

276.61

275.02

273.46

271.89

270.33

268.75

267.20

265.62

264.04

262.47

260.92

When you open the live chart below in “viewer” mode you can then click on the share button at bottom right and then click on “make it mine” to open real-time chart. Double click the body of the chart to remove or institute indicators at bottom of chart (MACD, Stoch RSI, SQZMOM).

$SPY 1 Min model with current trading range buy sell triggers, fibs, quads, moving averages May 21 428 AM $SPXL $SPXS

https://www.tradingview.com/chart/SPY/HKt9DUTQ-SPY-1-Min-model-with-current-trading-range-buy-sell-triggers-f/

$SPY, algorithm, charting
$SPY 1 Min model with current trading range buy sell triggers, fibs, quads, moving averages May 21 428 AM $SPXL $SPXS

Per recent;

$SPY 1 Min model with current trading range buy sell triggers, fibs, quads, moving averages May 13 28 PM $SPXL $SPXS

https://www.tradingview.com/chart/SPY/p6WJZ1fy-SPY-1-Min-model-with-current-trading-range-buy-sell-triggers-f/

$SPY, 1 Min, Algorithm
$SPY 1 Min model with current trading range buy sell triggers, fibs, quads, moving averages May 13 28 PM $SPXL $SPXS

Per recent;

$SPY 1 Min model with current trading range buy sell triggers, fibs, quads, moving averages May 11 654 AM $SPXL $SPXS

https://www.tradingview.com/chart/SPY/XG8QFXjm-SPY-1-Min-model-with-current-trading-range-buy-sell-triggers-f/

$SPY, algorithm
$SPY 1 Min model with current trading range buy sell triggers, fibs, quads, moving averages May 11 654 AM $SPXL $SPXS

$SPY Algorithm Model – 60 Minute Charting (Swing Trading):

$SPY 60 minute chart model with channels, Fibonacci, support, resistance, price targets, time cycles. May 21 440 AM $ES_F $SPXL $SPXS

https://www.tradingview.com/chart/SPY/5cWRewRa-SPY-60-minute-chart-model-with-channels-Fibonacci-support-re/

$SPY, 60 Min, Algorithm, chart
https://www.tradingview.com/chart/SPY/5cWRewRa-SPY-60-minute-chart-model-with-channels-Fibonacci-support-re/

Per recent;

$SPY 60 minute chart model with channels, Fibonacci, support, resistance, price targets, time cycles. May 13 244 PM $ES_F $SPXL $SPXS

https://www.tradingview.com/chart/SPY/5pP9V65v-SPY-60-minute-chart-model-with-channels-Fibonacci-support-re/

$SPY, algorithm, 60 minute
https://www.tradingview.com/chart/SPY/5pP9V65v-SPY-60-minute-chart-model-with-channels-Fibonacci-support-re/

Per recent;

$SPY 60 Min model 700 AM May 11. Channels, quads, price targets, horizontal Fib support resistance buy sell triggers. $ES_F $SPXL $SPXS

https://www.tradingview.com/chart/SPY/yyPMMSvg-SPY-60-Min-model-700-AM-May-11-Channels-quads-price-targets/

$SPY, 60 Min, Chart, Algorithm
$SPY 60 Min model 700 AM May 11. Channels, quads, price targets, horizontal Fib support resistance buy sell triggers. $ES_F $SPXL $SPXS

Per recent;

$SPY 60 minute chart model with possible up and down trend channels, quads, price targets, horizontal Fib support / resistance.

https://www.tradingview.com/chart/SPY/HYWf7Puw-SPY-60-minute-chart-model-with-possible-up-and-down-trend-chann/

$SPY, 60 Min, chart, channels
$SPY 60 minute chart model with possible up and down trend channels.

$SPY Conventional Charting Considerations:

Per recent;

$SPY Daily Chart, ending week bullish with a break above upper TL and 20 MA near breach 50 MA. $ES_F $SPXL $SPXS

https://www.tradingview.com/chart/SPY/y01eOIL1-SPY-Daily-Chart-ending-week-bullish-with-a-break-above-upper-T/

$SPY, Daily, Chart, MACD
$SPY Daily Chart, ending week bullish with a break above upper TL and 20 MA near breach 50 MA. $ES_F $SPXL $SPXS

Per recent;

$SPY Daily Chart, ending week bullish with MACD turned up, price above MA’s and 20 MA about to cross. $ES_F $SPXL $SPXS

https://www.tradingview.com/chart/SPY/KC1VIKBi-SPY-Daily-Chart-ending-week-bullish-with-MACD-turned-up-price/

$SPY, conventional, Daily, Chart
$SPY Daily Chart, ending week bullish with MACD turned up, price above MA’s and 20 MA about to cross. $ES_F $SPXL $SPXS

Per recent;

$SPY ended week under 50 MA (bearish) and MACD flat.

$SPY, MACD, 200MA
$SPY ended week under 50 MA (bearish) and MACD flat.

Recent Real-Time Alerts, Trading, Model Price Target hits etc.

May 21 – I will update alert and price target examples soon.

May 13 – I will update alert and price target examples soon.

Per recent;

9:56 AM – 19 Apr 2018 $SPY Divergent trade returning to target area it tried to pass in the fast lane. See previous recent posts.

$SPY Divergent trade returning to target area it tried to pass in the fast lane. See previous recent posts. pic.twitter.com/3vo4sgNXKH

— Melonopoly (@curtmelonopoly) April 19, 2018

$SPY, divergent, trade, alert
$SPY Divergent trade returning to target area it tried to pass in the fast lane. See previous posts..png

5:18 AM – 18 Apr 2018 That 273.20 mark that comes due in a time cycle peak for $SPY at around 2:00 EST today…. that’s the start of a double extension getting really stretched on the models – corresponds with everything that moved. There ain’t much room available above that short term. Rest on deck.

That 273.20 mark that comes due in a time cycle peak for $SPY at around 2:00 EST today…. that's the start of a double extension getting really stretched on the models – corresponds with everything that moved. There ain't much room available above that short term. Rest on deck. pic.twitter.com/wKfBQ9njDc

— Melonopoly (@curtmelonopoly) April 18, 2018

4:48 AM – 18 Apr 2018 $SPY long side trade cleared mid quad and quad wall. Closed 270.19, next res trims 270.22, 270.45, 271.99, 273.25

https://twitter.com/SwingAlerts_CT/status/986526884790927360

$SPY, trade, alert, chart
$SPY long side trade cleared mid quad and quad wall. Closed 270.19, next res trims 270.22, 270.45, 271.99, 273.25

3:37 PM – 13 Apr 2018 The resistance dump after the alert and the 50 MA support may become your buy area Mon morning. $SPY #swingtrading https://www.tradingview.com/chart/SPY/H375XWXb-The-resistance-dump-after-the-alert-and-the-50-MA-support-may-be/ …

https://twitter.com/SwingAlerts_CT/status/984878380284858369

$SPY, alert, feed
The resistance dump after the alert and the 50 MA support may become your buy area Mon morning. $SPY #swingtrading.png

11:05 AM – 13 Apr 2018 $SPY trim quad resistance alert worked well.

https://twitter.com/SwingAlerts_CT/status/984809783768346624

$SPY, trading, alert
$SPY trim quad resistance alert worked well.

9:31 AM – 13 Apr 2018 $SPY upside resistance trim alert to long side as it approaches 268.00 mid quad res

https://twitter.com/SwingAlerts_CT/status/984786277189988352

$SPY, twitter, alert
$SPY upside resistance trim alert to long side as it approaches 268.00 mid quad res

$SPY at upside resistance pivot and structured trade worked out. Trim longs add above.

https://www.tradingview.com/chart/SPY/JbhGvFKm-SPY-at-upside-resistance-pivot-and-structured-trade-worked-out/

$SPY, upside resistance
$SPY at upside resistance pivot and structured trade worked out. Trim longs add above.

$SPY building structure near the buy trigger and channel bottom we expected. It’s long while it holds area. Trading 261.23 intra day.

https://twitter.com/SwingAlerts_CT/status/981571557771350018

https://www.tradingview.com/chart/SPY/hmAGDbrc-SPY-building-structure-near-the-buy-trigger-and-channel-bottom/

$SPY, chart, structure
$SPY building structure near the buy trigger and channel bottom we expected. It’s long while it holds area.

$SPY Time cycle peak on this simple model is now. If its going to follow channel up it will be soon that it starts. If not, it could be another channel down yet.

https://www.tradingview.com/chart/SPY/IDiDMAVs-SPY-Time-cycle-peak-on-this-simple-model-is-now-If-its-going-t/ …

https://twitter.com/DayAlerts_CT/status/978990333278253056/photo/1pic.twitter.com/50zcoPctuv

$SPY, timecycle, charting
$SPY Time cycle peak on this simple model is now. If its going to follow channel up it will be soon that it starts.

Best with your trades and look forward to seeing you in the room!

Freedom the $SPY Algo

Tweets by FREEDOMtheAlgo

Article Topics: Freedom, Algorithm, Chart, Model, $SPY, $ES_F, $SPXL, $SPXS

Read More
EPIC Oil Algorithm Report Mon May 21 FX: $USOIL $WTIC $CL_F $USO $UWT $DWT $UCO $SCO

EPIC Oil Algorithm Report Mon May 21 FX: $USOIL $WTIC $CL_F $USO $UWT $DWT $UCO $SCO

May 21, 2018July 15, 2018 Epic the AlgoCrude Oil Trading Algorithm (EPIC)$CL_F, $UCO, $USO, $USOIL, $UWT, $WTI, Algorithm, Chart, Crude, DWT, EPIC, Oil, Trading Room

EPIC the Oil Algorithm Charting Report Monday May 21, 2018 (Member Edition). FX: $USOIL $WTIC – $USO $CL_F $UWT $DWT $UCO $SCO $ERX $ERY $GUSH $DRIP

Welcome to my new FX: $USOIL $WTI oil trade report. My name is EPIC the Oil Algo and I am one of six Algorithmic Charting services in development at Compound Trading.

NOTICES:

New members to our oil algorithm chart model service – please on-board in a way that best equips you to be profitable. Visit my Twitter feed (@EPICtheAlgo) and review tweets over the last few months, visit our blog and review my recent blog posts, our You Tube channel “how my algorithm works”, “how to use my charting”, the weekly EIA report videos and our website (it explains how I was developed). Reviewing those points of reference will increase your chance of success considerably. In this report, some recent example “how-to” videos are include below.

Oil Trade Coaching – Users of this algorithm chart model may opt for private one-on-one coaching with our lead trader and / or an experienced trader that has worked under our lead trader. On our website standard one-on-one online coaching packages are made available (coaching via Skype) or you can request a customized package (reflecting the time you wish to invest in learning). To request a custom package suited to your needs email info@compoundtrading.com or click here for standard private trade coaching packages. Other options for coaching include online webinars and private on location and in-person coaching sessions. 

Oil Trading Room – How to Use My Oil Algorithm

Oil Trading Room – How to Trade Intra-day with my Algorithm Charting

MULTI-USERS: Institutional / commercial platform now available.

SOFTWARE: My algorithmic charting is planned to go to developer coding phase for our trader’s dashboard program. Please review my algorithm development process, about my oil algorithm story on our website www.compoundtrading.com and my oil algo charting posts on my Twitter feed and/or this blog.

HOW MY ALGORITHM WORKS: I am an oil algorithm model in development. My math is based on traditional indicators (up to fifty at any given time each weighted on win ratio merit – all not shown on chart at any given time) – such as simple math calculations relating to price and volume, Fibonacci, simple pivots, moving averages, Gann, Schiff and various other charting, geometric and mathematical factors. I do not yet have AI or Geo Political integration – only math as it relates to traditional indicators with the primary goal being probabilities. I am not a high frequency robot type algorithm – I am presented on (and used on) a traditional trading chart as one would normally use as a probability indicator. The goal is to provide our trader’s with an edge when triggering entries and exits on trades with instruments that rely on the price of crude oil.

Below you will find a simplified view of levels that can be used on a traditional chart (both intra-day and as a swing trader or investor). This work and associated trade, should be considered one decision at a time, “if this happens then this or this are my targets”… price – trigger – trade and so on. Questions to; info@compoundtrading.com, message our lead trader on Twitter, or message a lead trader in the trade room.

Visit this link for more information about my oil algorithm development, this link explains how our algorithmic charting is done, this YouTube video explains in summary how my algorithm works https://www.youtube.com/watch?v=LUNyxFoXJp8 this link for more information about our algorithmic stock charting models and what makes them different than most.

EVERY CALL WE MAKE, EVERY PUBLIC INTERACTION, REPRESENTATION OF TRADE SIGNAL (ON EVERY VENUE) IS VIDEO RECORDED (TRADING ROOM), ON SOCIAL MEDIA OR ON BLOG / WEBSITE TIME-STAMPED FOR PERMANENT RECORD AND TRANSPARENCY. PLEASE ALSO REFER TO OUR PUBLIC DISCLOSURE https://compoundtrading.com/disclosure-disclaimer/.

FX: $USOIL $WTI Observations:

Below is the link for the live chart version of EPIC the Oil Algorithm Live Real-Time Trading Chart for May 21, 2018. Click on share button (bottom right beside flag) and when that screen opens you can click on make it mine to make edits etc:

Oil current trade. May 21 338 AM EPIC Oil Algorithm Chart FX $USOIL $WTI #OIL $USO $UWT $DWT $CL_F #OOTT #Algo

https://www.tradingview.com/chart/USOIL/TqfC3z1J-Oil-current-trade-May-21-338-AM-EPIC-Oil-Algorithm-Chart-FX-US/

Oil, current trade, algorithm
Oil current trade. May 21 338 AM EPIC Oil Algorithm Chart FX $USOIL $WTI #OIL $USO $UWT $DWT $CL_F #OOTT #Algo

May 21, 2018

The first most predictable trade is the significant resistance cluster area formed by red trend lines (see previous posts and supplemental conventional charting below). As noted in the previous reports, at this point (as you will note when reviewing the charting below) trade has cleared all conventional trend-line resistance points to the upside.

The second most predictable trade (wide trading range primary resistance and support that become predictable buy and sell triggers). Current algorithmic model wide trading range resistance (grey arrow – grey horizontal line) at approximately 72.54 in the current trading range. Current algorithmic model wide trading range support (grey arrow – grey horizontal line) at approximately 68.93 in the current trading range – these areas are general range support and resistance areas (our algorithm uses a .15 – .20 cent buffer on either side for these trades). Trading between the resistance / support horizontal grey lines is extremely profitable risk – reward if one is disciplined to the patience required and follows the trend of trade.

The lower trading range is 65.32 to 68.93

The upper trading range is 72.54 to 76.15

Trading Bias / Forward Guidance: Per recent posts I am looking for continued long bias trading to resistance at 72.50 – 73.50 region (could over shoot near 75.00). Trade price and watch for alerts..

Third most predictable trade (support and resistance of uptrend or down trend channels). On the chart an upward trending trade channel is presented and a downward option (channel support and resistance / trading range is represented as diagonal dotted orange lines and purple arrows – as made available, assist in displaying directional trade decision areas).

Fourth most predictable trade (support and resistance of 30 min quadrants). The diagonal lines make up quadrants (in this instance on a 30 min chart) and are represented as orange diagonal lines that make up geometric diamond shapes. These lines also assist in intra-day trade.

Fifth most predictable trade (support and resistance of most applicable Fibonacci) the Fib support and resistance lines are the horizontal lines in various colors with the exception of purple and yellow (see below). These horizontal lines become support and resistance for intra-day trade.

Sixth most predictable trade (support and resistance of historical support and resistance) Natural / historical support and resistance lines shown in purple or yellow – they represent historical support and resistance. The strongest of the historical support and resistance lines are shown in yellow horizontal and are typically accompanied by a yellow arrow marker.

Seventh most predictable trade signal we use are the time and price targets (red circles). When trade is in a significant uptrend or downtrend the targets become very precise and move up the indicator priority list quick.

Tues, Wed and Fri targets are most predictable in extended multi week uptrends or downtrends.

The Eighth most predictable trade is intra-day. You will notice on some of the charting geometric shapes in green on some of my charting (at times). They are charted live in the trading room and at times the lead trader will highlight these areas intra with white outlines (typically geometric shapes such as diamonds or triangles).

Wide Trading Range – Buy and Sell Triggers for Swing Trading:

Trade the ranges noted above between the thick grey lines (grey arrows) for the most predictable swing trades in the lower region are between 58.13 to 61.72, 61.72 to 65.32, 65.32 to 68.92, 68.93 to 72.54 and 72.54 to 76.15. This is a highly profitable risk-reward way to trade oil if you can be patient to trigger at only the break of the wide range charting areas and are disciplined to cut a losing trade that does not prove in your anticipated trend.

Or trade the range between the channel diagonal lines at support and resistance in up or down channel.

Oil up channel scenario. May 21 336 AM EPIC Oil Algorithm Chart FX $USOIL $WTI #OIL $USO $UWT $DWT $CL_F #OOTT #Algo

Oil, uptrend, chart, algorithm
Oil up channel scenario. May 21 336 AM EPIC Oil Algorithm Chart FX $USOIL $WTI #OIL $USO $UWT $DWT $CL_F #OOTT #Algo

Oil down channel scenario. May 21 337 AM EPIC Oil Algorithm Chart FX $USOIL $WTI #OIL $USO $UWT $DWT $CL_F #OOTT #Algo

Oil, chart, downtrend, alorithm
Oil down channel scenario. May 21 337 AM EPIC Oil Algorithm Chart FX $USOIL $WTI #OIL $USO $UWT $DWT $CL_F #OOTT #Algo

Oil Swing Trading Chart Considerations with Price Targets:

Monthly charting review:

May 21 – Oil Monthly. Above important chart pivot nearing 100 MA. Use caution long in to 100 MA resistance. $USOIL $WTI $USO #OIL

https://www.tradingview.com/chart/USOIL/HgjwrJ98-Oil-Monthly-Above-important-chart-pivot-nearing-100-MA-Use-cau/

Oil, monthly, 100 MA, resistance, pivot
Oil Monthly. Above important chart pivot nearing 100 MA. Use caution long in to 100 MA resistance. $USOIL $WTI $USO #OIL

Per recent;

May 13 – Oil Monthly. Right at pivot, between 100 MA Resistance 200 MA Support. MACD SQZMOM trending up Stoch high. $USOIL $WTI $USO #OIL

https://www.tradingview.com/chart/USOIL/2gBYBkaA-Oil-Monthly-At-pivot-btwn-100MA-res-200-MA-sup-Notes/

OIl, monthly, chart, MACD, pivot
Oil Monthly. Right at pivot, between 100 MA Resistance 200 MA Support. MACD SQZMOM trending up Stoch high. $USOIL $WTI $USO #OIL


Oil Monthly. Right at pivot, between 100 MA Resistance 200 MA Support. MACD SQZMOM trending up Stoch high. $USOIL $WTI $USO #OIL

Watch the indicators close for a turn if trade nears that 100 MA (Stochastic RSI, MACD and SQMOM).

I would expect oil to coil that pivot (yellow line) and bounce between 100 MA and 200 MA range on monthly for some time. Yet to be seen… but it’s highly probable imo.

Per recent;

Oil Monthly chart. Likely resistance at 100 MA support at 200 MA pivot at yellow line. $USOIL $WTI #OIL

https://www.tradingview.com/chart/USOIL/SkIPxh5z-Oil-Monthly-chart-Likely-resistance-at-100-MA-support-at-200-MA/

Oil, pivot, chart
Oil Monthly chart. Likely resistance at 100 MA support at 200 MA pivot at yellow line. $USOIL $WTI #OIL

Per recent;

100 MA resistance test on oil monthly chart comes in right where Fib resistance comes in on weekly chart. $USOIL $WTI

https://www.tradingview.com/chart/USOIL/AA9666zc-100-MA-resistance-test-on-oil-monthly-chart-comes-in-right-where/

Oil, monthly, chart, 100MA
100 MA resistance test on oil monthly chart comes in right where Fib resistance comes in on weekly chart. $USOIL $WTI

Per recent;

April 29 – Oil Monthly chart shows next significant resistance at 100 MA. $USOIL $WTI #OIL

https://www.tradingview.com/chart/USOIL/xPmCUevh-Oil-Monthly-chart-shows-next-significant-resistance-at-100-MA/

Oil, monthly, chart
Oil Monthly chart shows next significant resistance at 100 MA. $USOIL $WTI #OIL

Weekly Charting Review:

May 21 – A feature post was published this week to review time cycles, retrace possibilities on the other side of time cycles on the weekly charts. Below is the post link:

Feature Post: 12 of Last 13 Oil Chart Time-Cycles Have Trend Reversal. $USOIL $WTI $CL_F $USO $UCO $UWT $DWT #OIL #OOTT

https://twitter.com/EPICtheAlgo/status/998289468191920128

Oil near weekly model target. Historical probability high for retrace. #timecycle $USOIL $WTIC $USO $UWT $DWT $UCO

https://www.tradingview.com/chart/USOIL/1QewEsoM-Oil-retrace-probability-high-historically-timecycle-Notes/

Oil, weekly, target, retrace
Oil near weekly model target. Historical probability high for retrace. #timecycle $USOIL $WTI $USO #OIL

Per recent;

Significant resistance at 74.71 on weekly nearing FX $USOIL $WTI Weekly Chart.

https://www.tradingview.com/chart/USOIL/gV6rqCeW-Significant-resistance-at-74-71-on-weekly-nearing-FX-USOIL-WTI/

Oil, weekly, chart
Significant resistance at 74.71 on weekly nearing FX $USOIL $WTI Weekly Chart.

Diagonal Trend Lines:

Diagonal trend-lines are critical inflection points (currently represented in red below on our conventional charting).

Please review many of my recent posts so you can learn about how important these diagonal trend-lines are. If one is breached you can look to pull-back to next diagonal trend line about 90% of the time. Also pay attention to how thick the lines are – the thicker the line the more important because they represent extensions from previous time / price cycles.

Remember you can come in to the chat room to message the trader and REMEMBER I have posted a live chart link in this post so if you can’t see the lines well on this chart above you can go to the live chart link and watch for member live algo chart links through-out the day in your email inbox!

The diagonal trend-lines are marked on chart below:

Per previous:

Oil has now cleared every trendline resistance provided on conventional charting I’ve posted last year. $USOIL $WTI $CL_F #OOTT #OIL $USO $UWT $DWT 233 PM Jan 1

Oil, trendline, resistance, chart
Oil has now cleared every trendline resistance provided on conventional charting I’ve posted last year. $USOIL $WTI $CL_F #OOTT #OIL $USO $UWT $DWT 233 PM Jan 1

Oil chart. Conventional indicator considerations (notes on chart). $USOIL $WTI $CL_F #OOTT #OIL $USO $UWT $DWT 608 PM Dec 17, 2017

https://www.tradingview.com/chart/USOIL/MloezxWQ-Oil-chart-Conventional-indicator-considerations-notes-on-chart/

OIL, WTI, Chart, Indicators, Daily
Oil chart. Conventional indicator considerations (notes on chart). $USOIL $WTI $CL_F #OOTT #OIL $USO $UWT $DWT 608 PM Dec 17, 2017

Previous posts for perspective;

$USOIL, $WTI, Chart, Trendlines
Simple lines show expose clusters of resistance. Crude algo intra work sheet 201 AM Apr 10 FX $USOIL $WTIC #OIL $CL_F CL $USO $UCO $SCO $UWT $DWT #OOTT

Notice how when the daily chart is opened, the simple lines extend to current day trade.

Daily chart view. Simple lines show expose clusters of resistance. Crude algo intra work sheet 213 AM Apr 10 FX $USOIL $WTIC #OIL $CL_F CL $USO $UCO $SCO $UWT $DWT #OOTT

Daily, $USOIL $WTI, Chart, Trendlines
Daily chart view. Simple lines show expose clusters of resistance. Crude algo intra work sheet 213 AM Apr 10 FX $USOIL $WTIC #OIL $CL_F CL $USO $UCO $SCO $UWT $DWT #OOTT

Fibonacci Levels:

Watch the lines for support and resistance. Careful using them as traditional retracement levels with crude because the algo lines etc are more dominant / predictable. But the Fib lines are excellent indicators for intra-day trade support and resistance.

The Fibonacci lines are marked on main chart above.

Horizontal Trend-Lines (purple):

Horizontal trend-lines are not as important as the other indicators reviewed above, however, they do serve as important resistance and support intra-day for tight trading and they are important if thick (in other words they come from previous time / price cycles). WE STARTED TO REPRESENT THE REALLY IMPORTANT LINES IN YELLOW FYI FOR EASE. Refer to chart for current applicable horizontal trend-lines.

Horizontal trend-lines are marked on charts above.

Oil Time / Price Cycles:

Watch your email and / or my Twitter feed for time price cycles they may start to terminate.

Time / price cycles are the single most important indicator and my record calling them is near 100% – since inception seven months ago. The reason they are so important is that a trader does not want to be holding a crude oil instrument at termination of a time cycle if not absolutely sure if price will go up or down. A trade may choose to enter a large position in advance of a time price cycle termination IF THERE IS A HIGH PROBABILITY OF A DIRECTION IN PRICE and if the market is trading at a really important pivot area. In other words, if the market is trading at the bottom of the upward trending channel at a support (yellow lines) and we knew there was a significant probability of a time cycle about to terminate a trader may enter with a long position. The price really spikes or drops significantly when these important time cycles terminate.

The problem with time / price cycle terminations is they change from minute to minute (depending on where price is on the chart) so you have to be in the trade room to get the alert. Our lead traders will do everything they can in future to send these on SMS but we have to be careful because it can be difficult with so much going on in the room. The reason they (time cycles) change is because they are actually represented by or are geometric shapes in the chart – I know it sounds odd but I have (as I mentioned) hit these calls just shy of 100%. The oil political people know the same algorithmic modeling principles and they ALWAYS TIME THEIR BIG ANNOUNCEMENTS AROUND THE TIME PRICE CYCLE TERMINATIONS.

So if you can picture a triangle on the chart – and price is trading in the triangle – and price is going to come to the edge of the triangle and there is a significant support or resistance or an algo line terminating there too or a target (those type of indications)… then we know there is a high probability of a time and price change. In other words, it is where there are clusters of algorithm points that cross and when price is going to cross over that cluster is where they are. And these are represented on all the different time frames – the larger the time frame – the larger the time price cycle termination – the larger the spike or downdraft. This is where we establish our intra-day quadrants from for sniping trades (which we will put in to the room soon because it looks like the geo political rhetoric is over for a while making them more predictable). Difficult to explain in short. So we will do our best to SMS alert these in future.

Also, the real large or important time / price cycle terminations we know far in advance and they can be put in these newsletters.

If you review my Epic the Oil Algo Twitter feed, my blog posts and my story on our website you will get a feel for how accurate these calls are.

Alpha Algo Trading Trend-Lines (Primary – Red dotted lines. Secondary – White dotted lines):

To determine which algo line is most alpha (or probable) intra day, it is the nearest line to price action. This can also help you determine the trend of trade. If the algo line is trending up the price will follow it up until price is tested at an algorithm indicator (the main tests are diagonal trendlines, horizontal trendlines, time / price cycles etc – as I have shared with you). This is why it is important to watch all the lines because they are all support and resistance. To keep it simple trade the range (yellow lines) as I’ve mentioned but keep an eye on these indicators.

Current Alpha Algo Targets (Red circles):

Your closest target that crude is trending toward is always the most probable.Then, your second most probable is the one that is up or down trend depending on whether general price is in an upward or downtrend for the most recent week or so and what your other indicators look like (such as the MA’s I explained above).

The other way to determine which targets are in play is actually quite simple, you will notice that crude trades between the channel lines up and down and up and down and there are various support and resistance along the way. If it hits a target at the top of the channel you can bet most times (unless the next day like today) that the next target hit will be at the bottom of the channel.

Wait for the price to trend toward a target and take your position and watch as price gets closer and closer to the target. Remember, that the machines trade from decision to decision – or in other words from support to next resistance or resistance to next support or when the times come each week on Tuesday Wednesday and Friday they will trend toward the target that market price action determines they go to.

Our lead trader will explain more in the room and do not hesitate to ask our lead trader in the room by private message or on twitter to explain intra day decisions.

Recent Live Oil Trade Alerts:

May 21 – Will update the alerts section soon.

May 13 – Will update the alerts section soon.

April 29 – I will update the trade alerts on the next report when there is more time. The bottom line is that since last report the trades have been fantastic winners.

EPIC on fire, not quite 100% win rate, but close. Oil hit all 5 price targets from Friday alert. I left early so only got a piece of it. Alert- Long 67.73 scalp intra on FX $USOIL $WTI with 67.43 stop. PT 68.49. Trim at and add over res 67.85 68.07 68.14 @OilAlerts_CT

EPIC on fire, not quite 100% win rate, but close. Oil hit all 5 price targets from Friday alert. I left early so only got a piece of it. Alert- Long 67.73 scalp intra on FX $USOIL $WTI with 67.43 stop. PT 68.49. Trim at and add over res 67.85 68.07 68.14 @OilAlerts_CT pic.twitter.com/PJuxQw9nqZ

— Melonopoly (@curtmelonopoly) April 22, 2018

Oil hit all 5 price targets from Friday alert. I left early so only got a piece of it.

Oil, alert
Oil hit all 5 price targets from Friday alert. I left early so only got a piece of it.

Just noticed I accidentally put the short side trade alert on my personal twitter feed https://twitter.com/curtmelonopoly/status/986147196658647040 … “Oil short side bias trade setup intra trading 66.47 with 66.20 target expiring btwn 230 and 630 AM ET. Tight stop SS initial alert. Unclear at this point.”

https://twitter.com/OilAlerts_CT/status/986152086806192128

Trading 66.30 from 66.47 entry nearing 66.20 SS target – trim short bias

https://twitter.com/OilAlerts_CT/status/986151044949381121

Trading 66.24 cover trim on way to target

https://twitter.com/OilAlerts_CT/status/986156872729350144

There it is – 66.20 intra day short target reached – bias to all or near all cover here from 66.47 intra scalp alert.

https://twitter.com/OilAlerts_CT/status/986159824491696128

Oil, trade, set-up, alert
Oil short side trade intra set-up on watch at top of quad.

Per recent;

“Oil is very near a quad trading range support area (gray) and lower quad time cycle peak. $USOIL $WTI $CL_F $USO $UWT $DWT #OOTT”

https://twitter.com/OilAlerts_CT/status/981524847703490560

Fantastic #EIA trade near quad support, buy side steps in, first resistance hits, boom. Near perfect. $USOIL $WTI $CL_F $USO $UWT $DWT #OOTT

EIA, oil, report, trade
Fantastic #EIA trade near quad support, buy side steps in, first resistance hits, boom. Near perfect. $USOIL $WTI $CL_F $USO $UWT $DWT #OOTT

Oil is very near a quad trading range support area (gray) and lower quad time cycle peak. $USOIL $WTI $CL_F $USO $UWT $DWT #OOTT

oil, live, trade, alerts
Oil is very near a quad trading range support area (gray) and lower quad time cycle peak. $USOIL $WTI $CL_F $USO $UWT $DWT #OOTT

The alert detail as it was posted on feed. Short side trade alert. EPIC Oil Algorithm Chart Model FX $USOIL $WTI #OIL $USO $UWT $DWT $CL_F #OOTT #Algo

The alert detail as it was posted on feed. Short side trade alert. EPIC Oil Algorithm Chart Model FX $USOIL $WTI #OIL $USO $UWT $DWT $CL_F #OOTT #Algo pic.twitter.com/kTZZEvi9MX

— Melonopoly (@curtmelonopoly) March 22, 2018

Summary of short side trade alert. EPIC Oil Algorithm Chart Model FX $USOIL $WTI #OIL $USO $UWT $DWT $CL_F #OOTT #Algo https://www.tradingview.com/chart/USOIL/yi9JI683-Summary-of-short-side-trade-alert-EPIC-Oil-Algorithm-Chart-Model/ …

Summary of short side trade alert. EPIC Oil Algorithm Chart Model FX $USOIL $WTI #OIL $USO $UWT $DWT $CL_F #OOTT #Algo https://t.co/wOjTLdGph2 pic.twitter.com/GwCWlGMiR9

— Melonopoly (@curtmelonopoly) March 22, 2018

Recent Oil Algorithm Price Target Hits:

May 21 – Will update target hits section soon.

May 13 – Will update target hits section soon.

Perfect price target hit Wed 1030 as provided on weekend report. EPIC Oil Algorithm $USOIL $WTI #OIL $USO $UWT $DWT $CL_F #OOTT #Algo #EIA

Perfect price target hit Wed 1030 as provided on weekend report. EPIC Oil Algorithm $USOIL $WTI #OIL $USO $UWT $DWT $CL_F #OOTT #Algo #EIA

Trade moving in to Wed 1030 PT as provided on weekend report. EPIC Oil Algorithm $USOIL $WTI #OIL $USO $UWT $DWT $CL_F #OOTT #Algo

Trade moving in to Wed 1030 PT as provided on weekend report. EPIC Oil Algorithm $USOIL $WTI #OIL $USO $UWT $DWT $CL_F #OOTT #Algo

Trade fell in to Tues 430 price target (early) and on track to Wed 1030 PT as provided on weekend report. EPIC Oil Algorithm $USOIL $WTI #OIL $USO $UWT $DWT $CL_F #OOTT #Algo

Trade fell in to Tues 430 price target (early) and on track to Wed 1030 PT as provided on weekend report. EPIC Oil Algorithm $USOIL $WTI #OIL $USO $UWT $DWT $CL_F #OOTT #Algo

Keep in mind that there are three price targets per week for down channel and up channel scenarios. Below are examples of targets hit to upside channel or down channel.

Price target hit for Tues 1030 #EIA as provided on weekend report. EPIC Oil Algorithm $USOIL $WTI #OIL $USO $UWT $DWT $CL_F #OOTT #Algo

EPIC, oil, algorithm, price, targets
Price target hit for Tues 1030 #EIA as provided on weekend report. EPIC Oil Algorithm $USOIL $WTI #OIL $USO $UWT $DWT $CL_F #OOTT #Algo

Tues 430 price target hit as provided on weekend report. EPIC Oil Algorithm $USOIL $WTI #OIL #OOTT $UWT $DWT $USO

Price target, hit, EPIC, oil, Algorithm
Tues 430 price target hit as provided on weekend report. EPIC Oil Algorithm $USOIL $WTI #OIL #OOTT $UWT $DWT $USO

Tues Mar 13 430 #OIL perfect hit to price predict target as provided on prior wknd report. EPIC Oil Algorithm Chart FX $USOIL $WTI $USO $UWT $DWT $CL_F #OOTT #Algo

OIL, Algorithm, EPIC, price target
Tues Mar 13 430 #OIL perfect hit to price predict target as provided on prior wknd report. EPIC Oil Algorithm Chart FX $USOIL $WTI $USO $UWT $DWT $CL_F #OOTT #Algo

Wed 1030 Mar 14 #EIA #OIL perfect hit to price predict target as provided on prior wknd report. EPIC Oil Algorithm Chart FX $USOIL $WTI $USO $UWT $DWT $CL_F #OOTT #Algo

Oil, Algorithm, price, target, $WTI, USOIL
Wed 1030 Mar 14 #EIA #OIL perfect hit to price predict target as provided on prior wknd report. EPIC Oil Algorithm Chart FX $USOIL $WTI $USO $UWT $DWT $CL_F #OOTT #Algo

Per recent;

Tues Mar 6 price target perfect hit to minute and penny as provided on prior weekend report. EPIC Oil Algorithm Chart FX $USOIL $WTI #OIL $USO $UWT $DWT $CL_F #OOTT #Algo

Private Member Server Screen shot of #EIA #OIL targets in play from wknd report. EPIC Oil Algorithm Chart FX $USOIL $WTI $USO $UWT $DWT $CL_F #OOTT #Algo

Private Member Server Screen shot of #EIA #OIL targets in play from wknd report. EPIC Oil Algorithm Chart FX $USOIL $WTI $USO $UWT $DWT $CL_F #OOTT #Algo

#EIA #OIL price target in play as provided on wknd report (Tues hit perfect). EPIC Oil Algorithm Chart FX $USOIL $WTI $USO $UWT $DWT $CL_F #OOTT #Algo

#EIA #OIL price target in play as provided on wknd report (Tues hit perfect). EPIC Oil Algorithm Chart FX $USOIL $WTI $USO $UWT $DWT $CL_F #OOTT #Algo

#EIA #OIL upper price target touch only and dumped in to lower target as provided on prior wknd report . EPIC Oil Algorithm Chart FX $USOIL $WTI $USO $UWT $DWT $CL_F #OOTT #Algo

#EIA #OIL upper price target touch only and dumped in to lower target as provided on prior wknd report . EPIC Oil Algorithm Chart FX $USOIL $WTI $USO $UWT $DWT $CL_F #OOTT #Algo

#EIA #OIL in to lower target as provided on prior wknd report . EPIC Oil Algorithm Chart FX $USOIL $WTI $USO $UWT $DWT $CL_F #OOTT #Algo

#EIA #OIL in to lower target as provided on prior wknd report . EPIC Oil Algorithm Chart FX $USOIL $WTI $USO $UWT $DWT $CL_F #OOTT #Algo

Screen shot of price and time target hit as provided on report 5 days prior. EPIC Oil Algorithm FX $USOIL $WTI #OIL $USO $UWT $DWT $CL_F #OOTT #Algo

oil, algorithm, price, target, EPIC
Screen shot of price and time target hit as provided on report 5 days prior. EPIC Oil Algorithm FX $USOIL $WTI #OIL $USO $UWT $DWT $CL_F #OOTT #Algo

Wed #EIA 1030 Feb 28 perfect hit to target at exact cent and minute as provided on weekend report. EPIC Oil Algorithm FX $USOIL $WTI #OIL $USO $UWT $DWT $CL_F #OOTT #Algo

oil, algorithm, EIA, price, target
Wed #EIA 1030 Feb 28 perfect hit to target at exact cent and minute as provided on weekend report. EPIC Oil Algorithm FX $USOIL $WTI #OIL $USO $UWT $DWT $CL_F #OOTT #Algo

Tues 430 Feb 27 price time target perfect hit as provided on weekend report. EPIC Oil Algorithm FX $USOIL $WTI #OIL $USO $UWT $DWT $CL_F #OOTT #Algo

$WTI, $USOIL, Algorithm, target
Tues 430 Feb 27 price time target perfect hit as provided on weekend report. EPIC Oil Algorithm FX $USOIL $WTI #OIL $USO $UWT $DWT $CL_F #OOTT #Algo

Fri Feb 23 price time target perfect hit as provided on report 5 days prior. EPIC Oil Algorithm FX $USOIL $WTI #OIL $USO $UWT $DWT $CL_F #OOTT #Algo

oil, algorithm
Fri Feb 23 price time target perfect hit as provided on report 5 days prior. EPIC Oil Algorithm FX $USOIL $WTI #OIL $USO $UWT $DWT $CL_F #OOTT #Algo

Per recent;

Oil Wed 1030 AM EIA report price target perfect hit, as provided on weekend report. EPIC Oil Algorithm Chart FX $USOIL $WTI #OIL $USO $UWT $DWT $CL_F #OOTT #Algo

Wed, Algorithm, Price, Target, USOIL, WTI
Oil Wed 1030 AM EIA report price target perfect hit, as provided on weekend report. EPIC Oil Algorithm Chart FX $USOIL $WTI #OIL $USO $UWT $DWT $CL_F #OOTT #Algo

Oil Intra-Day Algo Trading Quadrants (white dotted lines):

Trading quadrants are simply support and resistance lines that can assist your intra-day trading – they are not alpha or primary support and resistance by any measure. Price action does however typically move more assertively when leaving a trading quadrant.

Indicator Methods:

As explained above, my algorithm is a consideration of up to fifty traditional indicators at any one time – each one given its own weight in accordance to its accuracy (win rate). This is how we establish the probability of specific targets hitting (we call them alpha algo targets).

Alpha Algo Targets, Algo Trend-lines, Algo Timing, Quadrants for Intra Snipes

Algo targets are the red circles – they correspond with important times each week in oil reporting land. Tuesday 4:30 PM, Wednesday 10:30 AM and Friday at 1:00 PM. The red dotted diagonal lines are the algo trend-lines. And the vertical dotted (red or green) are marking the important times each week. You will find that the price of crude will hit one of the alpha algo targets about 90% of the time. In the absence of market direction the machines take price to the next algo line and/or target. Understanding how the price of crude reacts to the algos and how they move price from target to target is critical for intra-day and swing trading crude oil and associated instruments.

You will notice that price action of crude will use these algo trend-lines and act as support and resistance, and that price also often violently moves when an alpha algo line is breached either upward or downward.

We cover this in much more detail in the member updates, trading room. A review of my Twitter feed and previous blog posts will help you understand the relation of these indicators. We will start posting video blogs (for my subscribers) on YouTube (in addition to my daily blog posts) for swing traders that work during regular trading hours.

Also… we will cover how to establish algo trend-lines and price targets future forward (as you have seen me do on my Twitter feed for some time now).

Conclusion:

See you in the live trade room! And again, if you struggle to know how to use these indicators as a trader’s edge, it is recommended (if you have earnestly reviewed all of our documentation first) that you obtain private coaching prior to trading a real account with real money – we recommend you use a paper trading account at first.

You can also send specific questions to our email inbox at info@compoundtrading.com – if you do this be sure to ask a specific question so it can be answered specifically. When the 24 hour oil trading room opens you will have ample opportunity in that 24 hour room to ask questions also.

Watch my EPIC the Oil Algo Twitter feed for intra day notices and your email in box for member only material intra day also.

EPIC the Oil Algo

Subscribe:

Temporary Discount Offers (for new member only).

30% off Oil Trading Newsletter: Use Promo Coupon Code “epic30” When Subscribing to Weekly Newsletter (regular 299.00, 209.30 with discount) here: https://compoundtrading.com/product/standalone-epic-newsletter/ (cancel anytime, for new members only to trial the service).

30% off Oil Trading Alerts: Use Promo Coupon Code “oilalerts30” for Real-Time Oil Trade Alerts via Private Twitter Feed @OilAlerts_CT (regular 199.00, 139.30 with discount) here: https://compoundtrading.com/product/live-oil-trading-alerts/?attribute_plan=One+Month (cancel anytime, for new members only to trial the service).

30% off Oil Trading Bundle: (Weekly Newsletter, Trading Alerts, Private Discord Oil Chat Room): Use Promo Coupon Code “epic30” for the Oil Trading Bundle (regular 399.00, 279.30 with discount) here: https://compoundtrading.com/product/fx-usoil-epic-oil-algorithm/

Click here to find all information and pricing on Oil Newsletter, Trading Chat Room, Oil Alerts and more.

Connect:

Register to free email list for trade set-ups, webinars, special events: https://compoundtrading.com/contact/

Website: https://compoundtrading.com

Blog: https://compoundtrading.com/blog/

Free chat room: https://discord.gg/2HRTk6n

Subscribe: https://compoundtrading.com/overview-…

Twitter: https://twitter.com/CompoundTrading

Lead Trader: https://twitter.com/curtmelonopoly

Tradingview: https://www.tradingview.com/u/curtmel…

Facebook: https://www.facebook.com/compoundtrad…

StockTwits: https://stocktwits.com/compoundtrading

Email: https://info@compoundtrading.com

Tweets by EPICtheAlgo

PS If you are not yet reviewing the daily post market trading results blog posts, please do so, they are on the blog daily and often there is information that also may assist your trading. Trade room transcripts (for example) may review topics pertinent to your trading.

Article topics: EPIC, Oil, Trading Room, Crude, $USOIL, $WTI, $USO, $UCO, $CL_F, $UWT, $DWT, Chart, Algorithm

Read More
Feature Post: 12 of Last 13 Oil Chart Time-Cycles Have Trend Reversal. $USOIL $WTI $CL_F $USO $UCO $UWT $DWT #OIL #OOTT

Feature Post: 12 of Last 13 Oil Chart Time-Cycles Have Trend Reversal. $USOIL $WTI $CL_F $USO $UCO $UWT $DWT #OIL #OOTT

May 20, 2018January 13, 2019 Curt MelonopolyCrude Oil Trading Strategy, Swing Newsletters$CL_F, $UCO, $USO, $USOIL, $UWT, $WTI, Chart, DWT, Oil, OOTT, symmetry, timecycles, Trade, trend reversal, weekly

Going Back to 2002, Twelve of last Thirteen Major Time Cycle completions on Weekly Oil Chart (a significant structure) have a Trend Reversal to one extent or another. 

This structural set-up should not be ignored by oil traders as the weekly chart is a significant structural consideration for long / short bias in trade planning and positioning.

Consideration toward indicators or chart set-ups / patterns in your oil trade planning is good (technical), as is fundamental research.

However, relying on limited individual charting indicators or set-up patterns (such as moving averages, MACD, head and shoulder pattern, etc) to form a bias can be problematic as it doesn’t provide a complete “structural” perspective to effectively form trade bias / positioning.

In our work, we rely heavily on chart structure on various time frames (1 min, 3, 5, 15, 30, 1 hour, 2, 4, Daily, Weekly and Monthly).

Above all else, the structure of the trading instrument (in our work and trade) is trump consideration. We know that all financial instruments have a structure and it is this structure that allows our trade positioning and our machine coding to operate at a significant advantage to the broad market.

If you wish to confirm our call record, contact me anytime for a personal tour of time stamped alert feeds, private user feeds and more.

January 2019 Update:

It happened again… today I posted an updated chart that brings the count to 13 out of last 14 time cycles, see below.

Dating back to 2002, 13 of 14 major time cycles on weekly crude oil chart structure seen trend reversal to some extent or another #Oil #OOTT #TimeCycles FX USOIL WTI $CL_F $USO $UWT $DWT

https://www.tradingview.com/chart/USOIL/F8Z9UE66-Dating-back-to-2002-13-of-14-major-time-cycles-on-weekly-crude/ …

The Technical Significance of the Weekly Oil Chart and Structure Presented:

Specific to the point of this post, below is the oil chart I published to Trading View that shows the time cycle peak areas of oil on the weekly chart. The weekly oil chart is a significant structure because it is one of the broadest time frames the market uses to chart the trade of oil.

Dating back to 2002, 12 of 13 major time cycles on weekly oil chart have seen trend reversal to some extent or another #OILChart

Real-time oil chart link: 

https://www.tradingview.com/chart/USOIL/SvCYkyzH-12-of-last-13-time-cycles-in-Oil-trade-had-trend-reversal-OIL/

Oil chart, time cycles
Dating back to 2002, 12 of 13 major time cycles on weekly oil chart have seen trend reversal to some extent or another #OILChart


12 of last 13 time cycles in Oil trade had trend reversal. #OIL by curtmelonopoly on TradingView.com

How to Read this Oil Chart:

  • The vertical green lines show the date(s) of the peak time cycle area. You will notice that oil trade has reversed trend 12 of the last 13 time cycle peak areas. In some instances immediately and in some instances a few weeks later. You will also notice that the trend reversal is at times considerable and at other times not so much. The only time cycle peak that did not see a trend reversal was during the price plunge in October of 2014.
  • The yellow arrows on the oil chart denote area of trend reversal (in some instances a simple retrace and in others the reversal in oil trade is much more significant).
  • The diagonal blue lines are simple Fibonacci related trendlines that form what we call Trading Quadrants (the term comes from the lab work we do in preparation for machine coding of our algorithm models).
  • The horizontal lines are Fibonacci related support and resistance (retracement) lines. Our Fibonacci work is formed specific to chart structure and not conventional Fibonacci retracement work you may usually see from market chartists.
  • The red circles are targeted areas of precise trade that we note for our reference and purpose as it relates to our work. Not a significant indication on this chart for the point of this post.
  • The moving averages 20 MA, 50, 100, 200 are also on the chart and also not significant to the point of this post.

Below are Oil Chart Snap Shots From 2002 to Present (Note the Symmetry):

Symmetry and patterns in trade are important, especially if symmetry can be established within time cycles with some regularity. The chart images for oil trade from 2002 to 2018 (present) display the importance of this type of work.

Oil Charting Jan 2002 to Jan 2009 shows a consistent pattern / symmetry of oil trade trend reversals at time cycle peaks. $USOIL $WTI $CL_F #OIL

OIL, chart, historical, time cycles, symmetry
Oil Charting Jan 2002 to Jan 2009 shows a consistent pattern of oil trade trend reversals at time cycle peaks. $USOIL $WTI $CL_F #OIL

Oil Charting Jan 2008 to December 2014 also shows the trend reversal pattern with one exception in Oct 2014. $USOIL $WTI $CL_F #OIL

Oil, charting, historical, symmetry, trend reversals
Oil Charting Jan 2008 to December 2014 also shows the trend reversal pattern with one exception in Oct 2014. $USOIL $WTI $CL_F #OIL

Oil Charting from Aug 2013 to present day in May 2018 also displays the trend reversals post time cycle peaks. $USOIL $WTI $CL_F #OIL

Oil, charting, symmetry, time cycles, trend reversals
Oil Charting from Aug 2013 to present day in May 2018 also displays the trend reversals post time cycle peaks. $USOIL $WTI $CL_F #OIL

Where are We Now?

Oil trade is now on the other side of an important time cycle completion / peak, as with the last thirteen time cycles highlighted in this post.

There is a very high probability of a reversal in trend, whether it be a simple retrace or a completely new trend develops.

How to Trade The Next Move in Oil:

For a detailed swing trading plan for the next move in oil register to our free mailing list and you will receive a copy. Unsubscribe anytime.

If you are already on our mailing list, you will automatically receive a copy of the oil trading report when released shortly.

Crude Oil Trading Academy : Learn to Trade Oil:

Learning to Trade Crude Oil Futures Contracts is Like No Other Trading – Having a Rules Based Process Will Help You.

Visit our complimentary study links here for real articles from our oil traders day to day experience in our oil trading room, click here – Crude Oil Trading Academy : Learn to Trade Oil.

Learning to Trade? Here are some links that reflect topics in this post:

Trend Reversal https://www.investopedia.com/terms/r/reversal.asp

Charting Time Cycles http://stockcharts.com/school/doku.php?id=chart_school:chart_analysis:cycle_lines

Fibonacci for Charting https://www.investopedia.com/terms/f/fibonacciretracement.asp

Symmetry in Mathematics https://en.wikipedia.org/wiki/Symmetry_in_mathematics

Subscribe:

Temporary Discount Offers:

30% Off Oil Newsletter: Use Promo Coupon Code “epic30” When Subscribing to our Weekly Oil Newsletter Here: https://compoundtrading.com/product/standalone-epic-newsletter/ (cancel anytime, for new members only to trial the service).

30% Off Oil Alerts: Use Promo Coupon Code “oilalerts30” for Real-Time Oil Trade Alerts via Private Twitter Feed @OilAlerts_CT Here: https://compoundtrading.com/product/live-oil-trading-alerts/?attribute_plan=One+Month (cancel anytime, for new members only to trial the service).

Click here to find all information and pricing on Oil Newsletter, Trading Chat Room, Oil Alerts and more.

Connect:

Register to free email list for trade set-ups, webinars, special events: https://compoundtrading.com/contact/

Website: https://compoundtrading.com

Blog: https://compoundtrading.com/blog/

Free chat room: https://discord.gg/2HRTk6n

Subscribe: https://compoundtrading.com/overview-…

Twitter: https://twitter.com/CompoundTrading

Lead Trader: https://twitter.com/curtmelonopoly

Tradingview: https://www.tradingview.com/u/curtmel…

Facebook: https://www.facebook.com/compoundtrad…

StockTwits: https://stocktwits.com/compoundtrading

Email: compoundtradingofficial@gmail.com

Curtis Melonopoly (@curtmelonopoly) is rated Top 250 Stock exchanges authority, covering also Mathematical finance and Economy of the United States

Compound Trading Platform: Algorithm model charting for $SPY, $VIX, #OIL, #GOLD, #SILVER, #Crypto ($BTC Bitcoin, $ETH, $LTC, $XRP,) $DXY US Dollar and Swing Trading Newsletter. Live trading rooms for daytrading and oil traders. Private coaching and live alerts.


Read More
Webinar Notice – How to Swing Trade US Dollar Move $DXY $UUP

Webinar Notice – How to Swing Trade US Dollar Move $DXY $UUP

May 18, 2018May 18, 2018 $DXY US Dollar Index$DXY US Dollar Algo, Swing Newsletters$UUP, Dollar, DXY, Swingtrade, USD

US Dollar Index Webinar Sun May 20 10:00 PM EST Main Trading Room.

How to Trade our Algorithm Model for Imminent $DXY US Dollar Index Move $UUP.

Open to all members & mailing list subscribers (free).

Video will be emailed to members after if you can’t be with us live.

Subscribe free here https://compoundtrading.com/contact/

Main Trading Room Link: https://compoundtrading1.clickmeeting.com/livetrading

Password: WINNING7777


Read More
Swing Trading Report Fri May 18 Part B $FB, $BABA, $EXK, $BA, $LIT, $BWA more.

Swing Trading Report Fri May 18 Part B $FB, $BABA, $EXK, $BA, $LIT, $BWA more.

May 18, 2018July 28, 2018 Swing TraderSwing Trading$BA, $BABA, $BWA, $EXK, $FB, $LIT, Alerts, Compound trading, Picks, Stock, Swing, Trading

Welcome to the Compound Trading Swing Trading Stock Report Friday May 18, 2018 (Part B).

In this edition: $FB, $BABA, $EXK, $BA, $LIT, $BWA more.

Email us at info@compoundtrading.com anytime with any questions about any of the swing trades listed below. Or, if we get bogged down private message Curtis in trade room or direct message him on Twitter. Market hours are tough but we endeavor to get back to everyone after market each day.

Notices:

Good morning!

This swing trading report is one in five in rotation. The goal is to publish each in rotation approximately every 30 – 40 days (pending market conditions). We currently have approximately one hundred equities we cover regularly on our swing trading service.

This is Part B of this report.

The reports are in the process of upgrades to included buy and sell triggers identified on charting of select instruments that are nearing trade set-ups. The triggers (price and / or other indicators) will also be programmed in to our charting for attendees to the live trading room and alerts will flash on screen in the trading room. Additionally, the triggers will be buy / sell points for our traders to use as part of the alerts members may receive.

If you need help with a specific trade and the specific trading plan for your swing trade set-up let me know and as I have time I can help you formulate.

When managing your trades with the reports keep in mind that you will have to invest an hour or two a week to check the indicators mentioned for buy and sell triggers.

Swing trading success, even with a service, does require “some” maintenance on the part of the user, although the new live alert service will take much of that burden off the user as we know many of our users have busy lives. It is the indicators lining up that signal a trade long entry or an exit. In our case rely heavily on MACD on daily or weekly (or Stoch RSI and Moving averages) but indicators we are basing our trade entry and exits on are listed with each trade so any user that does even moderate trade management will know when the indicator(s) have turn with or against the trade.

Intra-week you can always DM myself on Twitter or email with specific questions regarding trades you are considering for assistance. But it is critical that you attend to the maintenance of your signals at least once a week if not twice and set stops and preferably alarms so that intra-week you can enter or exit.

If nothing else you can always book some coaching time and I’ll assist also (highly recommended if you are not trading green yet). If interested in coaching options email me info@compoundtrading.com.

IF WE DON’T GET BACK TO YOU RIGHT AWAY it is usually because we are pressured with deadlines or are trading.

As live charts are made available below, click on link and open viewer. Then to use chart yourself click on share button at bottom right (near thumbs up) and then click “make it mine”.

To remove the indicators (MACD, Stochastic RSI, Squeeze Momentum Indicator represented at bottom of chart) double click on chart body – and same to return the indicators.

If you receive a report and you are not subscribed to the specific service it is a complimentary issue..

Our apologies if you receive more than one copy – it means you are on more than one subscription list. We are working to resolve this issue.

Newer updates below in red for ease.

Recent Compound Trading Videos and/ or Blog Posts for Swing Traders / Charting Set-Ups:

See You Tube for other recent video posts.

Password: SET Protected: Swing Trade Set-Ups (May 15/16 Member Edition) $WTI, #OIL, $BTC, Bitcoin, $AMBA, $AMD, $BLNK, $ITCI,, $SPY, $DIS, $LAC, $BOX, $AAOI more.

Password: AI Protected: How to Trade Pure Storage Earnings in Six Days (Member Edition) $PSTG

Password ITCI: Protected: Trade Set-Ups (May 14 /15 Member Edition) $BOX, $ITCI, $SPY, $EEM, $PFE, $BTC, Bitcoin, SILVER, $SLV, $ETH, Ethereum, $EOG, $EDIT, $EXP more.

Password: WOW Protected: How to Trade Box Earnings Move (Swing Trade Member Exclusive)

Protected: Trade Set-Ups (May 8 Member Edition) $AAPL, $DIS, $AMD, $ITCI, $AAOI, $SNAP, $FB, $TSLA, $EDIT, $ESPR, $LITE, $LPSN, $SPY.

May 7 – Trade Set-Ups, Consolidated Review $SPY, $AAPL, $TSLA, $SNAP, OIL, $DXY, $VIX, GOLD, $DIS, Silver more.

Trading Set-ups $FB, $AMBA, $SDTY, $TSLA, $GDX, $SLV, $BTC, $JD, $VIX, $LITE, $CELG, $FSLR more.

Do Not Ignore This Trade Set-Up | $AMBA Swing Trade | 40% ROE 3 Mos (Part 1 of 2)

Password: ELON Protected: How to Trade the Tesla Move | Price Targets | Buy Sell Triggers | Time Cycles $TSLA #swingtrading #daytrading

Password: LONG Protected: Overnight Oil Trade | Trading Plan in Detail | EPIC Oil Algorithm $USOIL $WTI $CL_F #OIL $USO #Alerts

Trade Set-ups $SPY, $NFLX, OIL, $WTI, $ESPR, $GOOGL, Bitcoin, $BTC, $FEYE, $AAPL and more.

Trading Set-Ups $SPY, Gold, $GC_F, $GDX, Bitcoin, $GOOGL, $EVLV, $HEAR, $CHEK, $MARA, $PRTA, $ZDGE

Trading Set-Ups $NETE, $TSG, $ETH Ethereum, $BTC Bitcoin, $TAN, $HEAR, $AMMJ, $SNAP, $VLRX

Trade Set-Ups OIL, $WTI, $SPY, $GOOGL, $FSLR, $AXP, $GREK, $CELG, $AAOI, $SDRL, $WFT

Great Trading Last Few Wks – Lets Keep Going! $RIG, #OIL, $SPY, $ETH, $BTC, $FB, $GOOGL, $BWA, $GDX more.

Email us at info@compoundtrading.com anytime with any questions about any of the swing trades listed below. Or, if we get bogged down private message Curtis in trade room or direct message him on Twitter. Market hours are tough but we endeavor to get back to everyone after market each day.

Stock Pick Coverage

$C – CitiGroup

May 15 – CITI bought consistently at historical support noted previous. MACD trend up. Resistance above. Riding 200 MA. $C

https://www.tradingview.com/chart/C/H1TQmT6P-CITI-bought-conistently-at-historical-support-noted-previous-MA/

This is an interesting set-up. I’m slightly bullish but it has to gain the mid quad resistance above at 74.00 and then long side entries can start as long as indicators are cooperating..

Closed Tuesday 72.68 with next support below at 70.45 and currently riding 200 MA.

Trade above 74.00 has resistance above at 76.71.

Recent article on Investopedia Citigroup’s Stock May Rebound by 10%

April 4 – Citi quad wall & historical support near. 74.46 PT Chart notes. – #C chart

http://www.tradingview.com/chart/C/qRDWOlvu-Citi-quad-wall-historical-support-near-74-46-PT-Chart-notes/ …

$C Citi at a quad wall and historical support test here. 74.46 June 15 time cycle price target in play. #swingtrading

The trading area quad wall test (blue dotted diagonal line) is real. It could hold. If not it is down to lower target most likely.

But if it holds the path of least resistance is June 15 price cycle peak price target at 74.46.

Also of note the historical pivot / support is the horizontal white dotted line.

Huge risk reward advantage here for bull side trade.

HOWEVER, the 200 MA on daily has been lost so watch that as significant upside resistance test if price gets upward momentum.

AND, the MACD on daily is not crossed up as of yet.

$C, swingtrading, chart
$C Citi at a quad wall and historical support test. 74.46 June 15 time cycle price target in play. #swingtrading

There is a special report out to members on CitiGroup swing trading set-up here. Password: CITISWING

$AKTX – Akari Therapeutics

May 16 – Trading 1.92 and trade has been flat since last report. Will watch. No set-up now.

April 4 – Watching $AKTX quad wall support test VERY CLOSE here. Upside May 16 price target is near double.

With this chart set-up all they need is some PR news and it will go in my opinion.

Stochastic RSI on daily recently turned up but MACD is flat and SQZMOM trending down. Would be prudent to have all 3 turned up for a long.

$AKTX Buy / Sell Triggers:

Near trade buy triggers (Fibonacci support / resistance):

2.09

2.63

2.86

3.12

Significant upside resistance support areas:

4.105 is the 200 MA

4.90

5.42

8.80

9.21

9.52

10.62

11.91

12.19

14.11

https://www.tradingview.com/chart/AKTX/nz6zdTql-Watching-AKTX-quad-wall-support-test-VERY-CLOSE-here-Upside-pr/

Akari Therapeutics Announces Fourth Quarter and Full Year 2017 Financial Results and Highlights Recent Clinical Progress

https://finance.yahoo.com/news/akari-therapeutics-announces-fourth-quarter-110000635.html?.tsrc=rss

$AKTX, price target, swing trading, chart
Watching $AKTX quad wall support test VERY CLOSE here. Upside price target is near double.

Mar 1 – $AKTX Daily chart – price slumping in to time price cycle expiry at lower quad target.

$AKTX High probability of bounce off a Fib area soon in to time cycle target noted.

https://www.tradingview.com/chart/AKTX/2vVhjfA0-AKTX-High-probability-of-bounce-off-a-Fib-area-soon-in-to-time/

$DIS – Disney

May 16 – Same targets in play from April 4 review on Disney. Here’s a recent chart link;

https://www.tradingview.com/chart/DIS/KKAOnAHG-DIS-Buy-side-trigger-long-100-81-with-price-target-103-76-June/

Jim Cramer and technician Tim Collins take a close look at Disney’s stock chart to unpack a worrisome pattern.

Disney’s chart flashed the scariest pattern, but the stoc…

Disney almost at May 30 target now that is in the 103.80 area. $DIS

$DIS,
Disney almost at May 30 target now that is in the 103.80 area. $DIS

April 4 – $DIS trading 100.57 has MACD on daily targeting 103.89 110.64 May 30. #swingtrading Other targets noted.

Watch the 200 MA overhead as main resistance test on the way there.

2 Great Stocks You Can Buy and Hold Forever https://finance.yahoo.com/news/2-great-stocks-buy-hold-132100523.html?.tsrc=rss

https://www.tradingview.com/chart/DIS/241M4TSO-DIS-trading-100-57-has-MACD-on-daily-targeting-103-89-110-64-Ma/

$DIX, price targets, MACD, swingtrading
$DIS trading 100.57 has MACD on daily targeting 103.89 110.64 May 30. #swingtrading

Mar 1 – $DIS Stoch RSI turned down under 200 MA under mid quad bearish to targets.

This looks like a short to either target (follow price) if price stays under mid quad and 200 MA. It has been predictabiy hitting target areas.

$DIS News: Sky Is the Limit in Battle for Sky

https://www.tradingview.com/chart/DIS/ZnDXYcdX-DIS-Stoch-RSI-turned-down-under-200-MA-under-mid-quad-bearish-t/

$DIS, short, setup, swing
$DIS Stoch RSI turned down under 200 MA under mid quad bearish to targets.

$PSTG – Pure Storage

May 16 – How to Trade Pure Storage Earnings in 6 days $PSTG #swingtrading

There is a member post here also;

Protected: How to Trade Pure Storage Earnings in Six Days (Member Edition) $PSTG

Password: AI

https://www.tradingview.com/chart/PSTG/GLswoEx0-How-to-Trade-Pure-Storage-Earnings-in-6-days-PSTG-swingtrading/

PSTG closed 23.01 Tuesday with earnings in six days.

Important trade support is at 22.50 area (gray horizontal line) also marked with a white arrow.

White arrows are the most important buy sell triggers on the chart.

Above 22.50 (give it some room) it is a long to next resistance 24.00 area (horizontal lines on chart are resistance / support lines depending on what side of the line trade is on). Next on upside is 24.14 and then 25.12, then 25.44 and 25.91 area.

Under 22.50 area it targets support at 21.14 and then 21.00 then 20.03 and 19.71.

Price targets on model to bullish side are 25.91 and really bullish 29.19 Oct 1 2018. Trade toward target with price action using support and resistance points.

Downside scenario has 19.23 and 15.92 (most bearish) price targets Oct 1 2018.

May 14 Article:

Pure Storage Clears Data Bottlenecks On Road To Artificial Intelligence https://www.investors.com/research/the-new-america/pure-storage-artificial-intelligence/?src=A00220&yptr=yahoo

$PSTG, pure storage, chart, earnings, trade
How to Trade Pure Storage Earnings in 6 days $PSTG #swingtrading

April 4 – $PSTG indecisive trade but MACD on daily may turn up here. Long over 50 MA.

Why You Should Retain Pure Storage in Your Portfolio Now https://finance.yahoo.com/news/why-retain-pure-storage-portfolio-130101121.html?.tsrc=rss

https://www.tradingview.com/chart/PSTG/dvGKmWsB-PSTG-indecisive-trade-but-MACD-on-daily-may-turn-up-here-Long/

$PSTG, chart
https://www.tradingview.com/chart/PSTG/dvGKmWsB-PSTG-indecisive-trade-but-MACD-on-daily-may-turn-up-here-Long/

$DXY US Dollar Index $UUP

May 16 – Path of least resistance of US Dollar on weekly chart is 200 MA at 94.80 area. $DXY

SQZMOM has also turned green. Watching for continuation here.

US Dollar, weekly, chart
Path of least resistance of US Dollar weekly chart 200 MA 94.80 area $DXY

April 4 – $DXY US Dollar sideways range bound trading.

$DXY, US Dollar, chart
$DXY US Dollar sideways range bound trading.

$XAUUSD #Gold $GLD $UGLD $DGLD

May 16 – Gold. Monthly. $XAUUSD $GC_F $GLD $NUGT $DUST $JDST $JNUG #Gold

https://www.tradingview.com/chart/XAUUSD/SDRxRcdD-Gold-Monthly-XAUUSD-GC-F-GLD-NUGT-DUST-JDST-JNUG-Gold/

Gold monthly chart.

Gold monthly chart.

April 4 – Gold in a long drawn out range bound decision that should conclude soon. $XAUUSD #Gold $GLD $GC_F

No bias to conclusion as of yet.

https://www.tradingview.com/chart/XAUUSD/mptMsFti-Gold-in-a-long-drawn-out-range-bound-decision-that-should-conclu/

Gold, chart
Gold in a long drawn out range bound decision that should conclude soon. $XAUUSD #Gold $GLD $GC_F

$MXIM – MAXIM Integrated Products

May 16 – $MXIM over 20 MA on weekly is a long to 61.38 area. Pivots noted on chart.

Maxim Integrated’s Automotive Business Makes It a Buy https://finance.yahoo.com/news/maxim-integrated-automotive-business-makes-220500817.html?.tsrc=rss

$MXIM over 20 MA on weekly is a long to 61.38 area. Pivots noted on chart.

April 7 – $MXIM under 55.94 short side looks great. MACD turn. See Chart notes. #swingtrading

https://www.tradingview.com/chart/MXIM/l2JjyH3X-MXIM-under-55-94-short-side-looks-great-MACD-turn-Chart-notes/

$MXIM, chart, swing, short
$MXIM below 55.94 short side trade looks decent w MACD turned down on Weekly. Above 56.00 tough. #swingtrading

Mar 1 – $MXIM trade between the horizontal support and resistance lines.

https://www.tradingview.com/chart/MXIM/jZWbQmDZ-MXIM-trade-between-the-horizontal-support-and-resistance-lines/

$MXIM, trading, support, resistance
$MXIM trade between the horizontal support and resistance lines.

$ATHM – AutoHome

May 16 – Next resistance on $ATHM 110.38 – 110.43 on weekly chart model. Not much to report, it’s a long timed as best as you can and trim in to each resistance. Or wait for it to cool and then long it.

Autohome Quarterly Earnings Beat Estimates, Guides Higher https://finance.yahoo.com/m/8b2f7f27-3393-319d-80b9-4373aa52d5a8/autohome-quarterly-earnings.html?.tsrc=rss

If it comes off here it has support at 100.85 for a long side bounce test.

https://www.tradingview.com/chart/ATHM/TZltfarE-Next-resistance-on-ATHM-110-43/

$ATHM, weekly, chart
Next resistance on $ATHM 110.43

April 8 – $ATHM range bound trade in upper resistance area for some time. Looking for upside break or dump. Also of note, the Stochastic RSI is curling up here so the upside break could be soon but yet to be seen. No trade yet.

News: Why Autohome ($ATHM) Could Shock the Market Soon https://finance.yahoo.com/news/why-autohome-athm-could-shock-125412269.html?soc_src=social-sh&soc_trk=tw

$ATHM, daily, chart
$ATHM range bound trade in upper resistance area for some time. Looking for upside break or dump.

$BWA – BorgWarner

May 18 – $BWA MACD trending up with Stoch RSI high, price target July 19 52.75 bullish 58.11 bearish 50.63. #swingtrading

Prefer for the Stoch RSI to be at bottom curling up for a long. Really nice action between buy sell triggers last while – wish I had caught these trades. Nonetheless, I have the triggers alarmed now. The range on this trading is excellent and the buy sell triggers are working great.

A move to the bullish upside target of 58.11 for July 19 would be excellent. Will let the chart tell the story.

Free Post Earnings Research Report: BorgWarner’s Sales Jumped 15.7%; EPS Surged 21% https://finance.yahoo.com/news/free-post-earnings-research-report-113000439.html?.tsrc=rss

https://www.tradingview.com/chart/BWA/E3PpDRS5-BWA-MACD-trending-up-with-Stoch-RSI-high-price-target-July-19/

$BWA, swingtrading, chart
$BWA MACD trending up with Stoch RSI high, price target July 19 52.75 bullish 58.11 bearish 50.63. #swingtrading

April 8 – $BWA structural trading upside quad test breaks targets 54.32 July 19. 50.56 46.68 if fail. MACD up. Stoch RSI short term sell.

Long at quad wall (blue diagonal dotted line) and short at top of quad until either breaks and go in direction of trade to next target.

On high watch here for me. Very, very nice structure.


https://www.tradingview.com/chart/BWA/OpKeTVFM-BWA-structural-trading-upside-quad-test-breaks-targets-54-32-Ju/

$BWA, chart, setup
$BWA structural trading upside quad test breaks targets 54.32 July 19. 50.56 46.68 if fail. MACD up. Stoch RSI short term sell.

Mar 1 – $BWA Under serious pressure with DOW slump and on 200 MA on Daily. Likely down further.

$BWA on weekly watching for possible bounce at 50 or 200 MA but MACD turned down.

$BWA, pressure, chart, daily, 200MA
$BWA Under serious pressure with DOW slump and on 200 MA. Likely down further.

News on BorgWarber (BWA)

BorgWarner Inc. (BWA) has an Earnings ESP of +0.47% and a Zacks Rank #3. 

Headquartered in Auburn Hills, MI, BorgWarner is a leading manufacturer of powertrain products for major automakers. The company is expected to report fourth-quarter 2017 results on Feb 8.

BorgWarner supports initial launch of world’s first series-produced all-electric light-duty truck

BorgWarner, a global leader in clean and efficient technology solutions for combustion, hybrid and electric vehicles, supplies its HVH250 electric motor and eGearDrive® transmission for the initial launch of the FUSO eCanter truck, the world’s first series-produced all-electric light-duty truck.

Are Options Traders Betting on a Big Move in BorgWarner (BWA) Stock?

Clearly, options traders are pricing in a big move for BorgWarner, but what is the fundamental picture for the company? Currently, BorgWarner is a Zacks Rank #2 (Buy) in the Automotive – Original Equipment industry that ranks in the Top 40% of our Zacks Industry Rank. Over the last 60 days, two analysts have increased their earnings estimates for the current quarter, while none has dropped them.

$LIT  – Global Lithium

May 18 – $LIT I like on the weekly chart. Over 20 and 50 MA with MACD crossed up, Stoch RSI up, SQZMOM up is a long imo. #swingtrading

https://www.tradingview.com/chart/LIT/2h0gxfwW-LIT-I-like-on-the-weekly-chart-Over-20-and-50-MA-with-MACD-cro/

$LIT, swing, trading, chart
$LIT I like on the weekly chart. Over 20 and 50 MA with MACD crossed up, Stoch RSI up, SQZMOM up is a long imo. #swingtrading

April 8 – $LIT Short side RR is low here and long to risky until Stoch RSI and MACD cross up.

$LIT, chart
$LIT Short side RR is low here and long to risky until Stoch RSI and MACD cross up.

$BA – Boeing

May 18 – $BA on the daily chart the indicators look okay but on weekly I will wait for MACD to turn up before considering a trade.

https://www.tradingview.com/chart/BA/MWBGDjYd-BA-on-the-daily-chart-the-indicators-look-okay-but-on-weekly-I/

April 8 – $BA great long trade since alerted near a year ago but now MACD turning down. Short side bias. Will alert.

$BA, chart
$BA great long trade since alerted near a year ago but now MACD turning down. Short side bias. Will alert.

Mar 1 – Trading 262.21 with indecisive indicators. Watching.

Jan 23 – $BA Boeing trading 338.00 with Stoch RSI turned down, MACD and SQZMOM extended. Assess when Stoch RSI curls up.

$BA, stock, chart, daily
$BA Boeing trading 338.00 with Stoch RSI turned down, MACD and SQZMOM extended. Assess when Stoch RSI curls up.

Nov 14 – Trading 262.28 and all indicators in my opinion are extended / tired to bull side. I may be wrong, but I don’t see any great risk reward thesis available to long or short side right now.

$EXK – EXK Silver Mining

May 18 – $EXK Price has to be over 100 MA on weekly chart and Stochastic RSI turned up before I consider a long side swing trade.

5 Shining Silver Stocks to Buy Today https://finance.yahoo.com/news/5-shining-silver-stocks-buy-182123954.html?.tsrc=rss

https://www.tradingview.com/chart/EXK/l5wTBUsm-EXK-Price-has-to-be-over-100-MA-on-weekly-chart-and-Stochastic/

$EXK, weekly, chart, swing, trade
$EXK Price has to be over 100 MA on weekly chart and Stochastic RSI turned up before I consider a long side swing trade.

April 8 – $EXK in compression mode between 20 MA and 50 MA. Watching.

$EXK, chart
$EXK in compression mode between 20 MA and 50 MA. Watching.

$BABA – Alibaba

May 18 – This daily chart for shorts looks dangerous. When that Stoch RSI turns back up it’s likely over for the shorts $BABA 

On HIGH WATCH for a long side trade if that Stoch RSI turns back and the indicators look favorable at the time.

$BABA Alibaba Group Holding Ltd Is Itching for a Breakout #swingtrading https://finance.yahoo.com/news/alibaba-group-holding-ltd-itching-171351920.html?.tsrc=rss https://twitter.com/swingtrading_ct/status/997325029087105025 

$BABA Alibaba Group Holding Ltd Is Itching for a Breakout #swingtrading https://t.co/fSNaycTVOi

— Swing Trading (@swingtrading_ct) May 18, 2018

https://www.tradingview.com/chart/BABA/pPDOzr4p-This-daily-chart-for-shorts-looks-dangerous-When-that-Stoch-RSI/

$BABA, daily, chart, swing, trade
This daily chart for shorts looks dangerous. When that Stoch RSI turns back up it’s likely over for the shorts $BABA

April 8 – $BABA is short side bias but Stoch RSI likely turns soon for a pop and 200 MA test and likely short there.

$BABA Chart
$BABA is short side bias but Stoch RSI likely turns soon for a pop and 200 MA test and likely short there.

April 8 – $BABA 50 MA on weekly is a likely temporary bounce and then likely down. #swingtrading

$BABA, weekly, chart, 50 MA
$BABA 50 MA on weekly is a likely temporary bounce and then likely down. #swingtrading

$FB Facebook

May 18 – As of today, we are adding regular rotation coverage to the Facebook stock.

This special swing trading report was published to our blog on April 11, 2018: $FB Facebook Long Set-Up Testing Buy Sell Trigger #swingtrading (Public Edition) https://compoundtrading.com/fb-facebook-long-set-testing-buy-sell-trigger-swingtrading-public-edition/

$FB Facebook Long Set-Up Testing Buy Sell Trigger Now #swingtrading (Public Edition) https://t.co/BOTYihemqe

— Swing Trading (@swingtrading_ct) April 11, 2018

#FB Facebook move has been… exceptional trading opportunity. #washout #snapback #trading #swingtrading pic.twitter.com/s5abkE7vkg

— Melonopoly (@curtmelonopoly) May 18, 2018

Since the May 11 article we have successfully traded the wash-out snap-back swing trade in $FB. First part of the move here.

$FB, washout, snapback, swingtrade
Since the May 11 article we have successfully traded the wash-out snap-back swing trade in $FB. First part of the move here.

$FB has now retraced to near mid quad support price target 181.72 for May 18. New price targets for June 4 time cycle on chart.

https://www.tradingview.com/chart/FB/Fni7TJ2S-FB-has-now-retraced-to-near-mid-quad-support-price-target-181-7/

June 4 bullish price target is 196.00, sideways chop target 181.72 and bearish is 167.54.

Main support in this trading structure is 181.72. Under that the next support is at 178.29. Above you have resistance at 184.89, 189.10, 189.60.

$FB, price targets, swing trade
$FB has now retraced to near mid quad support price target 181.72 for May 18. New price targets for June 4 time cycle on chart.

Recent Trade Alerts / Chart Set-Up Posts:

The recent trade alerts will be updated soon.

$GDX Gold Miners (public alert, not on private Swing Trading Twitter Feed)

1:08 PM – 1 Apr 2018

This, one of the cleanest easiest trades in market. Chart notes. – #GDX chart

This, one of the cleanest easiest trades in market. Chart notes. – #GDX chart https://t.co/tbZte7ikx8

— Melonopoly (@curtmelonopoly) April 1, 2018

11:51 AM – 8 Apr 2018

$GDX 50 MA Test, Structure in Play – One of the Cleanest, Easiest Trades on the Market. See Chart Notes. $NUGT $DUST $JDST $JNUG $GLD #GOLD https://www.tradingview.com/chart/GDX/xqvoPTby-50-MA-Test-Structure-in-Play-Top-10-Easiest-Trades-See-Notes/ …

$GDX 50 MA Test, Structure in Play – One of the Cleanest, Easiest Trades on the Market. See Chart Notes. $NUGT $DUST $JDST $JNUG $GLD #GOLD https://t.co/EX9GrJPGPK pic.twitter.com/uNM4IIwwCY

— Rosie the Gold Algo (@ROSIEtheAlgo) April 8, 2018

$GDX, swing, trading, alert
$GDX 50 MA test, structure in play – one of the cleanest, easiest trades on the market $NUGT $DUST $JDST $JNUG $GLD

$C Citi

2:33 PM – 4 Apr 2018

Citi quad wall & historical support near. 74.46 PT Chart notes. – #C chart

http://www.tradingview.com/chart/C/qRDWOlvu-Citi-quad-wall-historical-support-near-74-46-PT-Chart-notes/ … …

$C Citi at a quad wall and historical support test here. 74.46 June 15 time cycle price target in play. #swingtrading

https://twitter.com/SwingAlerts_CT/status/981600758792642562

11:31 AM – 5 Apr 2018

$C Citi 70.75 HOD puts it up on day 2% from yesterday alert. Watch the 200 MA resistance overhead.

https://twitter.com/SwingAlerts_CT/status/981917242467213313

$C, Citi, swing, trading, alert
$C Citi 70.75 HOD puts it up on day 2% from yesterday alert. Watch the 200 MA resistance overhead.

$SPY SP500

9:40 AM – 28 Mar 2018 (originally on daytrading alert feed copied to Swing Trading alert feed also)

Trading 260.41 intra. $SPY Time cycle peak on this simple model is now. If its going to follow channel up it will be soon that it starts. If not, it could be another channel down yet. https://www.tradingview.com/chart/SPY/IDiDMAVs-SPY-Time-cycle-peak-on-this-simple-model-is-now-If-its-going-t/ …

https://twitter.com/DayAlerts_CT/status/978990333278253056/photo/1

11:28 AM – 5 Apr 2018

$SPY strong trade set-up from recent alerts intra 266.42 with 268.00 resistance on deck.

https://twitter.com/SwingAlerts_CT/status/981916489212100608

$SPY, swing, trading, alert
$SPY strong trade set-up from recent alerts intra 266.42 with 268.00 resistance on deck..png

$TSLA Tesla

3:11 PM – 4 Apr 2018

$TSLA long confirming here over 280.55 with 304.17 next resistance 382 Nov 15 price target. https://www.tradingview.com/chart/TSLA/dn8THUSe-TSLA-long-confirming-here-over-280-55-with-304-17-next-resistan/ …

https://twitter.com/SwingAlerts_CT/status/981610107770429443

11:23 AM – 5 Apr 2018

$TSLA also blasting here from yesterday’s alert trade hit intra resistance at 299.84 area. Strong set-up.

https://twitter.com/SwingAlerts_CT/status/981915345802973184

$TSLA, swing, trading, alert
$TSLA also blasting here from yesterday’s alert trade hit res at 299.84 area. Strong set-up.

$DIS Disney

3:24 PM – 4 Apr 2018

$DIS trading 100.57 has MACD on daily targeting 103.89 110.64 May 30. #swingtrading Other targets noted. https://www.tradingview.com/chart/DIS/241M4TSO-DIS-trading-100-57-has-MACD-on-daily-targeting-103-89-110-64-Ma/ …

https://twitter.com/SwingAlerts_CT/status/981613492896755713

11:22 AM – 5 Apr 2018

$DIS swing trade set-up from swing trading report yesterday blasting here. Nice set-up. Trading 101.81 intra-day.

https://twitter.com/SwingAlerts_CT/status/981914928528416768

$DIS, swing, trading, alert
$DIS swing trade set-up from swing trading report yesterday blasting here. Nice set-up..png

$CELG Celgene

5:56 PM – 26 Mar 2018

$CELG hit last price target – targets 95.90 Apr 3. Chart notes. https://www.tradingview.com/chart/CELG/RwZItPb8-CELG-hit-last-price-target-targets-95-90-Apr-3-Chart-notes/ …

https://twitter.com/SwingAlerts_CT/status/978390139201302529

1:21 PM – 8 Apr 2018

$CELG 86s to 91s off alert, buy sell trigger now. Waiting for trade direction triggers. Chart Notes. https://www.tradingview.com/chart/CELG/gdKoFxEq-CELG-86s-to-91s-off-alert-buy-sell-trigger-now-Chart-Notes/

https://twitter.com/SwingAlerts_CT/status/983031984753692672

$CELG, swing, trading, alert
$CELG 86s to 91s off real-time alert, buy sell trigger now. Looking for next price target in time cycle. #swingtrading

$FB Facebook

Buy side of $FB has started again in 164 range now… in a snap back long watch 167.50 mid quad resistance very closely.

12:17 PM – 20 Mar 2018

https://twitter.com/SwingAlerts_CT/status/976130671176450051

4:43 PM – 20 Mar 2018

$FB bounced off buy side alert earlier in 164s now trading 168.15 above mid quad support. #snapback #trading #alert

https://twitter.com/SwingAlerts_CT/status/976197473030037504

$FB, trading, alert, swing
$FB bounced off buy side alert earlier in 164s now trading 168.15 above mid quad support. #snapback #trading #alert

Email or DM me on Twitter anytime with thoughts or questions!

Cheers!

Curtis

Temporary Promo Discounts (for new members only).

Subscribe to Weekly Swing Trading Newsletter service here Reg 119.00. Promo Price 83.30 (30% off). Promo Code “30P”. 

Or Real-Time Swing Trading Alerts Reg 99.00. Promo Price 69.37 (30% off). Promo Code “Deal30”.

I personally guarantee our swing trading service is one of the best in the business and it’s very reasonably priced considering the technical expertise invested in the platform (Lead Trader).

Subscribe to Swing Trading Service:

Swing Trading Bundle (Swing Trading Newsletter and Live Swing Trading Alerts).

Swing Trading Newsletter (Weekly Newsletter Published for Traders).

Real-Time Swing Trading Alerts (Private Member only Twitter Feed).

One-on-One Trade Coaching (Via Skype or In-Person).

Free Mailing List(s):

Join Email List for Free Trade Charting Trade Set-ups, Deals, Podcasts and Public Webinars.

Free Swing Trading Periodical Contact Form (Complimentary Swing Trade Set-Ups to Email)

Public Chat:

Visit our Free Public Chat Room on Discord.

Follow Me:

Tweets by swingtrading_ct

Article Topics; Compound Trading, Swing, Trading, Stock, Picks, Alerts, $FB, $BABA, $EXK, $BA, $LIT, $BWA

Read More
PreMarket Trading Plan Thurs May 17: Treasury, Oil, Wallmart, $WMT, $AMBA, $AMD, $NERV, $BDSI, $BLNK, $LOXO more.

PreMarket Trading Plan Thurs May 17: Treasury, Oil, Wallmart, $WMT, $AMBA, $AMD, $NERV, $BDSI, $BLNK, $LOXO more.

May 17, 2018June 9, 2018 Curt MelonopolyTrading Plan$AMBA, $AMD, $BDSI, $BLNK, $LOXO, $NERV, $WMT, Oil, Plan, Premarket, Stocks, Trading, Treasury, Wallmart, Watchlist

Compound Trading Trading Plan and Watch List Thursday May 17, 2018. 

In this edition: Treasury, Oil, Wallmart, $WMT, $AMBA, $AMD, $NERV, $BDSI, $BLNK, $LOXO, $DIS, $LAC, $AAOI, $SPY, $WTI, $VIX, Gold, Silver, Bitcoin and more.

Welcome to the morning Wall Street trading day session at Compound Trading!

Notices:

Quick Update: Reporting, Live Rooms, New Team Members, Pricing, Discounts, Trade Coaching, New Book https://compoundtrading.com/quick-update-reporting-live-rooms-new-team-members-pricing-discounts-trade-coaching-new-book/

What’s New at Compound Trading April / May 2018. https://compoundtrading.com/whats-new-at-compound-trading-april-may-2018/

Price Increase: Platform wide price increase May 15, 2018. Does not affect existing members. Official announcement to follow.

Machine Trading: May 15, 2018 the new teams start. Mandate: (1) Intelligent Assisted #IA Trading Platform (Code Algorithm Models), (2) Run 24 Hour Crypto Trading Desk, (3) Alert Trade Set-ups to Member Alert Feeds (for all models) and near future (4) Machine Learning. Official announcement to follow.

Notes in red text below are new comments entered specifically today (or recently important).

Live Trading Room Link:

http://compoundtrading1.clickmeeting.com/livetrading

Real-time Alerts for Oil, Gold, Swing Trading, Day Trading, Bitcoin are available by following specific alert Twitter feeds.

Disclaimer / disclosure: Every subscriber must read this disclaimer.

Reporting and Next Gen Algorithms:

BE SURE to get in to each private Discord server specific to your subscription as many of the updates as we go forward will be posted in there. This includes the SWING TRADING platform also.

IF YOU NEED A LINK / INVITE email or DM us!

Connect with us on Discord.

https://twitter.com/CompoundTrading/status/880670140454637569

Recent Blog / Video / Social Posts: 

#BitcoinTrading 101: A Beginner’s Guide to Getting Started $BTCUSD $XBTUSD $BTC https://compoundtrading.com/bitcointrading-101-beginners-guide-getting-started-btcusd-xbtusd-btc/ …

https://twitter.com/CompoundTrading/status/927397024315662336

How to Use EPIC Oil Algorithm: $USOIL, $WTI, $CL_F, $USO, $UCO, $SCO, $UWT, $DWT, #OIL, #OOTT: http://youtu.be/hawVV31G9bg?a via @YouTube

https://twitter.com/CompoundTrading/status/889148655785177088

How to Use ROSIE Gold Algorithm: #GOLD, $GLD, $XAUUSD, $GDX, $GDXJ, $NUGT, $DUST, $JNUG, $JDST

https://twitter.com/CompoundTrading/status/889147527278333952

Recent Chart / Trade Set-Ups: 

See You Tube for other recent video posts. 

Password: SET Protected: Swing Trade Set-Ups (May 15/16 Member Edition) $WTI, #OIL, $BTC, Bitcoin, $AMBA, $AMD, $BLNK, $ITCI,, $SPY, $DIS, $LAC, $BOX, $AAOI more.

Password: AI Protected: How to Trade Pure Storage Earnings in Six Days (Member Edition) $PSTG

Password ITCI: Protected: Trade Set-Ups (May 14 /15 Member Edition) $BOX, $ITCI, $SPY, $EEM, $PFE, $BTC, Bitcoin, SILVER, $SLV, $ETH, Ethereum, $EOG, $EDIT, $EXP more.

Password: WOW Protected: How to Trade Box Earnings Move (Swing Trade Member Exclusive)

Protected: Trade Set-Ups (May 8 Member Edition) $AAPL, $DIS, $AMD, $ITCI, $AAOI, $SNAP, $FB, $TSLA, $EDIT, $ESPR, $LITE, $LPSN, $SPY.

May 7 – Trade Set-Ups, Consolidated Review $SPY, $AAPL, $TSLA, $SNAP, OIL, $DXY, $VIX, GOLD, $DIS, Silver more.

Trading Set-ups $FB, $AMBA, $SDTY, $TSLA, $GDX, $SLV, $BTC, $JD, $VIX, $LITE, $CELG, $FSLR more.

Do Not Ignore This Trade Set-Up | $AMBA Swing Trade | 40% ROE 3 Mos (Part 1 of 2)

Password: ELON Protected: How to Trade the Tesla Move | Price Targets | Buy Sell Triggers | Time Cycles $TSLA #swingtrading #daytrading

Password: LONG Protected: Overnight Oil Trade | Trading Plan in Detail | EPIC Oil Algorithm $USOIL $WTI $CL_F #OIL $USO #Alerts

Trade Set-ups $SPY, $NFLX, OIL, $WTI, $ESPR, $GOOGL, Bitcoin, $BTC, $FEYE, $AAPL and more.

Trading Set-Ups $SPY, Gold, $GC_F, $GDX, Bitcoin, $GOOGL, $EVLV, $HEAR, $CHEK, $MARA, $PRTA, $ZDGE

Trading Set-Ups $NETE, $TSG, $ETH Ethereum, $BTC Bitcoin, $TAN, $HEAR, $AMMJ, $SNAP, $VLRX

Trade Set-Ups OIL, $WTI, $SPY, $GOOGL, $FSLR, $AXP, $GREK, $CELG, $AAOI, $SDRL, $WFT

Great Trading Last Few Wks – Lets Keep Going! $RIG, #OIL, $SPY, $ETH, $BTC, $FB, $GOOGL, $BWA, $GDX more.

Recent Educational Articles / Videos:

I get a lot of Q’s on How to Trade our models, this vid has 5 min explanation at 1:00 min-6:00 min. https://www.youtube.com/watch?v=QrXbE7lojAg&t=3s … – Fib Trendlines, Trading structure/quads, Price targets, Main support resistance (buy sell triggers), Time cycles, Moving averages, Trading trims/adds.

I get a lot of Q's on How to Trade our models, this vid has 5 min explanation at 1:00 min-6:00 min. https://t.co/oqezvVcn0y … – Fib Trendlines, Trading structure/quads, Price targets, Main support resistance (buy sell triggers), Time cycles, Moving averages, Trading trims/adds.

— Melonopoly (@curtmelonopoly) May 13, 2018

Trading Plan (Buy, Hold, Sell) Watch Lists. Morning Momentum / Gap / News / PR / IPO / SEC Filings / Earnings Stocks on Watch: 

Stocks making the biggest moves premarket: WMT, CSCO, F, KO, CMCSA, JACK & more – https://www.cnbc.com/2018/05/17/stocks-making-the-biggest-moves-premarket-wmt-csco-f-ko-cmcsa-jack-more.html

Premarket analyst action – healthcare https://seekingalpha.com/news/3357589-premarket-analyst-action-healthcare?source=feed_f … #premarket $ALGN $HSDT $BAX $JNCE

Market Observation:

As of 8:12 AM: US Dollar $DXY trading 93.32, Oil FX $USOIL ($WTI) trading 72.14, Gold $GLD trading 1289.07, Silver $SLV trading 16.42, $SPY 271.74, Bitcoin $BTC.X $BTCUSD $XBTUSD 8300.50 and $VIX trading 13.6.

Momentum Stocks to Watch: 

News: 

$CHEK, $DAN, $HUYA, $PRPO

Rising Treasury yields take the shine off record earnings for stocks https://bloom.bg/2k2A5rR

Rising Treasury yields take the shine off record earnings for stocks https://t.co/fqBTrCu2j2 pic.twitter.com/mLnnB7iWdn

— Bloomberg Markets (@markets) May 17, 2018

Walmart shares rise on earnings beat, as US e-commerce push pays off

Walmart shares rise on earnings beat, as US e-commerce push pays off https://t.co/gNIOuwFrGT

— CNBC (@CNBC) May 17, 2018

Endocyte’s radiotherapeutic 177Lu-PSMA-617 shows positive effect in mid-stage prostate cancer st… https://seekingalpha.com/news/3357580-endocytes-radiotherapeutic-177lu-psmaminus-617-shows-positive-effect-mid-stage-prostate?source=feed_f … #premarket $ECYT

$RARE and Kyowa Kirin Announce Topline Phase 3 Study Results Demonstrating Superiority of Crysvita® (burosumab) Treatment to Oral Phosphate and Active Vitamin D in Children with X-Linked Hypophosphatemia (XLH)

Recent SEC Filings: 

Recent IPO’s:

Earnings: 

upcoming #earnings

$WMT $CSCO $JCP $TTWO $BZUN $NTES $KEM $JACK $ALBO $MANU $PLCE $FLO $TISA $TGP $TNK $TK $ACXM $TOO $JE $ENS $DLNG

also $VBLT $ECC $OXLC

http://eps.sh/cal

upcoming #earnings$WMT $CSCO $JCP $TTWO $BZUN $NTES $KEM $JACK $ALBO $MANU $PLCE $FLO $TISA $TGP $TNK $TK $ACXM $TOO $JE $ENS $DLNG

also $VBLT $ECC $OXLChttps://t.co/lObOE0dgsr pic.twitter.com/lxVIG7y06E

— Earnings Whispers (@eWhispers) May 16, 2018

#earnings for the week

$WMT $HD $AMAT $CSCO $M $JCP $DE $TTWO $BZUN $MZOR $NTES $KEM $A $VIPS $CSIQ $LONE $HQCL $MARK $SORL $JWN $DGLY $EXP $SWCH $AZN $CPB $NM $GDP $BCLI $MGIC $TGEN $KMDA $JACK $ATNX $HTHT $MANU $NINE $MTBC $VRTU $RXN $AMRS $FLO

http://eps.sh/cal

#earnings for the week $WMT $HD $AMAT $CSCO $M $JCP $DE $TTWO $BZUN $MZOR $NTES $KEM $A $VIPS $CSIQ $LONE $HQCL $MARK $SORL $JWN $DGLY $EXP $SWCH $AZN $CPB $NM $GDP $BCLI $MGIC $TGEN $KMDA $JACK $ATNX $HTHT $MANU $NINE $MTBC $VRTU $RXN $AMRS $FLO https://t.co/r57QUKKDXL https://t.co/EFUpuZmWFi

— Melonopoly (@curtmelonopoly) May 14, 2018

Trade Set-up Alerts, Charts & Reports. Recent / Current Holds, Open and Closed Trades:

$AMD triggering long side add over 12.80 targeting 13.47 13.60 with significant resistance 14.62 #swingtrading

$AMD triggering long side add over 12.80 targeting 13.47 13.60 with significant resistance 14.62 #swingtrading

Disney over 200 MA over 103.76 resistance trading 103.96 targets 105.28 next resistance #swingtrading $DIS

Disney over 200 MA over 103.76 resistance trading 103.96 targets 105.28 next resistance #swingtrading $DIS

Intra Cellular over 21.24 resistance trading 21.36 next target 22.28 and main price target resistance 23.80. #swingtrading

Intra Cellular over 21.24 resistance trading 21.36 next target 22.28 and main price target resistance 23.80. #swingtrading

Intra day chart model update for $BOX swing trade #swingtrading #daytrading

Intra day chart model update for $BOX swing trade #swingtrading #daytrading

$AMBA over 51.60 mid quad res over 200 MA trading 52.19 HOD targeting 54.25 54.75 58.66 #swingtrading

$AMBA over 51.60 mid quad res over 200 MA trading 52.19 HOD targeting 54.25 54.75 58.66 #swingtrading

$AAOI hit HOD 33.12 at resistance above targets 37.27 38.69 40.11 200 MA 49.56 July 4 unlikely #swingtrading

$AAOI hit HOD 33.12 at resistance above targets 37.27 38.69 40.11 200 MA 49.56 July 4 unlikely #swingtrading

$LAC Lithium trading 6.30 power bounce off mid quad 5.40 targeting 6.43 6.54 200 MA res, Jan 1 price targets 7.81 12.60

$LAC Lithium trading 6.30 power bounce off mid quad 5.40 targeting 6.43 6.54 200 MA res, Jan 1 price targets 7.81 12.60

Per recent;

$MXIM over 20 MA on weekly is a long to 61.38 area. Pivots noted on chart.

$MXIM over 20 MA on weekly is a long to 61.38 area. Pivots noted on chart.

Path of least resistance of US Dollar weekly chart 200 MA 94.80 area $DXY

Path of least resistance of US Dollar weekly chart 200 MA 94.80 area $DXY

Disney almost at May 30 target now that is in the 103.80 area. $DIS

Disney almost at May 30 target now that is in the 103.80 area. $DIS

Trade just hit 71.16, remember to take profits on the way. Oil Trade Alert – EPIC Oil Algorithm $USOIL $WTI $CL_F #OOTT #OIL $USO $UWT $DWT

Trade just hit 71.16, remember to take profits on the way. Oil Trade Alert – EPIC Oil Algorithm $USOIL $WTI $CL_F #OOTT #OIL $USO $UWT $DWT

CITI bought conistently at historical support noted previous. MACD trend up. Resistance above. Riding 200 MA. $C

CITI bought conistently at historical support noted previous. MACD trend up. Resistance above. Riding 200 MA. $C

Long side starter 71.01 target 71.59 per chart. Oil Trade Alert – EPIC Oil Algorithm $USOIL $WTI $CL_F #OOTT #OIL $USO $UWT $DWT

Long side starter 71.01 target 71.59 per chart. Oil Trade Alert – EPIC Oil Algorithm $USOIL $WTI $CL_F #OOTT #OIL $USO $UWT $DWT

Oil reaching for EPIC Tues 430 price target from Sunday report $USOIL $WTI $CL_F #OOTT #OIL $USO $UWT $DWT 

Oil reaching for EPIC Tues 430 price target from Sunday report $USOIL $WTI $CL_F #OOTT #OIL $USO $UWT $DWT

Swing trade $EXP excellent swing trade over buy side 106.10 trim in to 112.28 resistance, next 177.70 major res.

Swing trade $EXP excellent swing trade over buy side 106.10 trim in to 112.28 resistance, next 177.70 major res.

Per recent;

$DIS long side trade doing well – IT IS AT a trim in to 200 MA zone intraday now.

$DIS, chart
$DIS long side trade doing well – IT IS AT a trim in to 200 MA zone intraday now.

$ITCI cleared the 50 MA getting in to first intra day resistance at red horiz lines

$ITCI cleared the 50 MA getting in to first intra day resistance at red horiz lines

$EDIT flying here hit 37.20 trim in to 37.60 add above – it’s a power move and thats mid quad resistance

$EDIT flying here hit 37.20 trim in to 37.60 add above – it’s a power move and thats mid quad resistance

$SPY up and over adds to next resistance 274.51 trim in to it add above

$SPY up and over adds to next resistance 274.51 trim in to it add above

$HTZ trading 17.89 premarket – trim in to 50 MA on hourly add above.

$HTZ trading 17.89 premarket – trim in to 50 MA on hourly add above.

Per recent;

$BOX Weekly Algorithmic Model Chart #earnings #trading

BOX, earnings, trade, set-up, howto
$BOX Weekly Algorithmic Model Chart #earnings #trading

Gold. Monthly. $XAUUSD $GC_F $GLD $NUGT $DUST $JDST $JNUG #Gold

Gold. Monthly. $XAUUSD $GC_F $GLD $NUGT $DUST $JDST $JNUG #Gold

Simple symmetrical time cycle on weekly, Volatility reversal leading in to July 23 ish probable. $VIX $UVXY $TVIX

Simple symmetrical time cycle on weekly, Volatility reversal leading in to July 23 ish probable. $VIX $UVXY $TVIX

$VIX under moving averages on Daily Chart and under lower bollinger. Long bias RR setting in.

$VIX under moving averages on Daily Chart and under lower bollinger. Long bias RR setting in.

Doesn’t really matter how you draw the lines – there’s a decision coming on Silver Weekly Chart. #Silver $SLV $USLV $DSLV

Doesn’t really matter how you draw the lines – there’s a decision coming on Silver Weekly Chart. #Silver $SLV $USLV $DSLV

Massive time cycle comes due late July on Gold Daily. Structure in place still. May 14 218 AM #Gold $GLD $GC_F $XAUUSD $NUGT $DUST

Massive time cycle comes due late July on Gold Daily. Structure in place still. May 14 218 AM #Gold $GLD $GC_F $XAUUSD $NUGT $DUST

With earnings on deck this week watch this one close. 118.00 upside 93.00 downside. Good range. $EXP

With earnings on deck this week watch this one close. 118.00 upside 93.00 downside. Good range. $EXP

$CALA targeting 3.00 range July 6. Trending down quad wall near perfect. Watch for bounce. #swingtrading

$CALA targeting 3.00 range July 6. Trending down quad wall near perfect. Watch for bounce. #swingtrading

Bull bear fight is on with dollar closing the week at the 50 MA. Watch that close. $DXY $UUP

Bull bear fight is on with dollar closing the week at the 50 MA. Watch that close. $DXY $UUP

$SPY Daily Chart, ending week bullish with a break above upper TL and 20 MA near breach 50 MA. $ES_F $SPXL $SPXS

$SPY Daily Chart, ending week bullish with a break above upper TL and 20 MA near breach 50 MA. $ES_F $SPXL $SPXS

Oil Monthly. Right at pivot, between 100 MA Resistance 200 MA Support. MACD SQZMOM trending up Stoch high. $USOIL $WTI $USO #OIL

Oil Monthly. Right at pivot, between 100 MA Resistance 200 MA Support. MACD SQZMOM trending up Stoch high. $USOIL $WTI $USO #OIL

Market Outlook, Market News and Social Bits From Around the Internet:

#5things
-Trump reins in N. Korea hawks
-Treasury selloff
-Brent hits $80
-Markets mixed
-EU goes its own way
https://bloom.bg/2k27WBo

10 Stocks To Watch For May 17, 2018 https://benzinga.com/z/11731505 $ACXM $AMAT $CSCO $WMT $JACK $DDS $PLCE $JWN $LCA $JCP

10 Stocks To Watch For May 17, 2018 https://t.co/5rLQlnrOnT $ACXM $AMAT $CSCO $WMT $JACK $DDS $PLCE $JWN $LCA $JCP

— Benzinga (@Benzinga) May 17, 2018

Economic Data Scheduled For Thursday

Economic Data Scheduled For Thursday pic.twitter.com/lXBVT67F8w

— Benzinga (@Benzinga) May 17, 2018

Goldman Sachs chides speculators by making a case for buying oil https://www.bloomberg.com/news/articles/2018-05-17/goldman-sachs-chides-hedge-funds-by-making-a-case-for-buying-oil … via @HEESU_LEE #OOTT

If you are new to our trading service you should review recent blog posts, the Compound Trading YouTube Channel and at minimum our algorithm Twitter feeds because they do tell a story in terms of the market and how the inflections of the market determine our day to day trading. You will notice the algorithmic modelling has been undeniably accurate with many time-frames (intra-day, weeks and months out) so I myself have learned to respect their math (they have taken me from a 60% hit rate to 80%+ in my trading – all publicly posted live trades).

Momentum Stocks (Market Open and Intra-Day):

I do trade morning momo stocks, but I do avoid much of the day trading risk (preferring to daytrade only what is structurally set-up also on the swing trade side and to my advantage in the algorithmic model charting). I often avoid the first 30 minutes (gap and go) and trade momentum stocks or structured (per explanation in previous sentence) stocks later in day after a wash-out looking for a snap-back trade that can possibly also become a strong swing or longer term trade that I can leg in to. Just prior to open and shortly after open I post momentum stocks to the trade chat room (and Twitter and Stocktwits if I have time).

Some of my Favorite Intra-day Trading Set-Ups:

(1) Momentum Stock Wash-Outs for Snap Back, (2) Bad News Wash-outs on Stocks with High Institutional Ownership, (3) Getting on the Right Side of a Trend Change and scaling in my position and (4) Our Algorithm Charting Model Set-Ups.

The momentum stocks (from previous days and morning trade) I continue to watch through the day for indicators that allow a trade.

Morning Stock Watch-Lists for my Favorite Set-Ups:

(1) Pre-Market Gainers Watch-List: $NERV $BDSI $BLNK $LOXO 

(2) Pre-market Decliners Watch-List : $JNCE $CGG $JCP $ACXM $SPY $QQQ $IWM 

(3) Other Watch-List:

(4) Regular Algo Charting Watch-List: Gold $GC_F $GLD, Miners $GDX ($NUGT, $DUST, $JDST, $JNUG), Silver $SLV $SI_F ($USLV, $DSLV), Crude Oil FX: $USOIL $WTI ($UWT, $DWT, $USO, $UCO, $CL_F, $UWT, $DWT), Natural Gas $NG_F ($UGAZ, $DGAZ), S & P 500 $SPY $ES_F ($SPXL, $SPXS), US Dollar Index $DXY ($UUP), Volatility $VIX ($TVIX, $UVXY), $BTCUSD Bitcoin.

(5) Recent Upgrades: $TGI $CE $TLK $TDC $MANT $NI $E $KO $CNI $ETE $VLO $CNO $PQG $CVE $TDC $AIG $KOS $MBT $NUE $CMC $TGA

Morgan Stanley upgrades Valero ahead of expected ‘golden age’ of refining $VLO $MPC http://dlvr.it/QT9CNS

(6) Recent Downgrades: $TAP $SAIC $ENBL $PGR $VOD $TEP $BT $PNR $CBS $JE $GPT $JNCE $ENBL

Stay tuned in Stock Chat Room for more pre-market stocks on watch.

In Closing:

A few hours of trade coaching or study on exactly how to trim in to resistance and how to add to your positions on winners and how to cut losses properly and quickly will return huge dividends.

You can subscribe to our Weekly Swing Trading Newsletter service here, use temporary Promo Code “30P” for 30% off Reg 119.00 Sale Price 83.30.

Or click here to subscribe and get 30% off Real-Time Swing Trading Alerts Reg 99.00 Sale Price 69.37 use temporary Promo Code “Deal30” for 30% off.

I personally guarantee our swing trading service is one of the best in the business and it’s very reasonably priced considering the technical expertise invested in the platform.

Study:

For new readers, a review of our unlocked posts on our blog would help you get in to the story we are following with the securities listed in this newsletter.

Free scanners to find momentum stocks that you can easily review charts of for indicators that bring probability of your trade being successful up considerably. These are not useful for first 30 minute market open gap and go type plays (you need a good momentum scanner, level 2, and best to have hot-keys for the first 30 mins of gap and go trading)… but are very useful for intra day scalping and swing trading (start with trending stocks and then look at indicators intra for simple set-ups – study scan study scan study scan).

http://finviz.com/

https://finance.yahoo.com/screener/predefined/ec5bebb9-b7b2-4474-9e5c-3e258b61cbe6

http://www.highshortinterest.com/

http://www.gurufocus.com/short-stocks.php

http://www.3xetf.com/all/

http://www.etf.com/channels/gold-etfs

GL!

Curtis

Algorithm Twitter feeds can be found here: $BTC (@CryptotheAlgo) $WTI (@EPICtheAlgo), $VIX (@VexatiousVIX), $SPY (@FREEDOMtheAlgo), $GLD (@ROSIEtheAlgo), $SLV (@SuperNovaAlgo), $DXY (@DXYUSD_Index). Our Swing Trading Twitter feed is found here: https://twitter.com/swingtrading_ct.  Our lead trader Twitter feed is here @curtmelonopoly

Article Topics: Premarket, Watchlist, Stocks, Trading, Plan, Treasury, Oil, Wallmart, $WMT, $AMBA, $AMD, $NERV, $BDSI, $BLNK, $LOXO

Read More
Swing Trade Set-Ups (May 15/16 Member Edition) $WTI, #OIL, $BTC, Bitcoin, $AMBA, $AMD, $BLNK, $ITCI,, $SPY, $DIS, $LAC, $BOX, $AAOI more.

Swing Trade Set-Ups (May 15/16 Member Edition) $WTI, #OIL, $BTC, Bitcoin, $AMBA, $AMD, $BLNK, $ITCI,, $SPY, $DIS, $LAC, $BOX, $AAOI more.

May 17, 2018June 9, 2018 Swing TraderSwing Trading$AAOI, $AMBA, $AMD, $BLNK, $BTC, $DIS, $ITCI, $LAC, $WTI, BITCOIN, BOX, char, Oil, Review, Setups., SPY, Swingtrading, Video

Swing Trading Report and Video for May 15 / 16, 2018.

In this Edition: $WTI, #OIL, $BTC, Bitcoin, $AMBA, $AMD, $BLNK, $ITCI,, $SPY, $DIS, $LAC, $BOX, $AAOI more.

What’s New!

  • Interested in free swing trading setups? Click here to sign up for the Complimentary Swing Trading Report Mailing List.
  • Now available for serious traders – Legacy All Access Membership.
  • Price increase platform wide May 15, 2018. Detailed announcement to follow. Current members unaffected.
  • 24 Hour Crypto Trading Desk opens May 15, 2018 along with our Coding Algorithm Models for Machine Trading. Formal announcements to follow.

The Mid Day Trade Set-Ups Video:

Trade set-ups on this video;  $WTI, #OIL, $BTC, Bitcoin, $AMBA, $AMD, $BLNK, $ITCI, $SPY, $DIS, $LAC, $BOX, $AAOI more.

Mid Day Chart Swing Trading Set-ups May 16 Summary:

Swing Trade Set-Ups in this Video; $WTI, #OIL, $USOIL, $AMBA, $BTC, $XBTUSD, Bitcoin, $AMD, $BLNK, $ITCI,, $DIS, $LAC, $BOX, $AAOI, $SPY more.

A must watch. Our plays the last two months have been the best trading I’ve seen in my 29 years. These algorithm chart models are getting dialed in in a various serious way.

Over 30 plays last two months and very few are under water. Massive returns. Check our calls and verify yourself.

Swing Trade and Day Trade Set-ups May 16 Mid Day Chart Review;

Oil $WTI $USOIL – Oil algorithm reviewed. We’re over pivot. Details on video.

$BTC Bitcoin $XBTUSD – Algorithm charting reviewed 7990 support should bounce to next upside 8878.00 target on model in bullish turn or 7863.00 bearish price target in trend if it doesn’t bounce is support.

$SPY SP500 – 273.22 price target resistance 274.55 then 278.55 May 30. Trim in to and add above. Support 270.48 270.29 267.94 in bearish scenario. $SPXL $SPXS $ES_F 60 Min $SPY Algorithm Model Reviewed.

$BLNK Momentum Stock – 8.339 resistance on daily 200 MA is in play. Didn’t trade it. How to short it if borrows are available.

$AMD – triggered a buy 12.80 price targeting 14.60 May 29, support 12.80 then mid quad 12.25 then 200 MA 11.80 and 11.71 9.83 in a wash-out.

$ITCI – Alerted on way down to swing trade members, caught the wash-out for a snap-back trade, excellent trade in ITIC so far, hit it in the wash-out 200 MA support, since then we’ve hit it for adds, Support is at moving averages 20 50 100 200 MA. Members have upside price targets and resistance points on charting sent out.

$DIS Disney – swing trade has been perfect, hit our price target early, Cramer was pumping it on CNBC, 103.72 was the price target for May 31. Upside 100 MA 104.55 and quad wall 104.81 and 105.37 resistance points. Trim in to resistance and add above. Gap 105.37 gap in model to 107.29 upside possible.

$AMBA this is one I was screaming telling the world DO NOT IGNORE THIS TRADE when it was dumping, alerting a 40% upside return was imminent, and it has now hit its price targets early. There is a special swing trade report for $AMBA on our website public and member versions. Expecting mid 53’s 58.63 is mid quad price target June 19, 51.51 support 48.43 support. Resistance 54.23 54.71 quad wall and then 58.63 mid quad price target.

$BOX – Sean alerted it looks strong, I revised a daytrading model and sent to members, resistance 28.34 price target in December so we’re ahead of schedule, watch the symmetry on this vary close. Res 30.35 30.48 31.74 32.96 is personal bias price target for $BOX end of MAY. Algorithmic chart model channel reviewed. Trade plan reviewed on video.

$LAC – upside bullish 6.50 resistance and then 50 MA 6.83, in a cluster, Jan 7.97 price target and 12.56 same day in January for $LAC in most bullish scenario.

$AAOI – nemesis from last year showing bullish signals, holding support at mid quad 49.87 best scenario July 4 not likely test above near 200 MA and 39.32 40.30 and 38.75 and support 27.70 24.34 22.66 and if that dumps its time to say good bye.

Gold and Silver – in starters with them and they’re soft and I’m under water a bit. Holding, hedge, various reasons. Holding my starters. $GLD $SLV

Register to free email list for trade set-ups, webinars, special events: https://compoundtrading.com/contact/

Some featured swing trade charting;

$AAOI hit HOD 33.12 at resistance above targets 37.27 38.69 40.11 200 MA 49.56 July 4 unlikely #swingtrading

$AAOI hit HOD 33.12 at resistance above targets 37.27 38.69 40.11 200 MA 49.56 July 4 unlikely #swingtrading

$LAC Lithium trading 6.30 power bounce off mid quad 5.40 targeting 6.43 6.54 200 MA res, Jan 1 price targets 7.81 12.60

$LAC Lithium trading 6.30 power bounce off mid quad 5.40 targeting 6.43 6.54 200 MA res, Jan 1 price targets 7.81 12.60

$AMD triggering long side add over 12.80 targeting 13.47 13.60 with significant resistance 14.62 #swingtrading

$AMD triggering long side add over 12.80 targeting 13.47 13.60 with significant resistance 14.62 #swingtrading

Disney over 200 MA over 103.76 resistance trading 103.96 targets 105.28 next resistance #swingtrading $DIS

Disney over 200 MA over 103.76 resistance trading 103.96 targets 105.28 next resistance #swingtrading $DIS

Intra Cellular over 21.24 resistance trading 21.36 next target 22.28 and main price target resistance 23.80. #swingtrading

Intra Cellular over 21.24 resistance trading 21.36 next target 22.28 and main price target resistance 23.80. #swingtrading

Intra day chart model update for $BOX swing trade #swingtrading #daytrading

Intra day chart model update for $BOX swing trade #swingtrading #daytrading

$AMBA over 51.60 mid quad res over 200 MA trading 52.19 HOD targeting 54.25 54.75 58.66 #swingtrading

$AMBA over 51.60 mid quad res over 200 MA trading 52.19 HOD targeting 54.25 54.75 58.66 #swingtrading

Recent Trading Set-Up Review Webinars / Posts:

Password: AI Protected: How to Trade Pure Storage Earnings in Six Days (Member Edition) $PSTG

Password ITCI: Protected: Trade Set-Ups (May 14 /15 Member Edition) $BOX, $ITCI, $SPY, $EEM, $PFE, $BTC, Bitcoin, SILVER, $SLV, $ETH, Ethereum, $EOG, $EDIT, $EXP more.

Password: WOW Protected: How to Trade Box Earnings Move (Swing Trade Member Exclusive)

Protected: Trade Set-Ups (May 8 Member Edition) $AAPL, $DIS, $AMD, $ITCI, $AAOI, $SNAP, $FB, $TSLA, $EDIT, $ESPR, $LITE, $LPSN, $SPY.

May 7 – Trade Set-Ups, Consolidated Review $SPY, $AAPL, $TSLA, $SNAP, OIL, $DXY, $VIX, GOLD, $DIS, Silver more.

Trading Set-ups $FB, $AMBA, $SDTY, $TSLA, $GDX, $SLV, $BTC, $JD, $VIX, $LITE, $CELG, $FSLR more.

Do Not Ignore This Trade Set-Up | $AMBA Swing Trade | 40% ROE 3 Mos (Part 1 of 2)

Password: ELON Protected: How to Trade the Tesla Move | Price Targets | Buy Sell Triggers | Time Cycles $TSLA #swingtrading #daytrading

Password: LONG Protected: Overnight Oil Trade | Trading Plan in Detail | EPIC Oil Algorithm $USOIL $WTI $CL_F #OIL $USO #Alerts

Trade Set-ups $SPY, $NFLX, OIL, $WTI, $ESPR, $GOOGL, Bitcoin, $BTC, $FEYE, $AAPL and more.

Trading Set-Ups $SPY, Gold, $GC_F, $GDX, Bitcoin, $GOOGL, $EVLV, $HEAR, $CHEK, $MARA, $PRTA, $ZDGE

Trading Set-Ups $NETE, $TSG, $ETH Ethereum, $BTC Bitcoin, $TAN, $HEAR, $AMMJ, $SNAP, $VLRX

Trade Set-Ups OIL, $WTI, $SPY, $GOOGL, $FSLR, $AXP, $GREK, $CELG, $AAOI, $SDRL, $WFT

Great Trading Last Few Wks – Lets Keep Going! $RIG, #OIL, $SPY, $ETH, $BTC, $FB, $GOOGL, $BWA, $GDX more.

Swing Trade Set-Ups Abound $SPY, $NFLX, $DIS, $EOG, $WTIC, $USOIL, $BTC, $FB, $MARA, $LITE, $IOTS and more.

Special Swing Trade Report: #OIL, #GOLD, $NFLX, $SPY, $DIS, $GDX, $TSLA, $AAOI, $ESPR, $ITCI, $TAN, $CELG, $C and more.

Register to free email list for trade set-ups, webinars, special events: https://compoundtrading.com/contact/

Website: https://compoundtrading.com

Free chat room: https://discord.gg/2HRTk6n

Subscribe: https://compoundtrading.com/overview-…

Twitter: https://twitter.com/CompoundTrading

Lead Trader: https://twitter.com/curtmelonopoly

Tradingview: https://www.tradingview.com/u/curtmel…

Facebook: https://www.facebook.com/compoundtrad…

StockTwits: https://stocktwits.com/compoundtrading

Email: https://info@compoundtrading.com

Compound Trading Platform: Algorithm model charting for $SPY, $VIX, #OIL, #GOLD, #SILVER, #Crypto ($BTC Bitcoin, $ETH, $LTC, $XRP,) $DXY US Dollar and Swing Trading Newsletter. Live trading rooms for daytrading and oil traders. Private coaching and live alerts.

Read More
PreMarket Trading Plan Wed May 16: #EIA, Oil Trade, $WTI, $BLNK, $M, $JNJ, $SBUX, $MMM, $CHDN, $ABAX, $ROKU more.

PreMarket Trading Plan Wed May 16: #EIA, Oil Trade, $WTI, $BLNK, $M, $JNJ, $SBUX, $MMM, $CHDN, $ABAX, $ROKU more.

May 16, 2018June 9, 2018 Curt MelonopolyTrading Plan#EIA, $BLNK, $JNJ, $M, $ROKU, $SBUX, $WTI, ABAX, CHDN, MMM, Oil Trade, Plan, Premarket, Stocks, Trading, Watchlist

Compound Trading Trading Plan and Watch List Wednesday May 16, 2018. 

In this edition: #EIA, Oil Trade, $WTI, $BLNK, $M, JNJ, SBUX, MMM, CHDN, ABAX, ROKU and more.

Welcome to the morning Wall Street trading day session at Compound Trading!

Notices:

Quick Update: Reporting, Live Rooms, New Team Members, Pricing, Discounts, Trade Coaching, New Book https://compoundtrading.com/quick-update-reporting-live-rooms-new-team-members-pricing-discounts-trade-coaching-new-book/

What’s New at Compound Trading April / May 2018. https://compoundtrading.com/whats-new-at-compound-trading-april-may-2018/

Price Increase: Platform wide price increase May 15, 2018. Does not affect existing members. Official announcement to follow.

Machine Trading: May 15, 2018 the new teams start. Mandate: (1) Intelligent Assisted #IA Trading Platform (Code Algorithm Models), (2) Run 24 Hour Crypto Trading Desk, (3) Alert Trade Set-ups to Member Alert Feeds (for all models) and near future (4) Machine Learning. Official announcement to follow.

Notes in red text below are new comments entered specifically today (or recently important).

Live Trading Room Link:

http://compoundtrading1.clickmeeting.com/livetrading

Real-time Alerts for Oil, Gold, Swing Trading, Day Trading, Bitcoin are available by following specific alert Twitter feeds.

Disclaimer / disclosure: Every subscriber must read this disclaimer.

Reporting and Next Gen Algorithms:

BE SURE to get in to each private Discord server specific to your subscription as many of the updates as we go forward will be posted in there. This includes the SWING TRADING platform also.

IF YOU NEED A LINK / INVITE email or DM us!

Connect with us on Discord.

https://twitter.com/CompoundTrading/status/880670140454637569

Recent Blog / Video / Social Posts: 

#BitcoinTrading 101: A Beginner’s Guide to Getting Started $BTCUSD $XBTUSD $BTC https://compoundtrading.com/bitcointrading-101-beginners-guide-getting-started-btcusd-xbtusd-btc/ …

https://twitter.com/CompoundTrading/status/927397024315662336

How to Use EPIC Oil Algorithm: $USOIL, $WTI, $CL_F, $USO, $UCO, $SCO, $UWT, $DWT, #OIL, #OOTT: http://youtu.be/hawVV31G9bg?a via @YouTube

https://twitter.com/CompoundTrading/status/889148655785177088

How to Use ROSIE Gold Algorithm: #GOLD, $GLD, $XAUUSD, $GDX, $GDXJ, $NUGT, $DUST, $JNUG, $JDST

https://twitter.com/CompoundTrading/status/889147527278333952

Recent Chart / Trade Set-Ups: 

See You Tube for other recent video posts. 

Password: AI Protected: How to Trade Pure Storage Earnings in Six Days (Member Edition) $PSTG

Password ITCI: Protected: Trade Set-Ups (May 14 /15 Member Edition) $BOX, $ITCI, $SPY, $EEM, $PFE, $BTC, Bitcoin, SILVER, $SLV, $ETH, Ethereum, $EOG, $EDIT, $EXP more.

Password: WOW Protected: How to Trade Box Earnings Move (Swing Trade Member Exclusive)

Protected: Trade Set-Ups (May 8 Member Edition) $AAPL, $DIS, $AMD, $ITCI, $AAOI, $SNAP, $FB, $TSLA, $EDIT, $ESPR, $LITE, $LPSN, $SPY.

May 7 – Trade Set-Ups, Consolidated Review $SPY, $AAPL, $TSLA, $SNAP, OIL, $DXY, $VIX, GOLD, $DIS, Silver more.

Trading Set-ups $FB, $AMBA, $SDTY, $TSLA, $GDX, $SLV, $BTC, $JD, $VIX, $LITE, $CELG, $FSLR more.

Do Not Ignore This Trade Set-Up | $AMBA Swing Trade | 40% ROE 3 Mos (Part 1 of 2)

Password: ELON Protected: How to Trade the Tesla Move | Price Targets | Buy Sell Triggers | Time Cycles $TSLA #swingtrading #daytrading

Password: LONG Protected: Overnight Oil Trade | Trading Plan in Detail | EPIC Oil Algorithm $USOIL $WTI $CL_F #OIL $USO #Alerts

Trade Set-ups $SPY, $NFLX, OIL, $WTI, $ESPR, $GOOGL, Bitcoin, $BTC, $FEYE, $AAPL and more.

Trading Set-Ups $SPY, Gold, $GC_F, $GDX, Bitcoin, $GOOGL, $EVLV, $HEAR, $CHEK, $MARA, $PRTA, $ZDGE

Trading Set-Ups $NETE, $TSG, $ETH Ethereum, $BTC Bitcoin, $TAN, $HEAR, $AMMJ, $SNAP, $VLRX

Trade Set-Ups OIL, $WTI, $SPY, $GOOGL, $FSLR, $AXP, $GREK, $CELG, $AAOI, $SDRL, $WFT

Great Trading Last Few Wks – Lets Keep Going! $RIG, #OIL, $SPY, $ETH, $BTC, $FB, $GOOGL, $BWA, $GDX more.

Recent Educational Articles / Videos:

I get a lot of Q’s on How to Trade our models, this vid has 5 min explanation at 1:00 min-6:00 min. https://www.youtube.com/watch?v=QrXbE7lojAg&t=3s … – Fib Trendlines, Trading structure/quads, Price targets, Main support resistance (buy sell triggers), Time cycles, Moving averages, Trading trims/adds.

I get a lot of Q's on How to Trade our models, this vid has 5 min explanation at 1:00 min-6:00 min. https://t.co/oqezvVcn0y … – Fib Trendlines, Trading structure/quads, Price targets, Main support resistance (buy sell triggers), Time cycles, Moving averages, Trading trims/adds.

— Melonopoly (@curtmelonopoly) May 13, 2018

Trading Plan (Buy, Hold, Sell) Watch Lists. Morning Momentum / Gap / News / PR / IPO / SEC Filings / Earnings Stocks on Watch: 

Stocks making the biggest moves premarket: JNJ, SBUX, MMM, CHDN, ABAX, ROKU & more http://dlvr.it/QT2qJ7

Market Observation:

As of 8:21 AM: US Dollar $DXY trading 93.28, Oil FX $USOIL ($WTI) trading 70.81, Gold $GLD trading 1288.75, Silver $SLV trading 16.25, $SPY 270.72, Bitcoin $BTC.X $BTCUSD $XBTUSD 8369.00 and $VIX trading 13.8.

Momentum Stocks to Watch: $BLNK, $M

News: 

Recent SEC Filings: 

Recent IPO’s:

Earnings: 

#earnings for the week

$WMT $HD $AMAT $CSCO $M $JCP $DE $TTWO $BZUN $MZOR $NTES $KEM $A $VIPS $CSIQ $LONE $HQCL $MARK $SORL $JWN $DGLY $EXP $SWCH $AZN $CPB $NM $GDP $BCLI $MGIC $TGEN $KMDA $JACK $ATNX $HTHT $MANU $NINE $MTBC $VRTU $RXN $AMRS $FLO

http://eps.sh/cal

#earnings for the week $WMT $HD $AMAT $CSCO $M $JCP $DE $TTWO $BZUN $MZOR $NTES $KEM $A $VIPS $CSIQ $LONE $HQCL $MARK $SORL $JWN $DGLY $EXP $SWCH $AZN $CPB $NM $GDP $BCLI $MGIC $TGEN $KMDA $JACK $ATNX $HTHT $MANU $NINE $MTBC $VRTU $RXN $AMRS $FLO https://t.co/r57QUKKDXL https://t.co/EFUpuZmWFi

— Melonopoly (@curtmelonopoly) May 14, 2018

Trade Set-up Alerts, Charts & Reports. Recent / Current Holds, Open and Closed Trades:

$MXIM over 20 MA on weekly is a long to 61.38 area. Pivots noted on chart.

$MXIM over 20 MA on weekly is a long to 61.38 area. Pivots noted on chart.

Path of least resistance of US Dollar weekly chart 200 MA 94.80 area $DXY

Path of least resistance of US Dollar weekly chart 200 MA 94.80 area $DXY

Disney almost at May 30 target now that is in the 103.80 area. $DIS

Disney almost at May 30 target now that is in the 103.80 area. $DIS

Trade just hit 71.16, remember to take profits on the way. Oil Trade Alert – EPIC Oil Algorithm $USOIL $WTI $CL_F #OOTT #OIL $USO $UWT $DWT

Trade just hit 71.16, remember to take profits on the way. Oil Trade Alert – EPIC Oil Algorithm $USOIL $WTI $CL_F #OOTT #OIL $USO $UWT $DWT

CITI bought conistently at historical support noted previous. MACD trend up. Resistance above. Riding 200 MA. $C

CITI bought conistently at historical support noted previous. MACD trend up. Resistance above. Riding 200 MA. $C

Long side starter 71.01 target 71.59 per chart. Oil Trade Alert – EPIC Oil Algorithm $USOIL $WTI $CL_F #OOTT #OIL $USO $UWT $DWT

Long side starter 71.01 target 71.59 per chart. Oil Trade Alert – EPIC Oil Algorithm $USOIL $WTI $CL_F #OOTT #OIL $USO $UWT $DWT

Oil reaching for EPIC Tues 430 price target from Sunday report $USOIL $WTI $CL_F #OOTT #OIL $USO $UWT $DWT 

Oil reaching for EPIC Tues 430 price target from Sunday report $USOIL $WTI $CL_F #OOTT #OIL $USO $UWT $DWT

Swing trade $EXP excellent swing trade over buy side 106.10 trim in to 112.28 resistance, next 177.70 major res.

Swing trade $EXP excellent swing trade over buy side 106.10 trim in to 112.28 resistance, next 177.70 major res.

Per recent;

$DIS long side trade doing well – IT IS AT a trim in to 200 MA zone intraday now.

$DIS, chart
$DIS long side trade doing well – IT IS AT a trim in to 200 MA zone intraday now.

$ITCI cleared the 50 MA getting in to first intra day resistance at red horiz lines

$ITCI cleared the 50 MA getting in to first intra day resistance at red horiz lines

$EDIT flying here hit 37.20 trim in to 37.60 add above – it’s a power move and thats mid quad resistance

$EDIT flying here hit 37.20 trim in to 37.60 add above – it’s a power move and thats mid quad resistance

$SPY up and over adds to next resistance 274.51 trim in to it add above

$SPY up and over adds to next resistance 274.51 trim in to it add above

$HTZ trading 17.89 premarket – trim in to 50 MA on hourly add above.

$HTZ trading 17.89 premarket – trim in to 50 MA on hourly add above.

Per recent;

$BOX Weekly Algorithmic Model Chart #earnings #trading

BOX, earnings, trade, set-up, howto
$BOX Weekly Algorithmic Model Chart #earnings #trading

Gold. Monthly. $XAUUSD $GC_F $GLD $NUGT $DUST $JDST $JNUG #Gold

Gold. Monthly. $XAUUSD $GC_F $GLD $NUGT $DUST $JDST $JNUG #Gold

Simple symmetrical time cycle on weekly, Volatility reversal leading in to July 23 ish probable. $VIX $UVXY $TVIX

Simple symmetrical time cycle on weekly, Volatility reversal leading in to July 23 ish probable. $VIX $UVXY $TVIX

$VIX under moving averages on Daily Chart and under lower bollinger. Long bias RR setting in.

$VIX under moving averages on Daily Chart and under lower bollinger. Long bias RR setting in.

Doesn’t really matter how you draw the lines – there’s a decision coming on Silver Weekly Chart. #Silver $SLV $USLV $DSLV

Doesn’t really matter how you draw the lines – there’s a decision coming on Silver Weekly Chart. #Silver $SLV $USLV $DSLV

Massive time cycle comes due late July on Gold Daily. Structure in place still. May 14 218 AM #Gold $GLD $GC_F $XAUUSD $NUGT $DUST

Massive time cycle comes due late July on Gold Daily. Structure in place still. May 14 218 AM #Gold $GLD $GC_F $XAUUSD $NUGT $DUST

With earnings on deck this week watch this one close. 118.00 upside 93.00 downside. Good range. $EXP

With earnings on deck this week watch this one close. 118.00 upside 93.00 downside. Good range. $EXP

$CALA targeting 3.00 range July 6. Trending down quad wall near perfect. Watch for bounce. #swingtrading

$CALA targeting 3.00 range July 6. Trending down quad wall near perfect. Watch for bounce. #swingtrading

Bull bear fight is on with dollar closing the week at the 50 MA. Watch that close. $DXY $UUP

Bull bear fight is on with dollar closing the week at the 50 MA. Watch that close. $DXY $UUP

$SPY Daily Chart, ending week bullish with a break above upper TL and 20 MA near breach 50 MA. $ES_F $SPXL $SPXS

$SPY Daily Chart, ending week bullish with a break above upper TL and 20 MA near breach 50 MA. $ES_F $SPXL $SPXS

Oil Monthly. Right at pivot, between 100 MA Resistance 200 MA Support. MACD SQZMOM trending up Stoch high. $USOIL $WTI $USO #OIL

Oil Monthly. Right at pivot, between 100 MA Resistance 200 MA Support. MACD SQZMOM trending up Stoch high. $USOIL $WTI $USO #OIL

Market Outlook, Market News and Social Bits From Around the Internet:

#5things people in markets are talking about today:
– Kim threatens summit withdrawal
– IEA warns on oil demand
– Italy government talks
– Markets slip
– Emerging markets
https://bloom.bg/2GlTf4X

If you are new to our trading service you should review recent blog posts, the Compound Trading YouTube Channel and at minimum our algorithm Twitter feeds because they do tell a story in terms of the market and how the inflections of the market determine our day to day trading. You will notice the algorithmic modelling has been undeniably accurate with many time-frames (intra-day, weeks and months out) so I myself have learned to respect their math (they have taken me from a 60% hit rate to 80%+ in my trading – all publicly posted live trades).

Momentum Stocks (Market Open and Intra-Day):

I do trade morning momo stocks, but I do avoid much of the day trading risk (preferring to daytrade only what is structurally set-up also on the swing trade side and to my advantage in the algorithmic model charting). I often avoid the first 30 minutes (gap and go) and trade momentum stocks or structured (per explanation in previous sentence) stocks later in day after a wash-out looking for a snap-back trade that can possibly also become a strong swing or longer term trade that I can leg in to. Just prior to open and shortly after open I post momentum stocks to the trade chat room (and Twitter and Stocktwits if I have time).

Some of my Favorite Intra-day Trading Set-Ups:

(1) Momentum Stock Wash-Outs for Snap Back, (2) Bad News Wash-outs on Stocks with High Institutional Ownership, (3) Getting on the Right Side of a Trend Change and scaling in my position and (4) Our Algorithm Charting Model Set-Ups.

The momentum stocks (from previous days and morning trade) I continue to watch through the day for indicators that allow a trade.

Morning Stock Watch-Lists for my Favorite Set-Ups:

(1) Pre-Market Gainers Watch-List: $BLNK  $GEMP $BOOT $ABAX $CLMT $FORD $KOOL $HEAR $SE $M $SSC $MFGP $NSPR $HTBX $CIFS $TEVA $DDS $EBIO $SGMO $JCP $FTI $GME $MU $RIO $CZR

(2) Pre-market Decliners Watch-List :

(3) Other Watch-List:

(4) Regular Algo Charting Watch-List: Gold $GC_F $GLD, Miners $GDX ($NUGT, $DUST, $JDST, $JNUG), Silver $SLV $SI_F ($USLV, $DSLV), Crude Oil FX: $USOIL $WTI ($UWT, $DWT, $USO, $UCO, $CL_F, $UWT, $DWT), Natural Gas $NG_F ($UGAZ, $DGAZ), S & P 500 $SPY $ES_F ($SPXL, $SPXS), US Dollar Index $DXY ($UUP), Volatility $VIX ($TVIX, $UVXY), $BTCUSD Bitcoin.

(5) Recent Upgrades: $TIER $RJF $SBS $URBN $TROW $LYB $GRA $AMD $ALKS $CMG $RRGB $OHI

(6) Recent Downgrades: $EDR $AVT $LPLA $ESES $VIPS $AES $MMM $FFIV $CTL $WETF $PPG $BT $OMN $AVT $NETS $SYMC $TOT $STBZ $RYB

Stay tuned in Stock Chat Room for more pre-market stocks on watch.

In Closing:

A few hours of trade coaching or study on exactly how to trim in to resistance and how to add to your positions on winners and how to cut losses properly and quickly will return huge dividends.

You can subscribe to our Weekly Swing Trading Newsletter service here, use temporary Promo Code “30P” for 30% off Reg 119.00 Sale Price 83.30.

Or click here to subscribe and get 30% off Real-Time Swing Trading Alerts Reg 99.00 Sale Price 69.37 use temporary Promo Code “Deal30” for 30% off.

I personally guarantee our swing trading service is one of the best in the business and it’s very reasonably priced considering the technical expertise invested in the platform.

Study:

For new readers, a review of our unlocked posts on our blog would help you get in to the story we are following with the securities listed in this newsletter.

Free scanners to find momentum stocks that you can easily review charts of for indicators that bring probability of your trade being successful up considerably. These are not useful for first 30 minute market open gap and go type plays (you need a good momentum scanner, level 2, and best to have hot-keys for the first 30 mins of gap and go trading)… but are very useful for intra day scalping and swing trading (start with trending stocks and then look at indicators intra for simple set-ups – study scan study scan study scan).

http://finviz.com/

https://finance.yahoo.com/screener/predefined/ec5bebb9-b7b2-4474-9e5c-3e258b61cbe6

http://www.highshortinterest.com/

http://www.gurufocus.com/short-stocks.php

http://www.3xetf.com/all/

http://www.etf.com/channels/gold-etfs

GL!

Curtis

Algorithm Twitter feeds can be found here: $BTC (@CryptotheAlgo) $WTI (@EPICtheAlgo), $VIX (@VexatiousVIX), $SPY (@FREEDOMtheAlgo), $GLD (@ROSIEtheAlgo), $SLV (@SuperNovaAlgo), $DXY (@DXYUSD_Index). Our Swing Trading Twitter feed is found here: https://twitter.com/swingtrading_ct.  Our lead trader Twitter feed is here @curtmelonopoly

Article Topics: Premarket, Watchlist, Stocks, Trading, Plan, #EIA, Oil Trade, $WTI, $BLNK, $M, JNJ, SBUX, MMM, CHDN, ABAX, ROKU

Read More
Swing Trading Report Wed May 16 Part A $PSTG, $C, $AKTX, $DIS, $DXY, Gold $MXIM, $ATHM …

Swing Trading Report Wed May 16 Part A $PSTG, $C, $AKTX, $DIS, $DXY, Gold $MXIM, $ATHM …

May 16, 2018July 22, 2018 Curt MelonopolySwing Trading$AKTX, $ATHM, $C, $DIS, $PSTG, Alerts, Compound trading, DXY, Gold $MXIM, Picks, Stock, Swing, Trading

Welcome to the Compound Trading Swing Trading Stock Report Wednesday May 16, 2018 (Part A).

In this edition: $PSTG, $C, $AKTX, $DIS, $DXY, Gold $MXIM, $ATHM

Email us at info@compoundtrading.com anytime with any questions about any of the swing trades listed below. Or, if we get bogged down private message Curtis in trade room or direct message him on Twitter. Market hours are tough but we endeavor to get back to everyone after market each day.

Notices:

Good morning!

This swing trading report is one in five in rotation. The goal is to publish each in rotation approximately every 30 – 40 days (pending market conditions). We currently have approximately one hundred equities we cover regularly on our swing trading service.

This is Part A of this report.

The reports are in the process of upgrades to included buy and sell triggers identified on charting of select instruments that are nearing trade set-ups. The triggers (price and / or other indicators) will also be programmed in to our charting for attendees to the live trading room and alerts will flash on screen in the trading room. Additionally, the triggers will be buy / sell points for our traders to use as part of the alerts members may receive.

If you need help with a specific trade and the specific trading plan for your swing trade set-up let me know and as I have time I can help you formulate.

When managing your trades with the reports keep in mind that you will have to invest an hour or two a week to check the indicators mentioned for buy and sell triggers.

Swing trading success, even with a service, does require “some” maintenance on the part of the user, although the new live alert service will take much of that burden off the user as we know many of our users have busy lives. It is the indicators lining up that signal a trade long entry or an exit. In our case rely heavily on MACD on daily or weekly (or Stoch RSI and Moving averages) but indicators we are basing our trade entry and exits on are listed with each trade so any user that does even moderate trade management will know when the indicator(s) have turn with or against the trade.

Intra-week you can always DM myself on Twitter or email with specific questions regarding trades you are considering for assistance. But it is critical that you attend to the maintenance of your signals at least once a week if not twice and set stops and preferably alarms so that intra-week you can enter or exit.

If nothing else you can always book some coaching time and I’ll assist also (highly recommended if you are not trading green yet). If interested in coaching options email me info@compoundtrading.com.

IF WE DON’T GET BACK TO YOU RIGHT AWAY it is usually because we are pressured with deadlines or are trading.

As live charts are made available below, click on link and open viewer. Then to use chart yourself click on share button at bottom right (near thumbs up) and then click “make it mine”.

To remove the indicators (MACD, Stochastic RSI, Squeeze Momentum Indicator represented at bottom of chart) double click on chart body – and same to return the indicators.

If you receive a report and you are not subscribed to the specific service it is a complimentary issue..

Our apologies if you receive more than one copy – it means you are on more than one subscription list. We are working to resolve this issue.

Newer updates below in red for ease.

Recent Compound Trading Videos and/ or Blog Posts for Swing Traders / Charting Set-Ups:

See You Tube for other recent video posts. 

Password ITCI: Protected: Trade Set-Ups (May 14 /15 Member Edition) $BOX, $ITCI, $SPY, $EEM, $PFE, $BTC, Bitcoin, SILVER, $SLV, $ETH, Ethereum, $EOG, $EDIT, $EXP more.

Password: WOW Protected: How to Trade Box Earnings Move (Swing Trade Member Exclusive)

Protected: Trade Set-Ups (May 8 Member Edition) $AAPL, $DIS, $AMD, $ITCI, $AAOI, $SNAP, $FB, $TSLA, $EDIT, $ESPR, $LITE, $LPSN, $SPY.

May 7 – Trade Set-Ups, Consolidated Review $SPY, $AAPL, $TSLA, $SNAP, OIL, $DXY, $VIX, GOLD, $DIS, Silver more.

Trading Set-ups $FB, $AMBA, $SDTY, $TSLA, $GDX, $SLV, $BTC, $JD, $VIX, $LITE, $CELG, $FSLR more.

Do Not Ignore This Trade Set-Up | $AMBA Swing Trade | 40% ROE 3 Mos (Part 1 of 2)

Password: ELON Protected: How to Trade the Tesla Move | Price Targets | Buy Sell Triggers | Time Cycles $TSLA #swingtrading #daytrading

Password: LONG Protected: Overnight Oil Trade | Trading Plan in Detail | EPIC Oil Algorithm $USOIL $WTI $CL_F #OIL $USO #Alerts

Trade Set-ups $SPY, $NFLX, OIL, $WTI, $ESPR, $GOOGL, Bitcoin, $BTC, $FEYE, $AAPL and more.

Trading Set-Ups $SPY, Gold, $GC_F, $GDX, Bitcoin, $GOOGL, $EVLV, $HEAR, $CHEK, $MARA, $PRTA, $ZDGE

Trading Set-Ups $NETE, $TSG, $ETH Ethereum, $BTC Bitcoin, $TAN, $HEAR, $AMMJ, $SNAP, $VLRX

Trade Set-Ups OIL, $WTI, $SPY, $GOOGL, $FSLR, $AXP, $GREK, $CELG, $AAOI, $SDRL, $WFT

Great Trading Last Few Wks – Lets Keep Going! $RIG, #OIL, $SPY, $ETH, $BTC, $FB, $GOOGL, $BWA, $GDX more.

Email us at info@compoundtrading.com anytime with any questions about any of the swing trades listed below. Or, if we get bogged down private message Curtis in trade room or direct message him on Twitter. Market hours are tough but we endeavor to get back to everyone after market each day.

Stock Pick Coverage

$C – CitiGroup

May 15 – CITI bought consistently at historical support noted previous. MACD trend up. Resistance above. Riding 200 MA. $C

https://www.tradingview.com/chart/C/H1TQmT6P-CITI-bought-conistently-at-historical-support-noted-previous-MA/

This is an interesting set-up. I’m slightly bullish but it has to gain the mid quad resistance above at 74.00 and then long side entries can start as long as indicators are cooperating..

Closed Tuesday 72.68 with next support below at 70.45 and currently riding 200 MA.

Trade above 74.00 has resistance above at 76.71.

Recent article on Investopedia Citigroup’s Stock May Rebound by 10%

April 4 – Citi quad wall & historical support near. 74.46 PT Chart notes. – #C chart

http://www.tradingview.com/chart/C/qRDWOlvu-Citi-quad-wall-historical-support-near-74-46-PT-Chart-notes/ …

$C Citi at a quad wall and historical support test here. 74.46 June 15 time cycle price target in play. #swingtrading

The trading area quad wall test (blue dotted diagonal line) is real. It could hold. If not it is down to lower target most likely.

But if it holds the path of least resistance is June 15 price cycle peak price target at 74.46.

Also of note the historical pivot / support is the horizontal white dotted line.

Huge risk reward advantage here for bull side trade.

HOWEVER, the 200 MA on daily has been lost so watch that as significant upside resistance test if price gets upward momentum.

AND, the MACD on daily is not crossed up as of yet.

$C, swingtrading, chart
$C Citi at a quad wall and historical support test. 74.46 June 15 time cycle price target in play. #swingtrading

There is a special report out to members on CitiGroup swing trading set-up here. Password: CITISWING

$AKTX – Akari Therapeutics

May 16 – Trading 1.92 and trade has been flat since last report. Will watch. No set-up now.

April 4 – Watching $AKTX quad wall support test VERY CLOSE here. Upside May 16 price target is near double.

With this chart set-up all they need is some PR news and it will go in my opinion.

Stochastic RSI on daily recently turned up but MACD is flat and SQZMOM trending down. Would be prudent to have all 3 turned up for a long.

$AKTX Buy / Sell Triggers:

Near trade buy triggers (Fibonacci support / resistance):

2.09

2.63

2.86

3.12

Significant upside resistance support areas:

4.105 is the 200 MA

4.90

5.42

8.80

9.21

9.52

10.62

11.91

12.19

14.11

https://www.tradingview.com/chart/AKTX/nz6zdTql-Watching-AKTX-quad-wall-support-test-VERY-CLOSE-here-Upside-pr/

Akari Therapeutics Announces Fourth Quarter and Full Year 2017 Financial Results and Highlights Recent Clinical Progress

https://finance.yahoo.com/news/akari-therapeutics-announces-fourth-quarter-110000635.html?.tsrc=rss

$AKTX, price target, swing trading, chart
Watching $AKTX quad wall support test VERY CLOSE here. Upside price target is near double.

Mar 1 – $AKTX Daily chart – price slumping in to time price cycle expiry at lower quad target.

$AKTX High probability of bounce off a Fib area soon in to time cycle target noted.

https://www.tradingview.com/chart/AKTX/2vVhjfA0-AKTX-High-probability-of-bounce-off-a-Fib-area-soon-in-to-time/

$DIS – Disney

May 16 – Same targets in play from April 4 review on Disney. Here’s a recent chart link;

https://www.tradingview.com/chart/DIS/KKAOnAHG-DIS-Buy-side-trigger-long-100-81-with-price-target-103-76-June/

Jim Cramer and technician Tim Collins take a close look at Disney’s stock chart to unpack a worrisome pattern.

Disney’s chart flashed the scariest pattern, but the stoc…

Disney almost at May 30 target now that is in the 103.80 area. $DIS

$DIS,
Disney almost at May 30 target now that is in the 103.80 area. $DIS

April 4 – $DIS trading 100.57 has MACD on daily targeting 103.89 110.64 May 30. #swingtrading Other targets noted.

Watch the 200 MA overhead as main resistance test on the way there.

2 Great Stocks You Can Buy and Hold Forever https://finance.yahoo.com/news/2-great-stocks-buy-hold-132100523.html?.tsrc=rss

https://www.tradingview.com/chart/DIS/241M4TSO-DIS-trading-100-57-has-MACD-on-daily-targeting-103-89-110-64-Ma/

$DIX, price targets, MACD, swingtrading
$DIS trading 100.57 has MACD on daily targeting 103.89 110.64 May 30. #swingtrading

Mar 1 – $DIS Stoch RSI turned down under 200 MA under mid quad bearish to targets.

This looks like a short to either target (follow price) if price stays under mid quad and 200 MA. It has been predictabiy hitting target areas.

$DIS News: Sky Is the Limit in Battle for Sky

https://www.tradingview.com/chart/DIS/ZnDXYcdX-DIS-Stoch-RSI-turned-down-under-200-MA-under-mid-quad-bearish-t/

$DIS, short, setup, swing
$DIS Stoch RSI turned down under 200 MA under mid quad bearish to targets.

$PSTG – Pure Storage

May 16 – How to Trade Pure Storage Earnings in 6 days $PSTG #swingtrading

There is a member post here also;

Protected: How to Trade Pure Storage Earnings in Six Days (Member Edition) $PSTG

Password: AI

https://www.tradingview.com/chart/PSTG/GLswoEx0-How-to-Trade-Pure-Storage-Earnings-in-6-days-PSTG-swingtrading/

PSTG closed 23.01 Tuesday with earnings in six days.

Important trade support is at 22.50 area (gray horizontal line) also marked with a white arrow.

White arrows are the most important buy sell triggers on the chart.

Above 22.50 (give it some room) it is a long to next resistance 24.00 area (horizontal lines on chart are resistance / support lines depending on what side of the line trade is on). Next on upside is 24.14 and then 25.12, then 25.44 and 25.91 area.

Under 22.50 area it targets support at 21.14 and then 21.00 then 20.03 and 19.71.

Price targets on model to bullish side are 25.91 and really bullish 29.19 Oct 1 2018. Trade toward target with price action using support and resistance points.

Downside scenario has 19.23 and 15.92 (most bearish) price targets Oct 1 2018.

May 14 Article:

Pure Storage Clears Data Bottlenecks On Road To Artificial Intelligence https://www.investors.com/research/the-new-america/pure-storage-artificial-intelligence/?src=A00220&yptr=yahoo

$PSTG, pure storage, chart, earnings, trade
How to Trade Pure Storage Earnings in 6 days $PSTG #swingtrading

April 4 – $PSTG indecisive trade but MACD on daily may turn up here. Long over 50 MA.

Why You Should Retain Pure Storage in Your Portfolio Now https://finance.yahoo.com/news/why-retain-pure-storage-portfolio-130101121.html?.tsrc=rss

https://www.tradingview.com/chart/PSTG/dvGKmWsB-PSTG-indecisive-trade-but-MACD-on-daily-may-turn-up-here-Long/

$PSTG, chart
https://www.tradingview.com/chart/PSTG/dvGKmWsB-PSTG-indecisive-trade-but-MACD-on-daily-may-turn-up-here-Long/

$DXY US Dollar Index $UUP

May 16 – Path of least resistance of US Dollar on weekly chart is 200 MA at 94.80 area. $DXY

SQZMOM has also turned green. Watching for continuation here.

US Dollar, weekly, chart
Path of least resistance of US Dollar weekly chart 200 MA 94.80 area $DXY

April 4 – $DXY US Dollar sideways range bound trading.

$DXY, US Dollar, chart
$DXY US Dollar sideways range bound trading.

$XAUUSD #Gold $GLD $UGLD $DGLD

May 16 – Gold. Monthly. $XAUUSD $GC_F $GLD $NUGT $DUST $JDST $JNUG #Gold

https://www.tradingview.com/chart/XAUUSD/SDRxRcdD-Gold-Monthly-XAUUSD-GC-F-GLD-NUGT-DUST-JDST-JNUG-Gold/

Gold monthly chart.

Gold monthly chart.

April 4 – Gold in a long drawn out range bound decision that should conclude soon. $XAUUSD #Gold $GLD $GC_F

No bias to conclusion as of yet.

https://www.tradingview.com/chart/XAUUSD/mptMsFti-Gold-in-a-long-drawn-out-range-bound-decision-that-should-conclu/

Gold, chart
Gold in a long drawn out range bound decision that should conclude soon. $XAUUSD #Gold $GLD $GC_F

$MXIM – MAXIM Integrated Products

May 16 – $MXIM over 20 MA on weekly is a long to 61.38 area. Pivots noted on chart.

Maxim Integrated’s Automotive Business Makes It a Buy https://finance.yahoo.com/news/maxim-integrated-automotive-business-makes-220500817.html?.tsrc=rss

$MXIM over 20 MA on weekly is a long to 61.38 area. Pivots noted on chart.

April 7 – $MXIM under 55.94 short side looks great. MACD turn. See Chart notes. #swingtrading

https://www.tradingview.com/chart/MXIM/l2JjyH3X-MXIM-under-55-94-short-side-looks-great-MACD-turn-Chart-notes/

$MXIM, chart, swing, short
$MXIM below 55.94 short side trade looks decent w MACD turned down on Weekly. Above 56.00 tough. #swingtrading

Mar 1 – $MXIM trade between the horizontal support and resistance lines.

https://www.tradingview.com/chart/MXIM/jZWbQmDZ-MXIM-trade-between-the-horizontal-support-and-resistance-lines/

$MXIM, trading, support, resistance
$MXIM trade between the horizontal support and resistance lines.

$ATHM – AutoHome

May 16 – Next resistance on $ATHM 110.38 – 110.43 on weekly chart model. Not much to report, it’s a long timed as best as you can and trim in to each resistance. Or wait for it to cool and then long it.

Autohome Quarterly Earnings Beat Estimates, Guides Higher https://finance.yahoo.com/m/8b2f7f27-3393-319d-80b9-4373aa52d5a8/autohome-quarterly-earnings.html?.tsrc=rss

If it comes off here it has support at 100.85 for a long side bounce test.

https://www.tradingview.com/chart/ATHM/TZltfarE-Next-resistance-on-ATHM-110-43/

$ATHM, weekly, chart
Next resistance on $ATHM 110.43

April 8 – $ATHM range bound trade in upper resistance area for some time. Looking for upside break or dump. Also of note, the Stochastic RSI is curling up here so the upside break could be soon but yet to be seen. No trade yet.

News: Why Autohome ($ATHM) Could Shock the Market Soon https://finance.yahoo.com/news/why-autohome-athm-could-shock-125412269.html?soc_src=social-sh&soc_trk=tw


$ATHM, daily, chart
$ATHM range bound trade in upper resistance area for some time. Looking for upside break or dump.

$BWA – BorgWarner

April 8 – $BWA structural trading upside quad test breaks targets 54.32 July 19. 50.56 46.68 if fail. MACD up. Stoch RSI short term sell.

Long at quad wall (blue diagonal dotted line) and short at top of quad until either breaks and go in direction of trade to next target.

On high watch here for me. Very, very nice structure.

https://www.tradingview.com/chart/BWA/OpKeTVFM-BWA-structural-trading-upside-quad-test-breaks-targets-54-32-Ju/

$BWA, chart, setup
$BWA structural trading upside quad test breaks targets 54.32 July 19. 50.56 46.68 if fail. MACD up. Stoch RSI short term sell.

Mar 1 – $BWA Under serious pressure with DOW slump and on 200 MA on Daily. Likely down further.

$BWA on weekly watching for possible bounce at 50 or 200 MA but MACD turned down.

$BWA, pressure, chart, daily, 200MA
$BWA Under serious pressure with DOW slump and on 200 MA. Likely down further.
$BWA, weekly, chart
$BWA on weekly watching for possible bounce at 50 or 200 MA but MACD turned down.

Jan 16 – $BWA needs to trade above 57.95 and hold to target higher in to earnings or it is lower. #swingtrading

https://www.tradingview.com/chart/BWA/JlOunzZI-BWA-needs-to-trade-above-57-95-and-hold-to-target-higher-in-to/

I have this one alarmed and will chart the swing trade targets to upside or downside as trade develops in to earnings set for Feb 8, 2018.

$BWA, swingtrading, chart
$BWA needs to trade above 57.95 and hold to target higher in to earnings or it is lower. #swingtrading

News on BorgWarber (BWA)

BorgWarner Inc. (BWA) has an Earnings ESP of +0.47% and a Zacks Rank #3. 

Headquartered in Auburn Hills, MI, BorgWarner is a leading manufacturer of powertrain products for major automakers. The company is expected to report fourth-quarter 2017 results on Feb 8.

BorgWarner supports initial launch of world’s first series-produced all-electric light-duty truck

BorgWarner, a global leader in clean and efficient technology solutions for combustion, hybrid and electric vehicles, supplies its HVH250 electric motor and eGearDrive® transmission for the initial launch of the FUSO eCanter truck, the world’s first series-produced all-electric light-duty truck.

Are Options Traders Betting on a Big Move in BorgWarner (BWA) Stock?

Clearly, options traders are pricing in a big move for BorgWarner, but what is the fundamental picture for the company? Currently, BorgWarner is a Zacks Rank #2 (Buy) in the Automotive – Original Equipment industry that ranks in the Top 40% of our Zacks Industry Rank. Over the last 60 days, two analysts have increased their earnings estimates for the current quarter, while none has dropped them.

$LIT  – Global Lithium

April 8 – $LIT Short side RR is low here and long to risky until Stoch RSI and MACD cross up. 

$LIT, chart
$LIT Short side RR is low here and long to risky until Stoch RSI and MACD cross up.

Mar 1 – Trading 34.22 lost 200 MA on daily – watching for a reconstruct bounce or continuation down. Watching.

Jan 23 – $LIT Lithium ETF trading 38.65 with Stoch RSI near bottom, MACD crossed down, SQZMOM red, watch for Stoch RSI cross up first.

$LIT, Lithium, Chart
$LIT Lithium ETF trading 38.65 with Stoch RSI near bottom, MACD crossed down, SQZMOM red, watch for Stoch RSI cross up first.

$BA – Boeing

April 8 – $BA great long trade since alerted near a year ago but now MACD turning down. Short side bias. Will alert.

$BA, chart
$BA great long trade since alerted near a year ago but now MACD turning down. Short side bias. Will alert.

Mar 1 – Trading 262.21 with indecisive indicators. Watching.

Jan 23 – $BA Boeing trading 338.00 with Stoch RSI turned down, MACD and SQZMOM extended. Assess when Stoch RSI curls up.

$BA, stock, chart, daily
$BA Boeing trading 338.00 with Stoch RSI turned down, MACD and SQZMOM extended. Assess when Stoch RSI curls up.

Nov 14 – Trading 262.28 and all indicators in my opinion are extended / tired to bull side. I may be wrong, but I don’t see any great risk reward thesis available to long or short side right now.

$EXK – EXK Silver Mining

April 8 – $EXK in compression mode between 20 MA and 50 MA. Watching.

$EXK, chart
$EXK in compression mode between 20 MA and 50 MA. Watching.

Mar 1 – $EXK under 200 MA on daily chart – watch for upside breach.

$EXK, daily, chart, 200 MA
$EXK under 200 MA on daily chart – watch for upside breach.

$BABA – Alibaba

April 8 – $BABA is short side bias but Stoch RSI likely turns soon for a pop and 200 MA test and likely short there.

$BABA Chart
$BABA is short side bias but Stoch RSI likely turns soon for a pop and 200 MA test and likely short there.

April 8 – $BABA 50 MA on weekly is a likely temporary bounce and then likely down. #swingtrading

$BABA, weekly, chart, 50 MA
$BABA 50 MA on weekly is a likely temporary bounce and then likely down. #swingtrading

Mar 1 – Trading 186.14 with indecisive topping formation. Watching.

Jan 23 – $BABA trading 184.02 earnings on Feb 1 with Stoch RSI, MACD, SQZMOM turned down. Testing 20 MA on daily.

$BABA, Daily, Chart
$BABA trading 184.02 earnings on Feb 1 with Stoch RSI, MACD, SQZMOM turned down. Testing 20 MA on daily.

Nov 14 – $BABA careful with swing trade long short term as Stoch RSI is down w MACD to likely follow trading near highs.

Here is the $BABA chart premarket https://www.tradingview.com/chart/BABA/FyzDSu1Q-BABA-careful-with-swing-trade-long-short-term-as-Stoch-RSI-is-d/

$BABA, swingtrading, chart, premarket
$BABA careful with swing trade long short term as Stoch RSI is down w MACD to likely follow trading near highs.

Oct 9 – $BABA Trading near recent highs, trending. On break w MACD SQZMOM up I may long. #swingtrading

BABA, swing, trading
$BABA Trading near recent highs, trending. On break w MACD SQZMOM up I may long. #swingtrading

Aug 7 – Trading 153.33. Trending above ma’s keeps coming back to 20 ma and bouncing and now past ER so it should pullback to a deeper ma in trend and on a bounce I’ll enter.

July 24 – Trading 152.02 ER 17 days and MACD may turn down? Hard to say. Watching.

July 14 – Trading 149.75. This also is in break out and extended well above MA’s. Watching.

July 5 – Trading 140.99 and has been in range for days now on daily. MACD trending down so I will wait for it to turn to assess.

June 26 – Trading 143.01. Well, here we go with the no pull back again. All indicators are trending up on daily but the Stoch RSI turned down on weekly and volume is consistently coming down so I think a pull back is near.

June 18 – Trading 134.87. Still no pull back and I continue to pay. Anyway on weekly stoch rsi is turned down so we will see but MACD and SQZMOM is turned up so who knows when it will stop.

June 6 – Trading 125.20. Didn’t get our pull back and we’re paying. BUT SQZMOM just slightly turned down on weekly now so maybe we’ll get that pullback yet.

May 31 – Trading 123.60. Watching for a pull back.

May 23 – Trading 125.10. Well we got the pullback around earnings and missed it. Hopefully some members got it. It’s trading at near ATH’s right now in premarket.

May 17 – Trading 124.00. Every indicator on hourly, daily and weekly are still flashing buy, however, there has been no pullback to get an entry long. Watching.

May 8 – Trading 117.20. Same as below. Earnings nine days away also.

May 3 – Watching for it to cool off. Unfortunately we did miss some of the move. Waiting for MACD to trend down and catch it on its next turn up.

April 24 – Watching.

April 19 – Closed 111.40 at target from 104.64 cost avg 500 shares. Will allow MACD to return to bottom for re-entry.

$BABA, Swing, Trading, Chart
$BABA Closed trade at 111.40 at target from 104.64 cost average #swingtrading

April 10 – Hit 110.45, very near our 111.40 target. Holding, trading 109.34. Long 104.64.

April 4 – Holding long 500 shares from 104.64 now trading 108.17. It is testing all time highs and we may add on a break of all time highs. If it pulls back we may cut for a small profit. First price target is 111.40 (see below)

$BABA Live chart with indicators including that SQZMOM indicator – sweeet tool! https://www.tradingview.com/chart/BABA/Lbao9BVu-BABA-Swing-Trade-going-well-Our-Swing-Trading-side-is-in-at-10/

$BABA Swing Trade going well. Our Swing Trading side is in at 104.64 trading at 108.17. #swingtrading pic.twitter.com/x2zOezrBQ3

— Melonopoly (@curtmelonopoly) April 4, 2017

March 27 – We’re long 104.64 500 shares March 22 at test of 20 MA. Stop is at our entry and we are looking for a fresh break-out. However, the market sentiment is not great right now so we are unsure. There is an upside pivot at 111.38 we are watching for resistance should price continue up. Also watching MACD close.

$BABA, Swing, Trading
$BABA Swing trade

March 20 – Wait for MACD to turn up and confirm and stay long until MACD turns down. The Stoch RSI seems to be frontrunning the MACD fyi. $BABA is one of my favorites right now and I see a long entry early in the week.

$BABA Live Trading Chart – https://www.tradingview.com/chart/SPY/GsGBi5f2-BABA-Daily-100-MA-50-MA-Cross-MACD-Pinch-SQZMOM-up-Stoch-RSI/

$BABA Daily 100 MA 50 MA Cross, MACD Pinch, SQZMOM up, Stoch RSI up. Wait for MACD for long. #swingtrading

$BABA, Swing, Trading, Chart
$BABA Daily 100 MA 50 MA Cross, MACD Pinch, SQZMOM up, Stoch RSI up. Wait for MACD for long. #swingtrading

Recent Trade Alerts / Chart Set-Up Posts:

$GDX Gold Miners (public alert, not on private Swing Trading Twitter Feed)

1:08 PM – 1 Apr 2018

This, one of the cleanest easiest trades in market. Chart notes. – #GDX chart

This, one of the cleanest easiest trades in market. Chart notes. – #GDX chart https://t.co/tbZte7ikx8

— Melonopoly (@curtmelonopoly) April 1, 2018

11:51 AM – 8 Apr 2018

$GDX 50 MA Test, Structure in Play – One of the Cleanest, Easiest Trades on the Market. See Chart Notes. $NUGT $DUST $JDST $JNUG $GLD #GOLD https://www.tradingview.com/chart/GDX/xqvoPTby-50-MA-Test-Structure-in-Play-Top-10-Easiest-Trades-See-Notes/ …

$GDX 50 MA Test, Structure in Play – One of the Cleanest, Easiest Trades on the Market. See Chart Notes. $NUGT $DUST $JDST $JNUG $GLD #GOLD https://t.co/EX9GrJPGPK pic.twitter.com/uNM4IIwwCY

— Rosie the Gold Algo (@ROSIEtheAlgo) April 8, 2018

$GDX, swing, trading, alert
$GDX 50 MA test, structure in play – one of the cleanest, easiest trades on the market $NUGT $DUST $JDST $JNUG $GLD

$C Citi

2:33 PM – 4 Apr 2018

Citi quad wall & historical support near. 74.46 PT Chart notes. – #C chart

http://www.tradingview.com/chart/C/qRDWOlvu-Citi-quad-wall-historical-support-near-74-46-PT-Chart-notes/ … …

$C Citi at a quad wall and historical support test here. 74.46 June 15 time cycle price target in play. #swingtrading

https://twitter.com/SwingAlerts_CT/status/981600758792642562

11:31 AM – 5 Apr 2018

$C Citi 70.75 HOD puts it up on day 2% from yesterday alert. Watch the 200 MA resistance overhead.

https://twitter.com/SwingAlerts_CT/status/981917242467213313

$C, Citi, swing, trading, alert
$C Citi 70.75 HOD puts it up on day 2% from yesterday alert. Watch the 200 MA resistance overhead.

$SPY SP500

9:40 AM – 28 Mar 2018 (originally on daytrading alert feed copied to Swing Trading alert feed also)

Trading 260.41 intra. $SPY Time cycle peak on this simple model is now. If its going to follow channel up it will be soon that it starts. If not, it could be another channel down yet. https://www.tradingview.com/chart/SPY/IDiDMAVs-SPY-Time-cycle-peak-on-this-simple-model-is-now-If-its-going-t/ …

https://twitter.com/DayAlerts_CT/status/978990333278253056/photo/1

11:28 AM – 5 Apr 2018

$SPY strong trade set-up from recent alerts intra 266.42 with 268.00 resistance on deck.

https://twitter.com/SwingAlerts_CT/status/981916489212100608

$SPY, swing, trading, alert
$SPY strong trade set-up from recent alerts intra 266.42 with 268.00 resistance on deck..png

$TSLA Tesla

3:11 PM – 4 Apr 2018

$TSLA long confirming here over 280.55 with 304.17 next resistance 382 Nov 15 price target. https://www.tradingview.com/chart/TSLA/dn8THUSe-TSLA-long-confirming-here-over-280-55-with-304-17-next-resistan/ …

https://twitter.com/SwingAlerts_CT/status/981610107770429443

11:23 AM – 5 Apr 2018

$TSLA also blasting here from yesterday’s alert trade hit intra resistance at 299.84 area. Strong set-up.

https://twitter.com/SwingAlerts_CT/status/981915345802973184

$TSLA, swing, trading, alert
$TSLA also blasting here from yesterday’s alert trade hit res at 299.84 area. Strong set-up.

$DIS Disney

3:24 PM – 4 Apr 2018

$DIS trading 100.57 has MACD on daily targeting 103.89 110.64 May 30. #swingtrading Other targets noted. https://www.tradingview.com/chart/DIS/241M4TSO-DIS-trading-100-57-has-MACD-on-daily-targeting-103-89-110-64-Ma/ …

https://twitter.com/SwingAlerts_CT/status/981613492896755713

11:22 AM – 5 Apr 2018

$DIS swing trade set-up from swing trading report yesterday blasting here. Nice set-up. Trading 101.81 intra-day.

https://twitter.com/SwingAlerts_CT/status/981914928528416768

$DIS, swing, trading, alert
$DIS swing trade set-up from swing trading report yesterday blasting here. Nice set-up..png

$CELG Celgene

5:56 PM – 26 Mar 2018

$CELG hit last price target – targets 95.90 Apr 3. Chart notes. https://www.tradingview.com/chart/CELG/RwZItPb8-CELG-hit-last-price-target-targets-95-90-Apr-3-Chart-notes/ …

https://twitter.com/SwingAlerts_CT/status/978390139201302529

1:21 PM – 8 Apr 2018

$CELG 86s to 91s off alert, buy sell trigger now. Waiting for trade direction triggers. Chart Notes. https://www.tradingview.com/chart/CELG/gdKoFxEq-CELG-86s-to-91s-off-alert-buy-sell-trigger-now-Chart-Notes/

https://twitter.com/SwingAlerts_CT/status/983031984753692672

$CELG, swing, trading, alert
$CELG 86s to 91s off real-time alert, buy sell trigger now. Looking for next price target in time cycle. #swingtrading

$FB Facebook

Buy side of $FB has started again in 164 range now… in a snap back long watch 167.50 mid quad resistance very closely.

12:17 PM – 20 Mar 2018

https://twitter.com/SwingAlerts_CT/status/976130671176450051

4:43 PM – 20 Mar 2018

$FB bounced off buy side alert earlier in 164s now trading 168.15 above mid quad support. #snapback #trading #alert

https://twitter.com/SwingAlerts_CT/status/976197473030037504

$FB, trading, alert, swing
$FB bounced off buy side alert earlier in 164s now trading 168.15 above mid quad support. #snapback #trading #alert

Email or DM me on Twitter anytime with thoughts or questions!

Cheers!

Curtis

Temporary Promo Discounts (for new members only).

Subscribe to Weekly Swing Trading Newsletter service here Reg 119.00. Promo Price 83.30 (30% off). Promo Code “30P”. 

Or Real-Time Swing Trading Alerts Reg 99.00. Promo Price 69.37 (30% off). Promo Code “Deal30”.

I personally guarantee our swing trading service is one of the best in the business and it’s very reasonably priced considering the technical expertise invested in the platform (Lead Trader).

Subscribe to Swing Trading Service:

Swing Trading Bundle (Swing Trading Newsletter and Live Swing Trading Alerts).

Swing Trading Newsletter (Weekly Newsletter Published for Traders).

Real-Time Swing Trading Alerts (Private Member only Twitter Feed).

One-on-One Trade Coaching (Via Skype or In-Person).

Free Mailing List(s):

Join Email List for Free Trade Charting Trade Set-ups, Deals, Podcasts and Public Webinars.

Free Swing Trading Periodical Contact Form (Complimentary Swing Trade Set-Ups to Email)

Public Chat:

Visit our Free Public Chat Room on Discord.

Follow Me:

Tweets by swingtrading_ct

Article Topics; $PSTG, $C, $AKTX, $DIS, $DXY, Gold $MXIM, $ATHM, Compound Trading, Swing, Trading, Stock, Picks, Alerts

Read More

Posts navigation

Older posts
Newer posts
Proudly powered by WordPress | Theme: sharksdesign by reviewexchanger.
 

Loading Comments...