Compound Trading Trading Plan and Watch List Friday May 11, 2018.
In this issue: $MOSY, $SPY, $GDX, $WTI, $AAPL, $AMBA, $HTZ, $AGN, $AMD and more.
Welcome to the morning Wall Street trading day session at Compound Trading!
Notices:
Our apologies for the late reporting this week (trade coaching events and coding office set-up delayed us). Next week will be on schedule.
Quick Update: Reporting, Live Rooms, New Team Members, Pricing, Discounts, Trade Coaching, New Book https://compoundtrading.com/quick-update-reporting-live-rooms-new-team-members-pricing-discounts-trade-coaching-new-book/
What’s New at Compound Trading April / May 2018. https://compoundtrading.com/whats-new-at-compound-trading-april-may-2018/
Price Increase: Platform wide price increase May 15, 2018. Does not affect existing members.
Machine Trading: May 15, 2018 the new teams start. Mandate: (1) Intelligent Assisted #IA Trading Platform (Code Algorithm Models), (2) Run 24 Hour Crypto Trading Desk, (3) Alert Trade Set-ups to Member Alert Feeds and near future (4) Machine Learning.
Notes in red text below are new comments entered specifically today (or recently important).
Live Trading Room Link:
http://compoundtrading1.clickmeeting.com/livetrading
Real-time Alerts for Oil, Gold, Swing Trading, Day Trading, Bitcoin are now available by following specific alert Twitter feeds.
Disclaimer / disclosure: Every subscriber must read this disclaimer.
Reporting and Next Gen Algorithms:
BE SURE to get in to each private Discord server specific to your subscription as many of the updates as we go forward will be posted in there. This includes the SWING TRADING platform also.
IF YOU NEED A LINK / INVITE email or DM us!
Connect with us on Discord.
https://twitter.com/CompoundTrading/status/880670140454637569
Recent Blog / Video / Social Posts:
#BitcoinTrading 101: A Beginner’s Guide to Getting Started $BTCUSD $XBTUSD $BTC https://compoundtrading.com/bitcointrading-101-beginners-guide-getting-started-btcusd-xbtusd-btc/ …
https://twitter.com/CompoundTrading/status/927397024315662336
How to Use EPIC Oil Algorithm: $USOIL, $WTI, $CL_F, $USO, $UCO, $SCO, $UWT, $DWT, #OIL, #OOTT: http://youtu.be/hawVV31G9bg?a via @YouTube
https://twitter.com/CompoundTrading/status/889148655785177088
How to Use ROSIE Gold Algorithm: #GOLD, $GLD, $XAUUSD, $GDX, $GDXJ, $NUGT, $DUST, $JNUG, $JDST
https://twitter.com/CompoundTrading/status/889147527278333952
Recent Chart / Trade Set-Ups:
See You Tube for other recent video posts.
Trading Set-ups $FB, $AMBA, $SDTY, $TSLA, $GDX, $SLV, $BTC, $JD, $VIX, $LITE, $CELG, $FSLR more.
Do Not Ignore This Trade Set-Up | $AMBA Swing Trade | 40% ROE 3 Mos (Part 1 of 2)
Password: ELON Protected: How to Trade the Tesla Move | Price Targets | Buy Sell Triggers | Time Cycles $TSLA #swingtrading #daytrading
Password: LONG Protected: Overnight Oil Trade | Trading Plan in Detail | EPIC Oil Algorithm $USOIL $WTI $CL_F #OIL $USO #Alerts
Trade Set-ups $SPY, $NFLX, OIL, $WTI, $ESPR, $GOOGL, Bitcoin, $BTC, $FEYE, $AAPL and more.
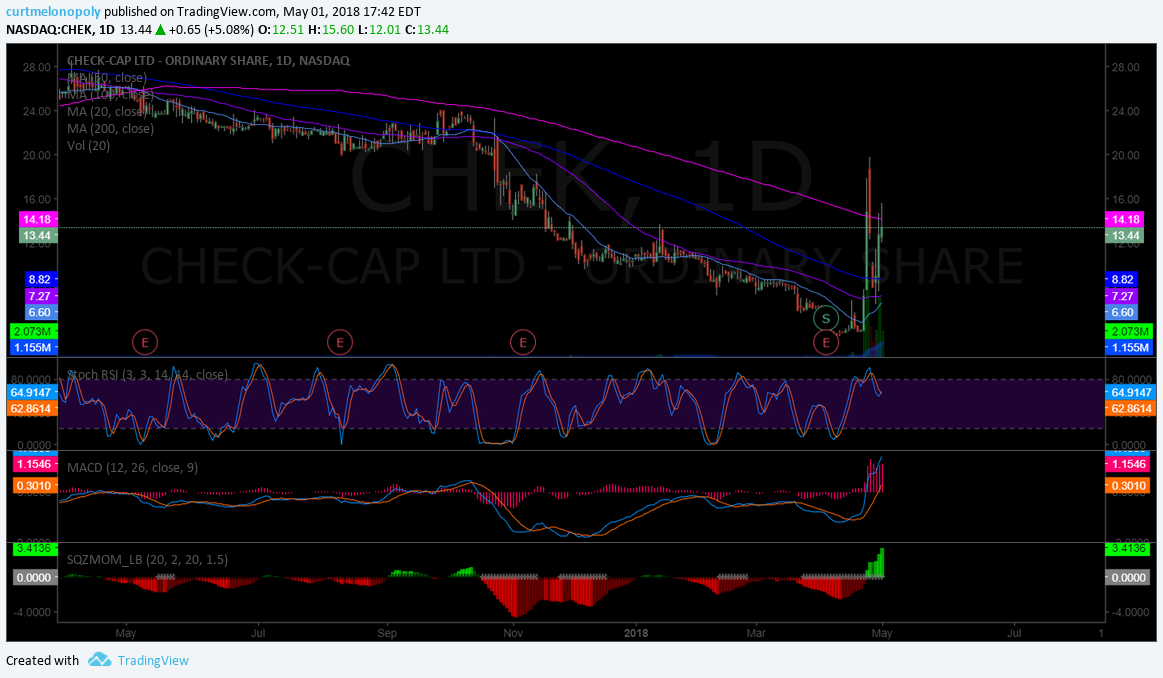
Trading Set-Ups $SPY, Gold, $GC_F, $GDX, Bitcoin, $GOOGL, $EVLV, $HEAR, $CHEK, $MARA, $PRTA, $ZDGE
Trading Set-Ups $NETE, $TSG, $ETH Ethereum, $BTC Bitcoin, $TAN, $HEAR, $AMMJ, $SNAP, $VLRX
Trade Set-Ups OIL, $WTI, $SPY, $GOOGL, $FSLR, $AXP, $GREK, $CELG, $AAOI, $SDRL, $WFT
Recent Educational Articles / Videos:
I get a lot of Q’s on How to Trade our models, this vid has 5 min explanation at 1:00 min-6:00 min. https://www.youtube.com/watch?v=QrXbE7lojAg&t=3s … – Fib Trendlines, Trading structure/quads, Price targets, Main support resistance (buy sell triggers), Time cycles, Moving averages, Trading trims/adds.
I get a lot of Q's on How to Trade our models, this vid has 5 min explanation at 1:00 min-6:00 min. https://t.co/oqezvVcn0y – Fib Trendlines, Trading structure/quads, Price targets, Main support resistance (buy sell triggers), Time cycles, Moving averages, Trading trims/adds.
— Melonopoly (@curtmelonopoly) May 9, 2018
Trading Plan (Buy, Hold, Sell) Watch Lists. Morning Momentum / Gap / News / PR / IPO / SEC Filings / Earnings Stocks on Watch:
Stocks making the biggest moves premarket: NVDA, DBX, YELP, NWSA, TRI, RDFN & more
Stocks making the biggest moves premarket: NVDA, DBX, YELP, NWSA, TRI, RDFN & more https://t.co/pppzvg8rIZ
— Melonopoly (@curtmelonopoly) May 11, 2018
6 Stocks To Watch For May 11, 2018 https://benzinga.com/z/11693439 $NVDA $SYMC $TRI $TTD $YELP $WOW
6 Stocks To Watch For May 11, 2018 https://t.co/Y7AO56Kidl $NVDA $SYMC $TRI $TTD $YELP $WOW
— Benzinga (@Benzinga) May 11, 2018
Market Observation:
As of 8:10 AM: US Dollar $DXY trading 92.72, Oil FX $USOIL ($WTI) trading 71.28, Gold $GLD trading 1324.41, Silver $SLV trading 16.77, $SPY 272.30, Bitcoin $BTC.X $BTCUSD $XBTUSD 9337.00 and $VIX trading 13.5.
Momentum Stocks to Watch:
$MOSY $TTD
News:
$ATOS $MOSY $RCKT
$KTOV Kitov Announces Consensi™ Commercialization Agreement for China
Kitov also has a 5/31/18 PDUFA date
$RXII Enters into Material Transfer Agreement with Iovance Biotherapeutics
Recent SEC Filings:
Recent IPO’s:
Earnings:
#earnings for the week
$NVDA $DIS $JD $VRX $ROKU $CTSH $PETS $TSN $SYY $WB $AMC $EA $GRPN $ETSY $MTCH $BKNG $MCHP $AAOI $ICPT $TWLO $SRE $LPX $ENB $SN $ETP $TSEM $ALB $KOS $MNK $TTD $ICHR $DNR $OAS $MNST $MELI $SINA $MAR $TEUM $BUD $DISCA $ARQL $CTL
#earnings for the week$NVDA $DIS $JD $VRX $ROKU $CTSH $PETS $TSN $SYY $WB $AMC $EA $GRPN $ETSY $MTCH $BKNG $MCHP $AAOI $ICPT $TWLO $SRE $LPX $ENB $SN $ETP $TSEM $ALB $KOS $MNK $TTD $ICHR $DNR $OAS $MNST $MELI $SINA $MAR $TEUM $BUD $DISCA $ARQL $CTL https://t.co/r57QUKKDXL https://t.co/MH3qVcVQ6Z
— Melonopoly (@curtmelonopoly) May 6, 2018
Trade Set-up Alerts & Reports. Recent / Current Holds, Open and Closed Trades:
$SPY Daily Chart, ending week bullish with MACD turned up, price above MA’s and 20 MA about to cross. $ES_F $SPXL $SPXS

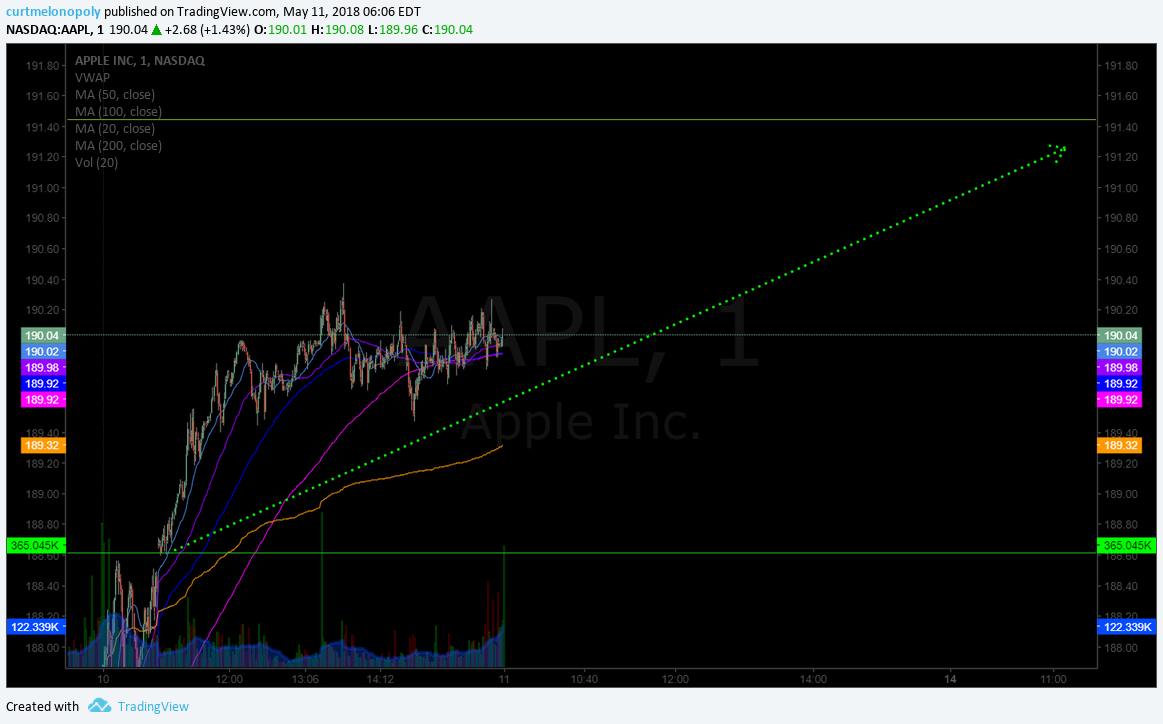
$AAPL premarket

$GDX has played out perfect hitting 22.99 today with 23.13 target. Be sure to take profits. #swingtrading

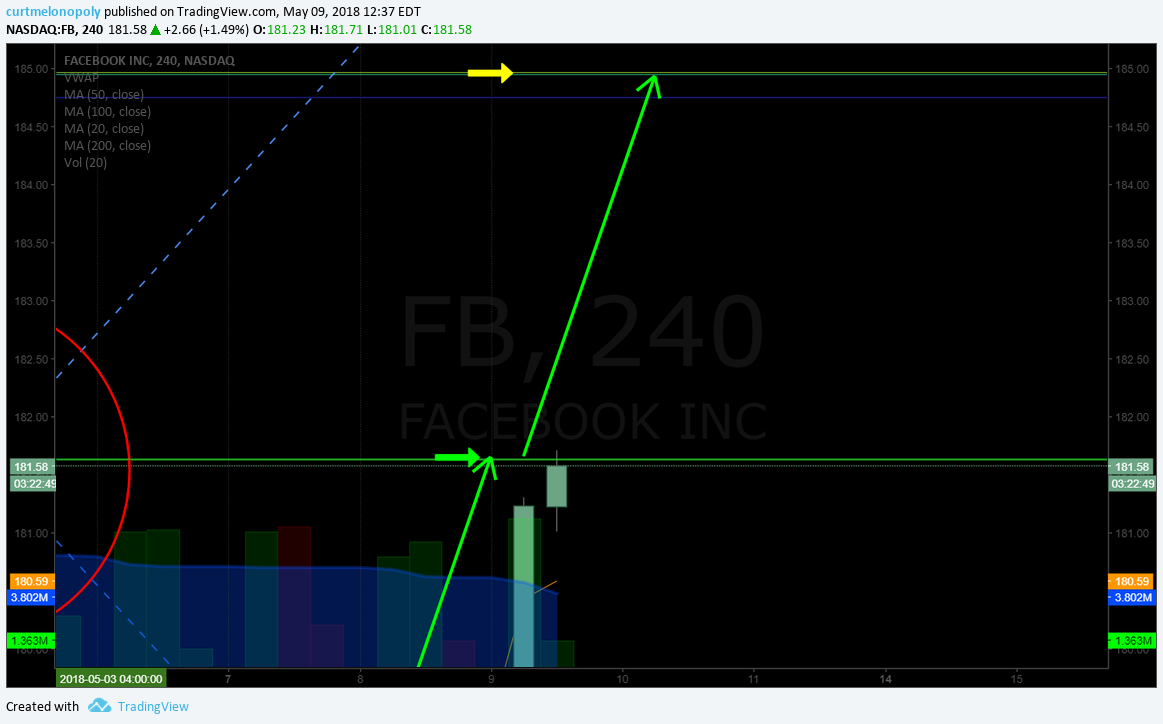
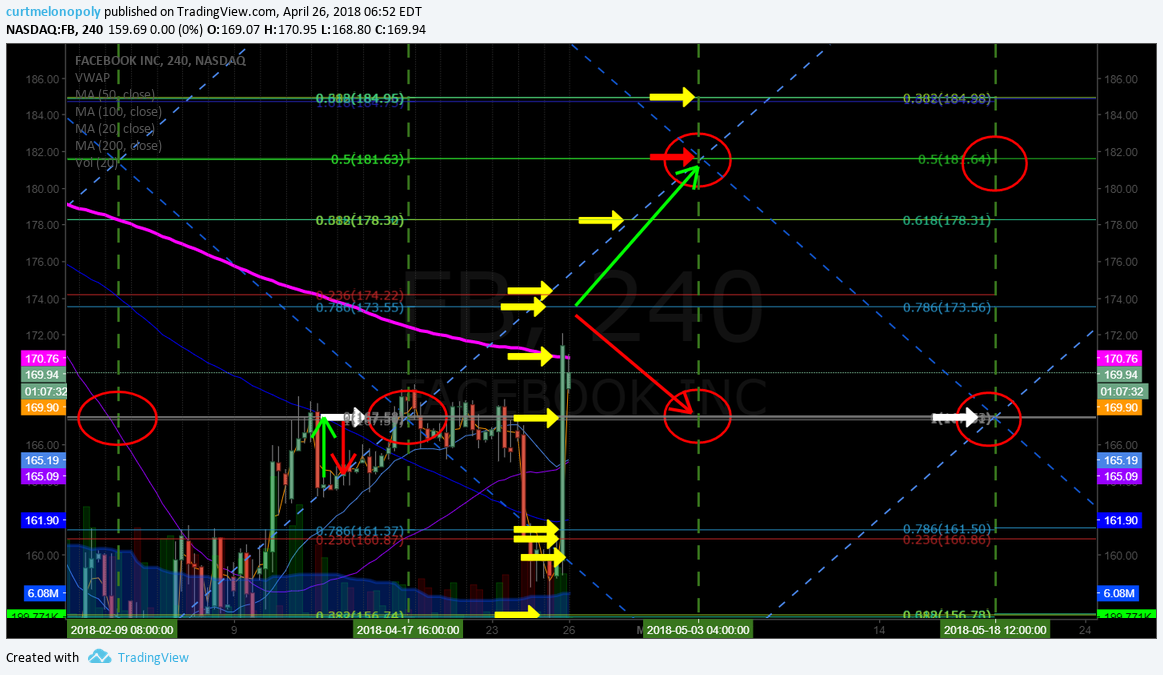
This is a big test for $FB here, wise to be trimming in to this resistance and add above.

$HTZ In it to win it. Trading 17.60 up 2.7% #daytrading #snapback #washout

Long side bias $HTZ over 200 MA on 3 min buy side 17.51 for 18.50 target on 5 min 200 MA

$TSLA long side adds triggered over 50 MA targeting 100 MA 318.00 (trim into add above) then 326.00

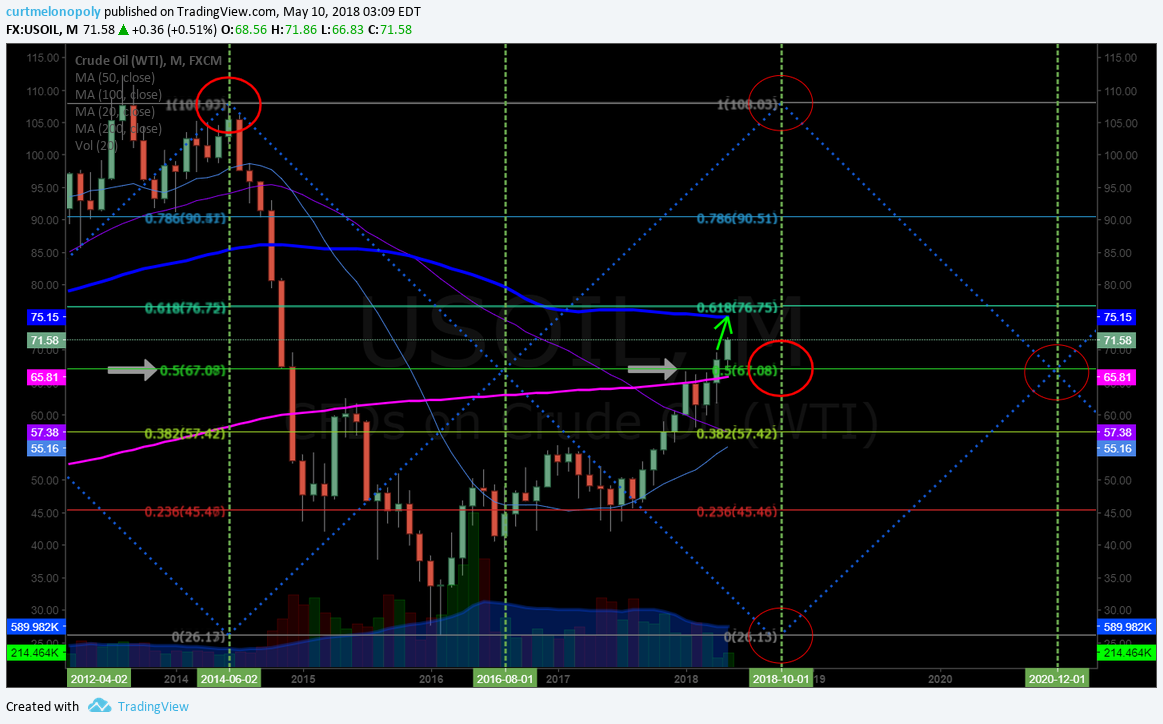
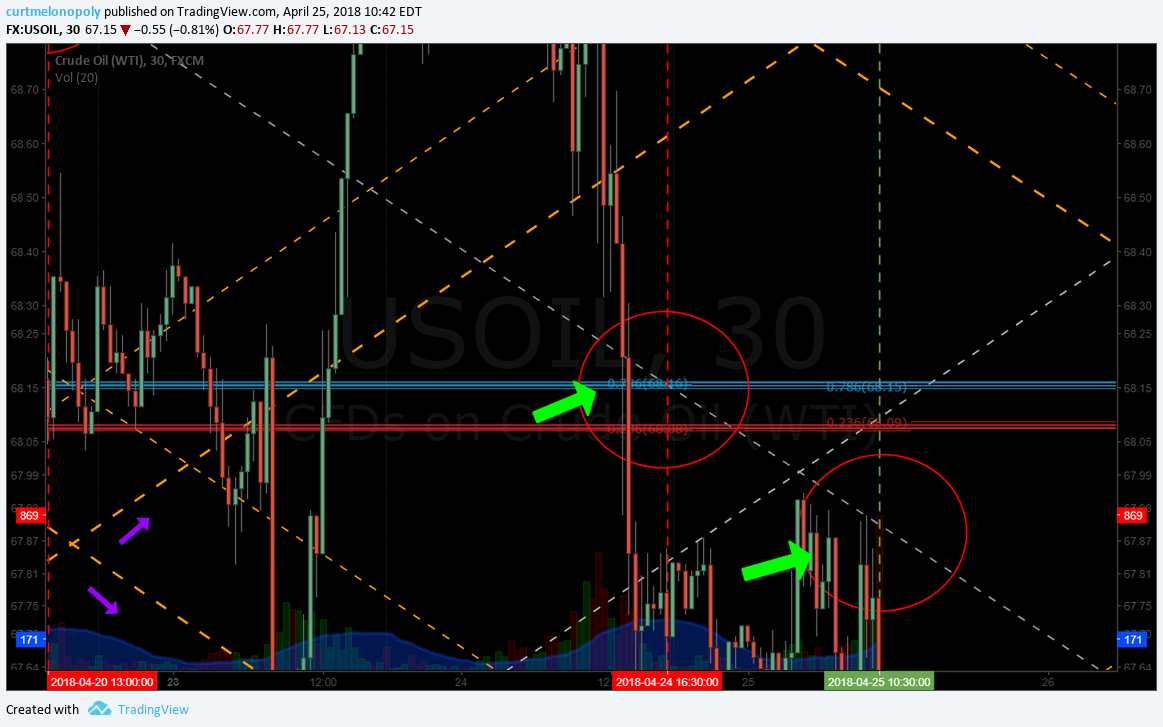
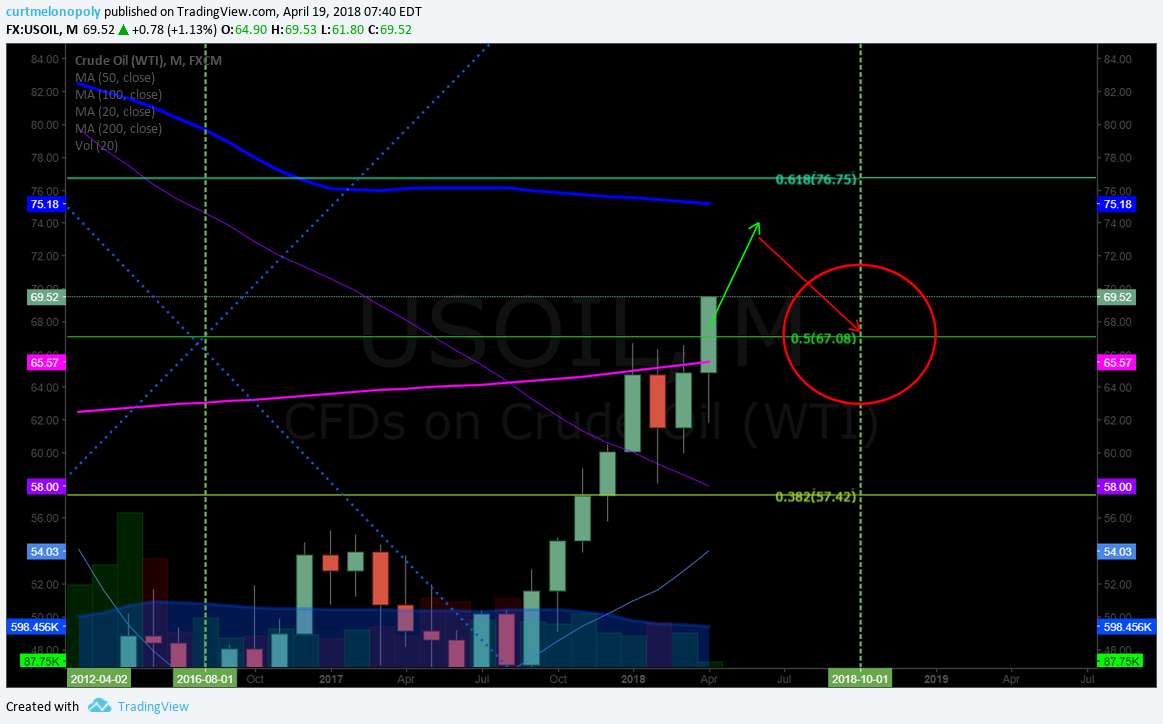
100 MA resistance test on oil monthly chart comes in right where Fib resistance comes in on weekly chart. $USOIL $WTI

$AMBA strength in to time cycle peak, over 200 MA trading 52.21 targeting 54.26 54.65. Careful other side of time peak expect some retrace possible.

$AMD over 200 MA targeting 12.24 significant resistance at mid quad, trim in to it and add above.

Per recent;
$JD came off hard after alert to trim. Nice quick gap fill play. Holding ER is dangerous.

$DXY US Dollar watch the 92.40 area. Above is structural and bullish bias. $UUP

$AMBA hit 51.60 today per alert next price target 51.50, trim in to resistance add above. Above 200 MA 51.93 targets 54.23

$AMBA hitting alerted targets – Part 1 of 2: How to Trade the Move. Do Not Ignore This Trade Set-Up | 40% ROE 3 Mos https://t.co/cn9VfebT0t
— Melonopoly (@curtmelonopoly) May 9, 2018
$AAPL swing trade set up going well. 186.68 at open with 188.60 target in site. Trim as it nears.

Long swing traders in oil need to pay close attention to 100 MA on monthly 75.00 area. FX $USOIL $WTI

$ITCI did get pop at 200 MA support as expected and alerted. MACD cross but SQZMOM still red. Up 7.8% today. Trading 19.43.

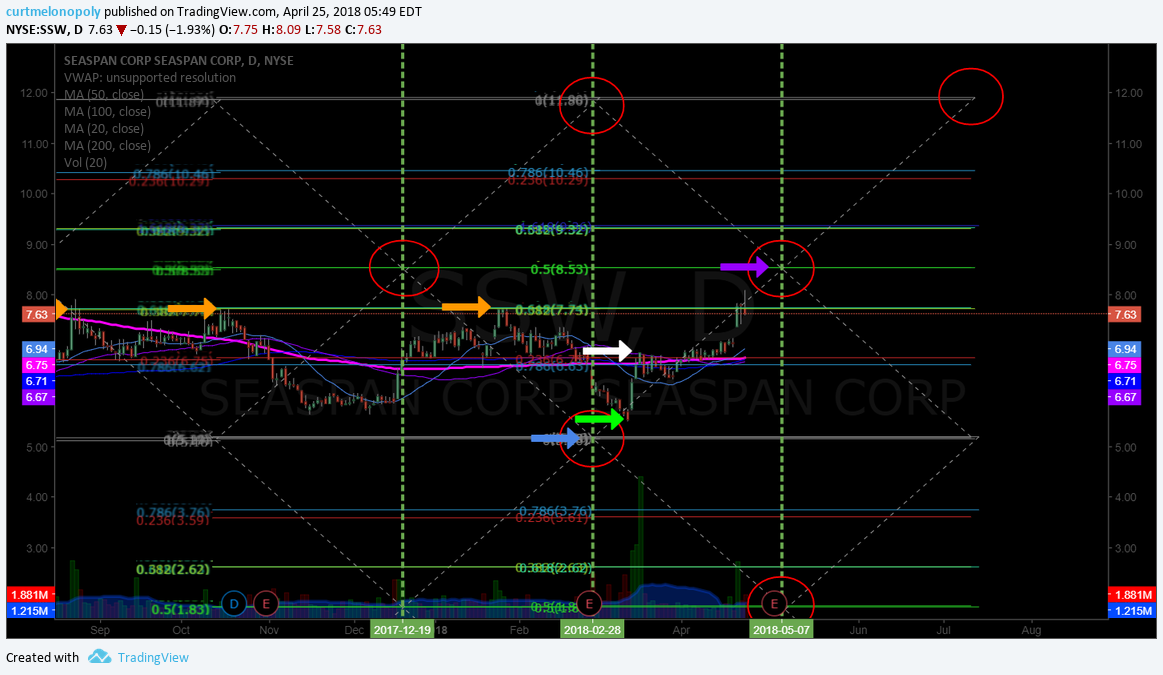
$SSW nailed the target for May 9 perfect. Swing trading precision. #swingtrading

US Dollar Index looking serious about this move. Above 200 MA and MACD took flight. $DXY $UUP

$AGN time cycle expires June 4 and they present soon. And it’s a massive time-cycle completion. Notes on chart. #swingtrading

Market Outlook, Market News and Social Bits From Around the Internet:
Economic Data Scheduled For Friday
Economic Data Scheduled For Friday pic.twitter.com/b58ED7vpfx
— Benzinga (@Benzinga) May 11, 2018
#5things
-Trump’s North Korea opportunity
-U.S. yield curve
-Fall of Rome
-Markets mixed
-Unusual oil comments
https://bloom.bg/2I7Gf8N
#5things
-Trump's North Korea opportunity
-U.S. yield curve
-Fall of Rome
-Markets mixed
-Unusual oil comments https://t.co/f9wvl8tbp8 pic.twitter.com/UAxnAcLMOt— Bloomberg Markets (@markets) May 11, 2018
If you are new to our trading service you should review recent blog posts, the Compound Trading YouTube Channel and at minimum our algorithm Twitter feeds because they do tell a story in terms of the market and how the inflections of the market determine our day to day trading. You will notice the algorithmic modelling has been undeniably accurate with many time-frames (intra-day, weeks and months out) so I myself have learned to respect their math (they have taken me from a 60% hit rate to 80%+ in my trading – all publicly posted live trades).
Momentum Stocks (Market Open and Intra-Day):
I do trade morning momo stocks, but I do avoid much of the day trading risk (preferring to daytrade only what is structurally set-up also on the swing trade side and to my advantage in the algorithmic model charting). I often avoid the first 30 minutes (gap and go) and trade momentum stocks or structured (per explanation in previous sentence) stocks later in day after a wash-out looking for a snap-back trade that can possibly also become a strong swing or longer term trade that I can leg in to. Just prior to open and shortly after open I post momentum stocks to the trade chat room (and Twitter and Stocktwits if I have time).
Some of my Favorite Intra-day Trading Set-Ups:
(1) Momentum Stock Wash-Outs for Snap Back, (2) Bad News Wash-outs on Stocks with High Institutional Ownership, (3) Getting on the Right Side of a Trend Change and scaling in my position and (4) Our Algorithm Charting Model Set-Ups.
The momentum stocks (from previous days and morning trade) I continue to watch through the day for indicators that allow a trade.
Morning Stock Watch-Lists for my Favorite Set-Ups:
(1) Pre-Market Gainers Watch-List: $MOSY $TTD $ANFI $FRTA $KTOV $IMMR $AMH $RXII $DGSE $VRAY $ADXS $IQ $MAURY $SITO $MT $SOXS $EXEL $RBS $JNUG $USLV
(2) Pre-market Decliners Watch-List :
(3) Other Watch-List:
(4) Regular Algo Charting Watch-List: Gold $GC_F $GLD, Miners $GDX ($NUGT, $DUST, $JDST, $JNUG), Silver $SLV $SI_F ($USLV, $DSLV), Crude Oil FX: $USOIL $WTI ($UWT, $DWT, $USO, $UCO, $CL_F, $UWT, $DWT), Natural Gas $NG_F ($UGAZ, $DGAZ), S & P 500 $SPY $ES_F ($SPXL, $SPXS), US Dollar Index $DXY ($UUP), Volatility $VIX ($TVIX, $UVXY), $BTCUSD Bitcoin.
(5) Recent Upgrades:
$NVDA $VZ $JEC $VYGR $USB $NHI $BMA $SUPV $FTI $ZYME $MRT $RBS $BFR $RARE $MERC $GXP $SRPT $SATS $AKCA $TPRE $BIDU
HubSpot Inc $HUBS PT Raised to $120 at RBC Capital
The Trade Desk $TTD PT Raised to $80 at RBC Capital
(6) Recent Downgrades:
$MG $LB $SYMC $IHG $TU $TSU $PSDO $TGI $MATR $KSS $HALO $COTY $OBLN
Stay tuned in Stock Chat Room for more pre-market stocks on watch.
Study:
For new readers, a review of our unlocked posts on our blog would help you get in to the story we are following with the securities listed in this newsletter.
Free scanners to find momentum stocks that you can easily review charts of for indicators that bring probability of your trade being successful up considerably. These are not useful for first 30 minute market open gap and go type plays (you need a good momentum scanner, level 2, and best to have hot-keys for the first 30 mins of gap and go trading)… but are very useful for intra day scalping and swing trading (start with trending stocks and then look at indicators intra for simple set-ups – study scan study scan study scan).
http://finviz.com/
https://finance.yahoo.com/screener/predefined/ec5bebb9-b7b2-4474-9e5c-3e258b61cbe6
http://www.highshortinterest.com/
http://www.gurufocus.com/short-stocks.php
http://www.3xetf.com/all/
http://www.etf.com/channels/gold-etfs
GL!
Curtis
Algorithm Twitter feeds can be found here: $BTC (@CryptotheAlgo) $WTI (@EPICtheAlgo), $VIX (@VexatiousVIX), $SPY (@FREEDOMtheAlgo), $GLD (@ROSIEtheAlgo), $SLV (@SuperNovaAlgo), $DXY (@DXYUSD_Index). Our Swing Trading Twitter feed is found here: https://twitter.com/swingtrading_ct. Our lead trader Twitter feed is here @curtmelonopoly and lead tech developer @hundalSHS.
Article Topics: Premarket, Watchlist, Stocks, Trading, Plan, $MOSY, $SPY, $GDX, $WTI, $AAPL, $AMBA, $HTZ, $AGN, $AMD