EPIC Oil Trading Algorithm Chart Report Monday June 11, 2018.
FX: $USOIL $WTIC $USO $CL_F $UWT $DWT $UCO $SCO $ERX $ERY $GUSH $DRIP
Welcome to the oil trading algorithm report. My name is EPIC the Oil Algorithm and I am one of six primary Algorithmic Chart Model services in development at Compound Trading Group (there are near 300 in total in development at various stages).
NOTICES:
New members to our oil trading algorithm charting model can on-board in a way that best equips you to be profitable.
Visit my Twitter feed EPIC Oil Algorithm Twitter (@EPICtheAlgo) and review tweets over the last few months, visit our blog and review the recent oil algorithm blog posts, our You Tube channel “how my oil algorithm works”, “how to use my charting”, weekly EIA oil report videos and our website (it explains how the oil algorithm was developed). Reviewing those important points of reference will increase your chance of success considerably. In this report, some recent example “how-to” videos are included also.
Oil Trade Coaching – Users of this algorithmic oil charting model may opt for private one-on-one coaching with our lead trader and / or an experienced trader that has worked under our lead trader. On our website standard one-on-one online coaching packages are made available (coaching via Skype) or you can request a customized package (reflecting the time you wish to invest in learning). To request a custom package suited to your needs email info@compoundtrading.com or click here for standard private trade coaching packages. Other options for coaching include online webinars and private on location and in-person coaching sessions.
Oil Trading – How to Use the Oil Algorithm
Oil Trading – How to Trade Intra-day with my Algorithmic Charting
MULTI-USERS: Institutional / commercial platform now available.
SOFTWARE: My algorithmic charting is planned to go to developer coding phase for our trader’s dashboard program. Please review my algorithm development process, about my oil algorithm story on our website www.compoundtrading.com and my oil algo charting posts on my Twitter feed and/or this blog.
HOW MY ALGORITHM WORKS: I am an oil algorithm model in development. My math is based on traditional indicators (up to fifty at any given time each weighted on win ratio merit – all not shown on chart at any given time) – such as simple math calculations relating to price and volume, Fibonacci, simple pivots, moving averages, Gann, Schiff and various other charting, geometric and mathematical factors. I do not yet have AI or Geo Political integration – only math as it relates to traditional indicators with the primary goal being probabilities. I am not a high frequency robot type algorithm – I am presented on (and used on) a traditional trading chart as one would normally use as a probability indicator. The goal is to provide our trader’s with an edge when triggering entries and exits on trades with instruments that rely on the price of crude oil.
Below you will find simplified levels represented on a traditional chart (both intra-day and as a swing trader or investor). This work (and associated trade) should be considered one decision at a time, “if this happens then this or this are my targets”… price – trigger – trade and so on. Questions to; info@compoundtrading.com, message our lead trader on Twitter, or message a lead trader in the private Discord oil trade room server.
Visit this link for more information about my oil algorithm development, this link explains how our algorithmic charting is done, this YouTube video explains in summary how my algorithm works https://www.youtube.com/watch?v=LUNyxFoXJp8 this link for more information about our algorithmic stock charting models and what makes them different than most.
EVERY CALL WE MAKE, EVERY PUBLIC INTERACTION, REPRESENTATION OF TRADE SIGNAL (ON EVERY VENUE) IS VIDEO RECORDED, ON SOCIAL MEDIA OR ON BLOG / WEBSITE TIME-STAMPED FOR PERMANENT RECORD AND TRANSPARENCY. PLEASE ALSO REFER TO OUR PUBLIC DISCLOSURE https://compoundtrading.com/disclosure-disclaimer/.
Oil Algorithm Observations:
Below is the link for the live chart version of EPIC the Oil Algorithm. The charting is a real-time trading chart represented on FX $USOIL $WTI published June 11, 2018.
Click on share button (bottom right beside flag) and when that screen opens click on “make it mine” to view real-time, make edits etc:

June 11, 2018
The first most predictable trade are the resistance and support cluster areas formed by long term chart trend lines (see charts that have trend-lines represented in red as made available below).
The second most predictable trade (wide trading range primary resistance and support that become predictable buy and sell triggers). Current algorithmic model wide trading range resistance (grey arrow – grey horizontal line) at approximately 68.93 in the current trading range. Current algorithmic model wide trading range support (grey arrow – grey horizontal line) at approximately 65.32 in the current trading range – these areas are general range support and resistance areas (our algorithm uses a .15 – .20 cent buffer on either side for these trades). Trading between the resistance / support horizontal grey lines is extremely profitable risk – reward if one is disciplined to the patience required and follows the trend of trade.
The lower trading range is 61.71 to 65.32
The upper trading range is 68.93 to 72.54
Trading Bias / Forward Guidance: Watching support land resistance levels – trade is indecisive at this point. Some charts below given reason for a long bias and some for a short bias.
Currently (as of June 11, 2018) MACD is still trending down on the daily oil chart.
Third most predictable trade (support and resistance of uptrend or down trend channels). On the chart an upward trending trade channel is presented and a downward option (channel support and resistance / trading range is represented as diagonal dotted orange lines and purple arrows – as made available, assist in displaying directional trade decision areas).
Fourth most predictable trade (support and resistance of 30 min quadrants). The diagonal lines make up quadrants (in this instance on a 30 min chart) and are represented as orange diagonal lines that make up geometric diamond shapes. These lines also assist in intra-day trade.
Fifth most predictable trade (support and resistance of most applicable Fibonacci) the Fib support and resistance lines are the horizontal lines in various colors with the exception of purple and yellow (see below). These horizontal lines become support and resistance for intra-day trade.
Sixth most predictable trade (support and resistance of historical support and resistance) Natural / historical support and resistance lines shown in purple or yellow – they represent historical support and resistance. The strongest of the historical support and resistance lines are shown in yellow horizontal and are typically accompanied by a yellow arrow marker.
Seventh most predictable trade signal we use are the time and price targets (red circles). When trade is in a significant uptrend or downtrend the targets become very precise and move up the indicator priority list quick.
Tues, Wed and Fri targets are most predictable in extended multi week uptrends or downtrends. In recent time trade could be described as range-bound.
The Eighth most predictable trade is intra-day. You will notice on some of the charting geometric shapes in green on some of my charting (at times). They are charted live in the trading room and at times the lead trader will highlight these areas intra with white outlines (typically geometric shapes such as diamonds or triangles).
Intra-day Trading Bias
Currently no bias is formed. Will watch for a confirmation on model for downtrend or uptrend channel.
Wide Trading Range – Buy and Sell Triggers for Swing Trading Oil:
Trade the ranges noted above between the thick grey lines (grey arrows) for the most predictable swing trades in the lower region are between 58.13 to 61.72, 61.72 to 65.32, 65.32 to 68.92, 68.93 to 72.54 and 72.54 to 76.15. This is a highly profitable risk-reward way to trade oil if you can be patient to trigger at only the break of the wide range charting areas and are disciplined to cut a losing trade that does not prove in your anticipated trend.
Or trade the range between the channel diagonal lines at support and resistance in up or down channel.
Oil Algorithm (EPIC). Up trending channel. June 11 130 AM FX $USOIL $WTI $USO $UWT $DWT $CL_F #OIL #Algorithm #OOTT

Oil Algorithm (EPIC). Down trending channel. June 11 131 AM FX $USOIL $WTI $USO $UWT $DWT $CL_F #OIL #Algorithm #OOTT

Oil Swing Trade Considerations.
Monthly oil chart:
Oil Chart (Monthly). Trade under 200 MA under pivot but 20 MA about to breach 50 MA – indecisive. June 11 157 AM FX $USOIL $WTI $USO $UWT $DWT $CL_F #OIL

Per recent;
Oil Chart (Monthly). Trade struggling with pivot. Trade rest on 200 MA under pivot. June 3 1030 PM FX $USOIL $WTI $USO $UWT $DWT $CL_F #OIL

Per recent;
Oil trade in sell-off bounced off 200 MA on Monthly Chart as support for now. $USOIL $WTI $USO #OIL #OilTrading

Weekly Oil Chart:
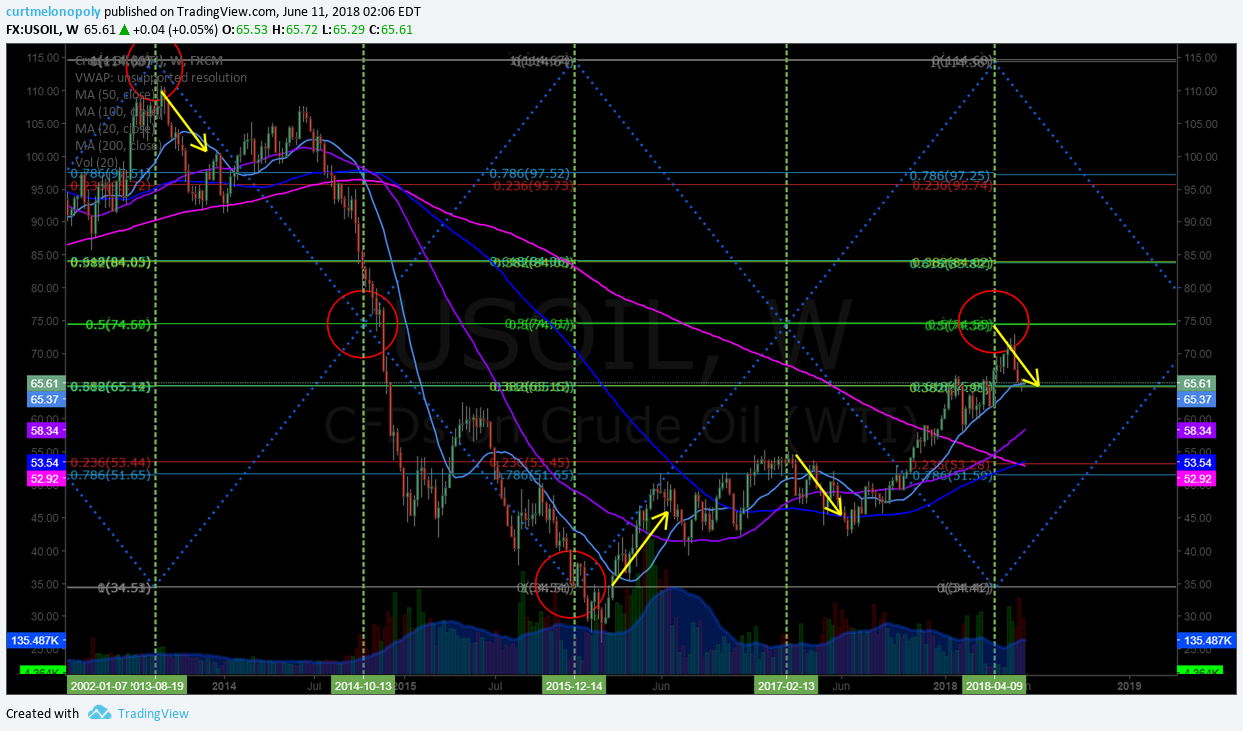
Oil Algorithm Model (Weekly – Gen 1). 20 MA and Fibonacci support test still in progress. June 11 207 AM FX $USOIL $WTI $USO $UWT $DWT $CL_F #OIL #Algorithm #OOTT

Per recent;
Oil Algorithm Model (Weekly Gen 1). 20 MA and Fibonacci support test in progress. June 3 1014 PM FX $USOIL $WTI $USO $UWT $DWT $CL_F #OIL #Algorithm #OOTT

Oil Chart (Weekly). SImple Fibonacci work suggests 64.50 support and 69.53 resistance are key . June 3 1037 PM FX $USOIL $WTI $USO $UWT $DWT $CL_F #OIL
https://www.tradingview.com/chart/USOIL/13wqrAsl-Oil-Chart-Weekly-SImple-Fibonacci-work-suggets-64-50-support/

May 21 – A feature post was published this week to review time cycles, retrace possibilities on the other side of time cycles on the weekly charts. Below is the post link:
Feature Post: 12 of Last 13 Oil Chart Time-Cycles Have Trend Reversal. $USOIL $WTI $CL_F $USO $UCO $UWT $DWT #OIL #OOTT
Daily Oil Chart:
Oil Chart (Daily). K.I.S.S. chart has MACD still turned down price on 100 MA. June 11 203 AM FX $USOIL $WTI $USO $UWT $DWT $CL_F #OIL #OOTT

Per recent;
Oil Chart (Daily). K.I.S.S. charting says short bias since MACD turned May 22, 2018. FX $USOIL $WTI $USO $UWT $DWT $CL_F #OIL #OOTT

Diagonal Trend Lines:
Diagonal trend-lines are critical inflection points (currently represented in red below on our conventional charting).
Please review many of my recent posts so you can learn about how important these diagonal trend-lines are. If one is breached you can look to pull-back to next diagonal trend line about 90% of the time. Also pay attention to how thick the lines are – the thicker the line the more important because they represent extensions from previous time / price cycles.
Remember you can come in to the chat room to message the trader and REMEMBER I have posted a live chart link in this post so if you can’t see the lines well on this chart above you can go to the live chart link and watch for member live algo chart links through-out the day in your email inbox!
The diagonal trend-lines are marked on chart below:
Oil Chart (Weekly). Oil trendline chart on weekly time-frame. June 11 201 AM FX $USOIL $WTI $USO $UWT $DWT $CL_F #OIL

Per recent;
Oil Chart (Weekly). The validity of this trendline work is ambiguous, but something to watch. June 4 1219 AM FX $USOIL $WTI $USO $UWT $DWT $CL_F #OIL

Per previous:
Oil has now cleared every trendline resistance provided on conventional charting I’ve posted last year. $USOIL $WTI $CL_F #OOTT #OIL $USO $UWT $DWT 233 PM Jan 1

Oil chart. Conventional indicator considerations (notes on chart). $USOIL $WTI $CL_F #OOTT #OIL $USO $UWT $DWT 608 PM Dec 17, 2017

Previous posts for perspective;

Notice how when the daily chart is opened, the simple lines extend to current day trade.
Daily chart view. Simple lines show expose clusters of resistance. Crude algo intra work sheet 213 AM Apr 10 FX $USOIL $WTIC #OIL $CL_F CL $USO $UCO $SCO $UWT $DWT #OOTT

Fibonacci Levels:
Watch the lines for support and resistance. Careful using them as traditional retracement levels with crude because the algo lines etc are more dominant / predictable. But the Fib lines are excellent indicators for intra-day trade support and resistance.
The Fibonacci lines are marked on main chart above.
Horizontal Trend-Lines (purple):
Horizontal trend-lines are not as important as the other indicators reviewed above, however, they do serve as important resistance and support intra-day for tight trading and they are important if thick (in other words they come from previous time / price cycles). WE STARTED TO REPRESENT THE REALLY IMPORTANT LINES IN YELLOW FYI FOR EASE. Refer to chart for current applicable horizontal trend-lines.
Horizontal trend-lines are marked on charts above.
Oil Time / Price Cycles:
Watch your email and / or my Twitter feed for time price cycles they may start to terminate.
Time / price cycles are the single most important indicator and my record calling them is near 100% – since inception seven months ago. The reason they are so important is that a trader does not want to be holding a crude oil instrument at termination of a time cycle if not absolutely sure if price will go up or down. A trade may choose to enter a large position in advance of a time price cycle termination IF THERE IS A HIGH PROBABILITY OF A DIRECTION IN PRICE and if the market is trading at a really important pivot area. In other words, if the market is trading at the bottom of the upward trending channel at a support (yellow lines) and we knew there was a significant probability of a time cycle about to terminate a trader may enter with a long position. The price really spikes or drops significantly when these important time cycles terminate.
The problem with time / price cycle terminations is they change from minute to minute (depending on where price is on the chart) so you have to be in the trade room to get the alert. Our lead traders will do everything they can in future to send these on SMS but we have to be careful because it can be difficult with so much going on in the room. The reason they (time cycles) change is because they are actually represented by or are geometric shapes in the chart – I know it sounds odd but I have (as I mentioned) hit these calls just shy of 100%. The oil political people know the same algorithmic modeling principles and they ALWAYS TIME THEIR BIG ANNOUNCEMENTS AROUND THE TIME PRICE CYCLE TERMINATIONS.
So if you can picture a triangle on the chart – and price is trading in the triangle – and price is going to come to the edge of the triangle and there is a significant support or resistance or an algo line terminating there too or a target (those type of indications)… then we know there is a high probability of a time and price change. In other words, it is where there are clusters of algorithm points that cross and when price is going to cross over that cluster is where they are. And these are represented on all the different time frames – the larger the time frame – the larger the time price cycle termination – the larger the spike or downdraft. This is where we establish our intra-day quadrants from for sniping trades (which we will put in to the room soon because it looks like the geo political rhetoric is over for a while making them more predictable). Difficult to explain in short. So we will do our best to SMS alert these in future.
Also, the real large or important time / price cycle terminations we know far in advance and they can be put in these newsletters.
If you review my Epic the Oil Algo Twitter feed, my blog posts and my story on our website you will get a feel for how accurate these calls are.
Alpha Algo Trading Trend-Lines (Primary – Red dotted lines. Secondary – White dotted lines):
To determine which algo line is most alpha (or probable) intra day, it is the nearest line to price action. This can also help you determine the trend of trade. If the algo line is trending up the price will follow it up until price is tested at an algorithm indicator (the main tests are diagonal trendlines, horizontal trendlines, time / price cycles etc – as I have shared with you). This is why it is important to watch all the lines because they are all support and resistance. To keep it simple trade the range (yellow lines) as I’ve mentioned but keep an eye on these indicators.
Current Alpha Algo Targets (Red circles):
Your closest target that crude is trending toward is always the most probable.Then, your second most probable is the one that is up or down trend depending on whether general price is in an upward or downtrend for the most recent week or so and what your other indicators look like (such as the MA’s I explained above).
The other way to determine which targets are in play is actually quite simple, you will notice that crude trades between the channel lines up and down and up and down and there are various support and resistance along the way. If it hits a target at the top of the channel you can bet most times (unless the next day like today) that the next target hit will be at the bottom of the channel.
Wait for the price to trend toward a target and take your position and watch as price gets closer and closer to the target. Remember, that the machines trade from decision to decision – or in other words from support to next resistance or resistance to next support or when the times come each week on Tuesday Wednesday and Friday they will trend toward the target that market price action determines they go to.
Our lead trader will explain more in the room and do not hesitate to ask our lead trader in the room by private message or on twitter to explain intra day decisions.
Recent Live Oil Trade Alerts:
June 11 – Alerts section will be updated soon.
June 4 – Will update the alerts section soon.
Anyone remember this tweet from last September. Last time oil had 200 MA w 20 MA breach, price ripped 39.80s to 51.50s fast (6 weeks). $USOIL $WTI $CL_F #OIL #OOTT $UWT $DWT

Oil Chart (Daily) Price took a double upside rip extension since. FX $USOIL $WTI $USO $UWT $DWT $CL_F #OIL #OOTT

May 29 – Will update the alerts section soon.
May 21 – Will update the alerts section soon.
May 13 – Will update the alerts section soon.
April 29 – I will update the trade alerts on the next report when there is more time. The bottom line is that since last report the trades have been fantastic winners.
EPIC on fire, not quite 100% win rate, but close. Oil hit all 5 price targets from Friday alert. I left early so only got a piece of it. Alert- Long 67.73 scalp intra on FX $USOIL $WTI with 67.43 stop. PT 68.49. Trim at and add over res 67.85 68.07 68.14 @OilAlerts_CT
EPIC on fire, not quite 100% win rate, but close. Oil hit all 5 price targets from Friday alert. I left early so only got a piece of it. Alert- Long 67.73 scalp intra on FX $USOIL $WTI with 67.43 stop. PT 68.49. Trim at and add over res 67.85 68.07 68.14 @OilAlerts_CT pic.twitter.com/PJuxQw9nqZ
— Melonopoly (@curtmelonopoly) April 22, 2018
Oil hit all 5 price targets from Friday alert. I left early so only got a piece of it.

Just noticed I accidentally put the short side trade alert on my personal twitter feed https://twitter.com/curtmelonopoly/status/986147196658647040 … “Oil short side bias trade setup intra trading 66.47 with 66.20 target expiring btwn 230 and 630 AM ET. Tight stop SS initial alert. Unclear at this point.”
https://twitter.com/OilAlerts_CT/status/986152086806192128
Trading 66.30 from 66.47 entry nearing 66.20 SS target – trim short bias
https://twitter.com/OilAlerts_CT/status/986151044949381121
Trading 66.24 cover trim on way to target
https://twitter.com/OilAlerts_CT/status/986156872729350144
There it is – 66.20 intra day short target reached – bias to all or near all cover here from 66.47 intra scalp alert.
https://twitter.com/OilAlerts_CT/status/986159824491696128

Per recent;
“Oil is very near a quad trading range support area (gray) and lower quad time cycle peak. $USOIL $WTI $CL_F $USO $UWT $DWT #OOTT”
https://twitter.com/OilAlerts_CT/status/981524847703490560
Fantastic #EIA trade near quad support, buy side steps in, first resistance hits, boom. Near perfect. $USOIL $WTI $CL_F $USO $UWT $DWT #OOTT

Oil is very near a quad trading range support area (gray) and lower quad time cycle peak. $USOIL $WTI $CL_F $USO $UWT $DWT #OOTT

The alert detail as it was posted on feed. Short side trade alert. EPIC Oil Algorithm Chart Model FX $USOIL $WTI #OIL $USO $UWT $DWT $CL_F #OOTT #Algo
The alert detail as it was posted on feed. Short side trade alert. EPIC Oil Algorithm Chart Model FX $USOIL $WTI #OIL $USO $UWT $DWT $CL_F #OOTT #Algo pic.twitter.com/kTZZEvi9MX
— Melonopoly (@curtmelonopoly) March 22, 2018
Summary of short side trade alert. EPIC Oil Algorithm Chart Model FX $USOIL $WTI #OIL $USO $UWT $DWT $CL_F #OOTT #Algo https://www.tradingview.com/chart/USOIL/yi9JI683-Summary-of-short-side-trade-alert-EPIC-Oil-Algorithm-Chart-Model/ …
Summary of short side trade alert. EPIC Oil Algorithm Chart Model FX $USOIL $WTI #OIL $USO $UWT $DWT $CL_F #OOTT #Algo https://t.co/wOjTLdGph2 pic.twitter.com/GwCWlGMiR9
— Melonopoly (@curtmelonopoly) March 22, 2018
Recent Oil Algorithm Price Target Hits:
June 4 – Will update target hits section soon.
May 29 – Will update target hits section soon.
May 21 – Will update target hits section soon.
May 13 – Will update target hits section soon.
Perfect price target hit Wed 1030 as provided on weekend report. EPIC Oil Algorithm $USOIL $WTI #OIL $USO $UWT $DWT $CL_F #OOTT #Algo #EIA

Trade moving in to Wed 1030 PT as provided on weekend report. EPIC Oil Algorithm $USOIL $WTI #OIL $USO $UWT $DWT $CL_F #OOTT #Algo

Trade fell in to Tues 430 price target (early) and on track to Wed 1030 PT as provided on weekend report. EPIC Oil Algorithm $USOIL $WTI #OIL $USO $UWT $DWT $CL_F #OOTT #Algo

Keep in mind that there are three price targets per week for down channel and up channel scenarios. Below are examples of targets hit to upside channel or down channel.
Price target hit for Tues 1030 #EIA as provided on weekend report. EPIC Oil Algorithm $USOIL $WTI #OIL $USO $UWT $DWT $CL_F #OOTT #Algo

Tues 430 price target hit as provided on weekend report. EPIC Oil Algorithm $USOIL $WTI #OIL #OOTT $UWT $DWT $USO

Tues Mar 13 430 #OIL perfect hit to price predict target as provided on prior wknd report. EPIC Oil Algorithm Chart FX $USOIL $WTI $USO $UWT $DWT $CL_F #OOTT #Algo

Wed 1030 Mar 14 #EIA #OIL perfect hit to price predict target as provided on prior wknd report. EPIC Oil Algorithm Chart FX $USOIL $WTI $USO $UWT $DWT $CL_F #OOTT #Algo

Per recent;
Tues Mar 6 price target perfect hit to minute and penny as provided on prior weekend report. EPIC Oil Algorithm Chart FX $USOIL $WTI #OIL $USO $UWT $DWT $CL_F #OOTT #Algo
Private Member Server Screen shot of #EIA #OIL targets in play from wknd report. EPIC Oil Algorithm Chart FX $USOIL $WTI $USO $UWT $DWT $CL_F #OOTT #Algo

#EIA #OIL price target in play as provided on wknd report (Tues hit perfect). EPIC Oil Algorithm Chart FX $USOIL $WTI $USO $UWT $DWT $CL_F #OOTT #Algo

#EIA #OIL upper price target touch only and dumped in to lower target as provided on prior wknd report . EPIC Oil Algorithm Chart FX $USOIL $WTI $USO $UWT $DWT $CL_F #OOTT #Algo

#EIA #OIL in to lower target as provided on prior wknd report . EPIC Oil Algorithm Chart FX $USOIL $WTI $USO $UWT $DWT $CL_F #OOTT #Algo

Screen shot of price and time target hit as provided on report 5 days prior. EPIC Oil Algorithm FX $USOIL $WTI #OIL $USO $UWT $DWT $CL_F #OOTT #Algo

Wed #EIA 1030 Feb 28 perfect hit to target at exact cent and minute as provided on weekend report. EPIC Oil Algorithm FX $USOIL $WTI #OIL $USO $UWT $DWT $CL_F #OOTT #Algo

Tues 430 Feb 27 price time target perfect hit as provided on weekend report. EPIC Oil Algorithm FX $USOIL $WTI #OIL $USO $UWT $DWT $CL_F #OOTT #Algo

Fri Feb 23 price time target perfect hit as provided on report 5 days prior. EPIC Oil Algorithm FX $USOIL $WTI #OIL $USO $UWT $DWT $CL_F #OOTT #Algo

Per recent;
Oil Wed 1030 AM EIA report price target perfect hit, as provided on weekend report. EPIC Oil Algorithm Chart FX $USOIL $WTI #OIL $USO $UWT $DWT $CL_F #OOTT #Algo

Oil Intra-Day Algo Trading Quadrants (white dotted lines):
Trading quadrants are simply support and resistance lines that can assist your intra-day trading – they are not alpha or primary support and resistance by any measure. Price action does however typically move more assertively when leaving a trading quadrant.
Indicator Methods:
As explained above, my algorithm is a consideration of up to fifty traditional indicators at any one time – each one given its own weight in accordance to its accuracy (win rate). This is how we establish the probability of specific targets hitting (we call them alpha algo targets).
Alpha Algo Targets, Algo Trend-lines, Algo Timing, Quadrants for Intra Snipes
Algo targets are the red circles – they correspond with important times each week in oil reporting land. Tuesday 4:30 PM, Wednesday 10:30 AM and Friday at 1:00 PM. The red dotted diagonal lines are the algo trend-lines. And the vertical dotted (red or green) are marking the important times each week. You will find that the price of crude will hit one of the alpha algo targets about 90% of the time. In the absence of market direction the machines take price to the next algo line and/or target. Understanding how the price of crude reacts to the algos and how they move price from target to target is critical for intra-day and swing trading crude oil and associated instruments.
You will notice that price action of crude will use these algo trend-lines and act as support and resistance, and that price also often violently moves when an alpha algo line is breached either upward or downward.
We cover this in much more detail in the member updates, trading room. A review of my Twitter feed and previous blog posts will help you understand the relation of these indicators. We will start posting video blogs (for my subscribers) on YouTube (in addition to my daily blog posts) for swing traders that work during regular trading hours.
Also… we will cover how to establish algo trend-lines and price targets future forward (as you have seen me do on my Twitter feed for some time now).
Conclusion:
See you in the live trade room! And again, if you struggle to know how to use these indicators as a trader’s edge, it is recommended (if you have earnestly reviewed all of our documentation first) that you obtain private coaching prior to trading a real account with real money – we recommend you use a paper trading account at first.
You can also send specific questions to our email inbox at info@compoundtrading.com – if you do this be sure to ask a specific question so it can be answered specifically. When the 24 hour oil trading room opens you will have ample opportunity in that 24 hour room to ask questions also.
Watch my EPIC the Oil Algo Twitter feed for intra day notices and your email in box for member only material intra day also.
EPIC the Oil Algo
Subscribe to my Service here:
Standalone Oil Algorithm Newsletter (member charting sent out weekly).
Real-Time Oil Trading Alerts (Private Twitter feed).
Oil Trading Room Bundle (includes weekly newsletter charting and real-time trading alerts on Twitter).
Commercial / Institutional Multi User License (for professional trading groups).
One-on-One Trade Coaching (Via Skype or in person).
Temporary Discount Offers:
30% Off Oil Newsletter: Use Promo Coupon Code “epic30” When Subscribing to our Weekly Oil Newsletter Here: https://compoundtrading.com/product/standalone-epic-newsletter/ (cancel anytime, for new members only to trial the service).
30% Off Oil Alerts: Use Promo Coupon Code “oilalerts30” for Real-Time Oil Trade Alerts via Private Twitter Feed @OilAlerts_CT Here: https://compoundtrading.com/product/live-oil-trading-alerts/?attribute_plan=One+Month (cancel anytime, for new members only to trial the service).
Click here to find all information and pricing on Oil Newsletter, Trading Chat Room, Oil Alerts and more.
Connect:
Register to free email list for trade set-ups, webinars, special events: https://compoundtrading.com/contact/
Website: https://compoundtrading.com
Blog: https://compoundtrading.com/blog/
Free chat room: https://discord.gg/2HRTk6n
Subscribe: https://compoundtrading.com/overview-…
Twitter: https://twitter.com/CompoundTrading
Lead Trader: https://twitter.com/curtmelonopoly
Tradingview: https://www.tradingview.com/u/curtmel…
Facebook: https://www.facebook.com/compoundtrad…
StockTwits: https://stocktwits.com/compoundtrading
Email: https://info@compoundtrading.com
Curtis Melonopoly (@curtmelonopoly) is rated Top 250 Stock exchanges authority, covering also Mathematical finance and Economy of the United States
Article topics: EPIC, Oil, Algorithm, Trading, Crude, $USOIL, $WTI, $USO, $UCO, $CL_F, $UWT, $DWT, Chart