Skip to content

Compound Trading Group

  • About
  • White Paper
  • Returns
  • News
    • NOTICE of Online Information Meetings
  • Order
    • Terms
  • About
  • White Paper
  • Returns
  • News
    • NOTICE of Online Information Meetings
  • Order
    • Terms

Tag Archives: Algorithm

  1.   »  
  2. Tag Archives: Algorithm

Tag: Algorithm

Algorithmic Trading Strategies for Crude Oil (CL) Day Trading, Swing Trading and Position Trading. Supplementary Article for Clients.

June 7, 2020June 7, 2020 Curt MelonopolyCrude Oil Trading Algorithm (EPIC), Crude Oil Trading StrategyAlgorithm, Algorithmic, Crude Oil, Day Trading, intra day, machine trading, Position, Swing Trading, Trading, Trend

Algorithmic Trading Strategies for Crude Oil (CL) Day Trading, Trend and Swing Trading. Intra-Day, Daily, Weekly, Monthly Time-Frames.

This is a supplemental document for CL trade strategies for and as included in our algorithmic client oil reporting.

The various reporting included for our clients includes and is not limited to; live oil trade alerts (on Twitter, Discord, email and live in our Trading Room), conventional charting, algorithmic chart models, various trade signals, price targets, symmetry, time cycles and various other guidance.

We endeavor to assimilate the vast algorithmic data our computer scientists derive for our oil traders to action for a trader’s edge.

The algorithmic material is suitable for actionable mechanically executed trading and are also the models our coding team reference for our crude oil machine learning trade development.

You will find in the array of documentation and reporting we provide a well developed, time-tested proven rules based system for crude oil trading that is one of the best available.  Oil traders should use all the models together as a structured system of trade for it to work to your best advantage.

With each chart model (in various reporting) we may include “best-use” trade strategy notes and/or “rules-based trade indications” for your consideration. The oil trading room and study of the Discord oil chat room is your best resource for real-time learning.

For perspective, review historical reporting on our blog and the various videos we have published to the Compound Trading YouTube channel.

Much of the structured model discipline developed in our system is similar in concept as discussed in this video; Mathematician Who Cracked Wall Street.

Our “How to Trade Crude Oil” Recommendations.

Crude oil price moves within structured areas (ranges) of trade represented on charting on various time frames (different time cycles of trade) often in symmetrical price extensions or mirrored fractals, historical price support and resistance, channels and simple price ranges.

The structure oil price moves within (the range of price) can be one minute charting (and more recently some machine trade is as low as 15 second time-frame) timing through to monthly charting.

Time-frame set-ups / strategies included in reporting are charted as conventional chart set-ups and/ or algorithmic chart set-ups (structures).

Understanding and having each chart time-frame at your immediate access (both conventional and algorithmic) will increase the probability of profitable trading.

You will find in reviewing the raw recorded video feed or in attending the live oil trading room that in the morning a lead trader will often review on mic the various levels of support and resistance on various oil trade time-frames on the charting to establish the most probable areas of trade for the strategy of trade.

The lead trader will also check with all the chart time-frames prior to entering a day trade at various times through the day.

When multiple time-frames agree to support or resistance (especially symmetrical) areas on the charting (with trend) this becomes your highest probability area of trade execution, we have found this to be one of the best oil trading strategies.

Sizing trades appropriate to your trading account, probability of support or resistance (multiple oil chart time-frames in agreement) and time frame for each set-up is a positive strategy.

Using the correct chart time-frame specific to your trading strategy is critical. Generally, the lower (smaller) the time frame the less predictable the support and resistance areas (or structure) of the chart will be. However, the larger time-frames (monthly, weekly, daily) may also have significant “slippage” but the primary structure will often remain intact.

Generally, the idea is to enter your positions based on the structure for the specific time frame you are wanting to trade referencing the other time frame support and resistance or range within the trend. The basic method is to understand the range of trade and execute trade long bias when price is near support for the appropriate time frame / structure and the opposite is true for short trades.

Our staff use the thirty minute model structures (range within trends) most often for primary areas of support and resistance trading signals referencing all other time-frames in their trading strategy. More recently the 60 minute and 120 minute time-frames are being used by our staff as it provides a wider view of the current structure of oil trade (post COVID black swan machine code updates).

Trade positions should be significantly biased to the trending range of trade. 

Below are recent videos from webinars we recorded in our Oil Trading Room:

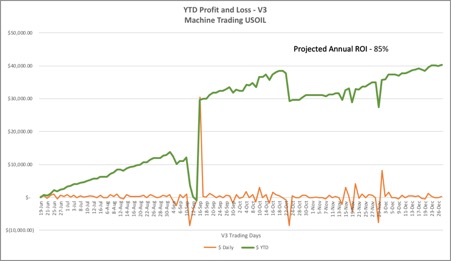
“How to Profit With EPIC v3 Crude Oil Machine Trades.”

“How to Use Our Oil Trading Services. Oil Trade Alerts, Oil Trading Room, Oil Reports, Trade Coaching”.

The recently released white paper(s) about EPIC v3 explains also its method of execution of trades and is a great supplemental piece of documentation for live human traders to reference for trading bias, see the report here;

EPIC V3.1.1 Crude Oil Machine Trade Software Update | June 4, 2020 White Paper #OOTT $CL_F $USO $USOIL

EPIC V3.1 Crude Oil Machine Trade Software Update Details | White Paper #OOTT $CL_F $USO $USOIL

White Paper: How EPIC v3 Crude Oil Machine Trading Outperforms Conventional Trading Methods

If you have questions about the models below please email us at compoundtradingofficial@gmail.com and if you are a client you can send your Whatsapp phone number to that email and connect direct to our lead trader for intra-day question(s).

Not all charts are updated every week and some concept or test charts are added or deleted on occasion.

Be sure to check the time-stamp of each chart in reporting as the preparation of charts and/or models can take days prior to publication and distribution of this report.

If you are a new client that would like to review historical reports that are still locked on the blog from public view please email the office with your request and we will send you recent report credentials for unlocking reports for review.

Please note, chart links that support the models and unlisted videos from live trade, for reporting set-ups and webinars are now distributed specific to each user or small group of users. If you are using more than one device to access these, to avoid disruption of service, please email us a simple / general description of those devices to assist in controlling dissemination.

EPIC Crude Oil Algorithm Model. 30 Minute Oil Chart Structure (see historical client reporting for the model).

The EPIC algorithm model chart is a proprietary structure that has been back tested sixty months on thirteen time-frames. The model represents the most probable areas of support and resistance in oil trade within this specific time-frame. During a black swan event adjust your trade bias to a larger 60 minute or 120 minute algorithmic model time-frame.

This (the EPIC 30 Minute Oil Algorithm Chart Model) is our most proven oil trading structure / strategy.

The levels noted on the EPIC model are to be used as important areas of consideration for support and resistance (trade signals) for your trading strategy when using conventional charting set-ups / structures and/or other algorithmic charting.

Resistance and support areas on the thirty minute oil trade structure chart are at each line on the algorithmic chart. The primary areas of support and resistance are;

  • Outer quadrant walls / also used as channel support and resistance (orange dotted diagonal lines), the half way point between each is often an executable buy or sell trigger in trade,
  • Mid channel line for uptrend and down trend (white dotted diagonal),
  • Mid quad horizontal (not marked but is at the mid point of the quad),
  • Fibonacci levels (various horizontal colored lines on model),
  • Historical areas of support and resistance (purple horizontal lines on model).
  • The intra-week swing trading range is from thick horizontal gray line to the next (commonly becomes a pivot area of trade). You will find on the larger time frame models of the one hour, two hour and four hour that these key horizontal swing range support and resistance levels are marked as green and gray alternating.
  • The important historical diagonal trend-lines (conventional trend lines) are represented on the chart as thick white lines.
  • Also of note are the price targets for Tuesday 4:30 PM (API), Wednesday 10:30 AM (EIA) and Friday 1:00 PM (Rig Count). The Tuesday and Wednesday targets hit significantly more often than the Friday target (red circles with red or green vertical dotted lines intersecting).
  • At times other indicators are added to the chart such as important trend lines “in play”, moving averages and more.

The video at this link explains How to Use EPIC Oil Algorithm: $USOIL, $WTI, $CL_F, $USO, #OIL, #Trading, #Algorithm, #OOTT as does this video Oil Trading Room – How to Use EPIC the Oil Algorithm Model Chart June 21 #OIL #OOTT and this Webinar 1: EPIC the Oil Algorithm.

When conventional crude oil charting coincides (or agrees) with the EPIC algorithmic model support and resistance this is then considered a significant buy or sell trigger (signal) for crude oil trade.

Be aware (at minimum) of the primary support and resistance areas on the larger time-frames (lower time frames are not as critical) – in this instance (when trading the 30 min time frame) the 1 hour, 2 hour, 4 hour, daily, weekly and monthly charting should be considered when sizing your trades.

Also, more recently we have been adding models for the one hour and two hour time-frames (post COVID black swan event), please be sure to review these models as they are sent out.

This document is sent out to clients for the purpose of “supplemental” to the regular reporting to keep the regular reporting as short as possible. Also, ultimately it is the intra-day or intra-week information provided to our clients that also becomes key for trade bias.

I will also update this document extensively in the near future with a number of live trade video clips to show examples of intra-day trade, swing trade and position trading strategies we are using (for study guide purposes).

Thank you.

Curt

Further Learning:

If you would like to learn more, click here and visit our Crude Oil Trading Academy page for complimentary oil trading knowledge – posts from our top crude oil traders that includes learning systems, blog posts and videos.

Welcome to NYMEX WTI Light Sweet Crude Oil Futures.

Subscribe to Oil Trading Platform:

Standalone Oil Algorithm Newsletter (Member Charting Reports sent out weekly at times in report form or updated on email regularly).

Real-Time Oil Trading Alerts (Private Twitter feed and Discord Private Server Chat Room).

Oil Trading Room Bundle (includes Weekly Newsletter, Trading Room, Charting and real-time Trading Alerts on Twitter and private Discord Chat Room Server).

Commercial / Institutional Multi User License (for professional trading groups).

One-on-One Trade Coaching (Via Skype or in person).

Tweets by EPICtheAlgo

Article Topics; Crude Oil, Day Trading, Swing Trading, Algorithm, Algorithmic, Trading, Trend, Position, Intra Day, Machine Trading, Supplement Article


Read More

Protected: Part 3 – Algorithmic Crude Oil Trading Strategies (Day Trading, Swing Trading, Position Trading, Time Frames, Models)

June 6, 2020June 7, 2020 Curt MelonopolyCrude Oil Day Trading, Crude Oil Newsletter, Crude Oil Trading Algorithm (EPIC)Algorithm, Algorithmic, Crude Oil, Day Trading, Swing Trading, Trading

This content is password protected. To view it please enter your password below:

Read More

EPIC V3.1 Crude Oil Machine Trade Software Update Details | White Paper #OOTT $CL_F $USO $USOIL

April 19, 2020December 12, 2023 Epic the AlgoCrude Oil Newsletter, Machine Trading$CL_F, $USO, $USOIL, Algorithm, Crude, Daytrading, EPIC, Futures, machine trading, Oil, Oil Trading Room, Trade Alerts, Trading

EPIC V3.1 Crude Oil Machine Trading Software Code Upgrade Details | White Paper Update 

April 19, 2020

EPIC crude oil machine trading software is a proprietary software development project with an aim to trade crude oil futures. Historical reference can be found at the linked document below.

Click here for the original white paper drafts for EPIC V3 Crude Oil Machine Trade Software.

This white paper update is specific to the EPIC V3.1 software coding update completed for live trade use commencing April 19, 2020.

Purpose of Software Update

In recent crude oil futures trade, specifically since the COVID-19 black swan event, the trading price range and volatility of oil trade (OVX) has been divergent of historical structure.

See chart below: Crude Oil Volatility Index (OVX) chart showing oil trade volatility spiking from the 20s to 330s during black swan event.

crude oil, volatility, OVX
Crude Oil Volatility Index (OVX) chart showing oil trade volatility spiking from the 20s to 330s during black swan event.

Impact to Software

The volatility in trade and the range of price negatively impacts the smaller range of accounts our software may trade at any given time. More specifically any account trading CL futures less than 10 contracts or approximately 100,000.00 in size is at significant risk. At 10 contract size to 30 contract size the risk is considerably mitigated but still present and at 30 contract size or greater the risk is almost completely eliminated.

While markets are functioning within historical normal trading ranges this is not the case, a 10 contract size account is at very low risk with EPIC V3 software and micro accounts (anything smaller than 10 contracts) there is moderate to considerable risk (the smaller the account the more risk).

Remedy of Risk

Our coding team has performed an update to the EPIC V3 software to trade a base account size of 30 contracts (300,000.00 USD or greater) to allow for greater range of trading price and volatility.

The software instructions for the most part have not changed, the original EPIC V3 protocols remain per previous white paper linked above – at the start of this document.

What is different is simply the size of account as the base case instructional presumption within the code which allows for the software to trigger in smaller “dot plots” within various trading ranges and structure.

Projected Returns

The projected returns annually are expected to drop to a base case scenario of +-40% in an extremely volatile market as we are witnessing since the on-set of COVID-19, however, in times of less volatility we expect this will significantly advantage the EPIC V3.1 updated software and annual returns are expected to well exceed EPIC V3 software coded for a 10 contract base case scenario.

Put simply, the larger the account the more advantaged (refer to the original white paper for further code instruction detail).

At times when crude oil trading price range and volatility return to “normal” conditions we expect returns to easily exceed 100% per annum, however, all return expectations at this juncture are only predicted results based on in-lab testing and not real-world trade. All return estimations and projections are simply theoretical until proven otherwise.  

Our oil trade alert clients can refer to the document below for more detail pertaining to the alerts service;

April 19, 2020 Oil Trade Alert Client Memorandum: Important Note: Oil Traders, Live Alerts, Trading Room, Machine Trading #OOTT, $CL_F, $USO #tradealerts

Business Inquiries.

For information about oil trade alerts, oil trading room and oil trade reporting contact Compound Trading Group at compoundtradingofficial@gmail.com.

For information about automated machine trading platforms contact our agent representative Richard Regan as follows:

CONTACT
Email richr@sovoron.com
Phone 1-849-861-0697

Follow

Tweets by EPICtheAlgo

Others in this document series can be found here:

  • December 10, 2023: EPIC Update: v6.1.1 Machine Learning Trade Software – Final Protocol Real World Results
  • June 3, 2023: EPIC v4.1.1 Crude Oil Machine Trade Software White Paper | June 3, 2023
  • March 28, 2022: EPIC v3.3 Crude Oil Machine Trade Software White Paper | March 28, 2022 Update
  • January 7, 2021: EPIC v3.1.5 Crude Oil Machine Trade Software White Paper | Updated January 11, 2022 w/ Trade Execution Data
  • June 4, 2020: EPIC V3.1.1 Crude Oil Machine Trade Software Update | June 4, 2020 White Paper #OOTT $CL_F $USO $USOIL
  • April 19, 2020: EPIC V3.1 Crude Oil Machine Trade Software Update Details | White Paper #OOTT $CL_F $USO $USOIL
  • December 29, 2019: How EPIC v3 Crude Oil Machine Trading Outperforms Conventional Trading

Article Topics; Crude, Oil, Trading, Algorithm, Machine Trading, DayTrading, Futures, EPIC, Trade Alerts, Oil Trading Room, $CL_F, $USO, $USOIL

Read More

EPIC v3 Crude Oil Code Updates: Drawdown Protocols vs Expected Return (follow-up to Feb 2 note) #machinetrading #oiltradealerts

February 8, 2020February 8, 2020 Curt MelonopolyMachine TradingAlgorithm, Crude, machine trading, Oil, Oil Trade Alerts, returns, Trading

EPIC v3 Crude Oil Trading Software Updates, A Follow-Up to Last Week’s Note on February 2nd.

RE: Software Drawdown Protocols vs Expected Returns and Oil Trade Alerts.

Good day traders,

Last weeks note (if you have not read it) can be found here;

EPIC v3 Crude Oil Code Updates: Drawdown & Short Selling Protocols $CL_F $USO #machinetrading

Since the Feb 2 note I have had some questions from our clients that I suspect others have also, so I a summarizing responses from those questions below.

Our Primary Objective

The goal in our development is now limiting draw-downs, we know the software works and that is not at issue, at issue is the size of potential draw-down.

Our primary objective is to find the range of “throttle” in the software that provides a consistent return with the least volatility in ROI.

Draw-down Protocol “Events”

The software is designed to trade on historical structures, trade set-ups, order flow and more – find details in the most recent white paper update can be found here.

Specifically to draw-down protocols, in my last note I described the change in code to be throttled 50% (limiting potential downside to 50% of what is described in the white paper). I also explained that if required we would throttle it again another 50% of its most recent setting.

Last week crude oil seemed to be basing from a technical perspective and the software (considering the chop) did well, however, we were not comfortable with the potential draw-down risk in the “event” driven chop.

At issue specifically are market “events”, such as with the recent virus event out of China. Event periods will potentially cause draw-downs, our objective is to avoid this volatility.

As of today we have done that – throttled the draw-down protocol again.

The reason is simple, our objective now is to limit unnecessary draw-down percentages to the point that we can allow the software to run without concern to draw-downs even if that limits potential returns. For now this is the case and as explained previously if we open the throttle at all we will advise our clients well in advance. 

In practical terms this means that the software size held is limited intra-day when in draw-down and the range is limited. The range is not changed from previous, being one full “quad” and/or “channel” range on the EPIC Algorithm Model but the size held is limited to near 1/10 size. The size can very from approximately 1/10 to 3/10 size but the software will “flash” in and out any adds with near zero range stops executing at each key support in a draw-down.

Oil Trade Alerts

This will at times cause the oil trade alerts feed to be very active but yet at times will be very silent as the software will only execute the highest probability trades also.

This represents the tightest throttle possible in our code.

Expected Returns vs. Draw-Down Risk

Through development we have had plateaus of code structure ranging from 20% – 150% ROI expectation and we even looked toward 300% being possible.

However, there is a volatility to potential draw-down that comes with higher expectation of ROI. This has to be balanced with account size and risk tolerance.

Our objective is to code software that has limited draw-down with highest ROI on specifically 10 contract size accounts. As explained previously, 30 contract and higher accounts this is much different. 

At the current throttle setting our estimation of returns is somewhere between 40 – 80% per year (likely closer to 40%) with very littler risk to the down-side as we have run the software in this throttle range prior for some time and this is the ROI expectation. The variance in ROI expectation (40%- 80%) is in consideration of market conditions and not how we expect the software to run.

After the software has run for a considerable time at this level of “throttle” we will look at releasing the “throttle”, but this will be only considered after some time and again I emphasize that our clients will be notified well in advance.

Being as transparent as I can, the reason for this is motivated by the fact that we have been in development for near 4 years and there is a point where returns need to be the norm and not volatility in development. We need to run a low risk environment for some time now as development has been costly. When we have recouped development costs and put some profit back in to the project we can then look at further development and associated risk. 

Our next white paper update will reflect the content of these updates notes.

Any questions please send me a note via email compoundtradingofficial@gmail.com.

Thank you.

Curt

Further Learning:

If you would like to learn more, click here and visit our Crude Oil Trading Academy page for complimentary oil trading knowledge – posts from our top crude oil traders that includes learning systems, blog posts and videos.

Welcome to NYMEX WTI Light Sweet Crude Oil Futures.

Subscribe to Oil Trading Platform:

Standalone Oil Algorithm Newsletter (Member Charting Reports sent out weekly at times in report form or updated on email regularly).

Real-Time Oil Trading Alerts (Private Twitter feed and Discord Private Server Chat Room).

Oil Trading Room Bundle (includes Weekly Newsletter, Trading Room, Charting and real-time Trading Alerts on Twitter and private Discord Chat Room Server).

Commercial / Institutional Multi User License (for professional trading groups).

One-on-One Trade Coaching (Via Skype or in person).

Tweets by EPICtheAlgo


Article topics; crude, oil, trading, machine trading, algorithm

Read More

Protected: S&P 500 Trading Strategies. Charting, Time Cycles, Price Targets, Algorithmic Model (SPY) | Premium, Oct 16 2019 $SPY $ES_F $SPXL, $SPXS

October 16, 2019October 16, 2019 FREEDOM SPYSP500 SPY Trading Strategies$ES_F, $SPXL, $SPXS, Algorithm, Chart, Model, price targets, SP500, SPY, strategies, time cycles, Trading

This content is password protected. To view it please enter your password below:

Read More
White Paper Updated Dec 29, 2019: How EPIC v3 Crude Oil Machine Trading Outperforms Conventional Trading

White Paper Updated Dec 29, 2019: How EPIC v3 Crude Oil Machine Trading Outperforms Conventional Trading

September 23, 2019December 12, 2023 Epic the AlgoCrude Oil Day Trading, Crude Oil Newsletter, Crude Oil Trading Algorithm (EPIC), Machine TradingAlgorithm, Crude, Daytrading, EPIC, Futures, Machine Learning, Oil, Trade Alerts, Trading, Trading Room

85%+- Returns: Real-World Trade Performance and Why ROI Is Expected to Grow.

December 29, 2019 2:35 PM EST EPIC v3 Oil Trading Software Update.

Updates for this document series can be found here:

  • June 4, 2020: EPIC V3.1.1 Crude Oil Machine Trade Software Update | June 4, 2020 White Paper #OOTT $CL_F $USO $USOIL
  • April 19, 2020: EPIC V3.1 Crude Oil Machine Trade Software Update Details | White Paper #OOTT $CL_F $USO $USOIL 

Draft white paper outlining key reasons EPIC v3 oil futures machine trading software outperforms conventional trading methods:

  1. Lightening Fast Decisions. EPIC crude oil trading software executes trades to over 8700 weighted decisions instantly. The instructions provided within the architecture is growing daily. A human trader cannot make decisions as quickly, cannot process the data required for most intelligent trading probabilities and cannot execute trades as precisely.
  2. Algorithmic Chart Models. The EPIC software includes over thirty proprietary algorithmic chart models and the catalogue is growing. The algorithmic models have been designed, tested and refined in real-world trade for over 3 years by a team of day traders, each with over 20 years of experience. The oil trading models represent all time-frames from 15 second to monthly time-frames of trade. The algorithmic models have been back-tested to sixty months historically.
  3. Conventional Charting. The software includes conventional charting structures on all time-frames, also back-tested sixty months.
  4. Common Trade Set-Ups. Included in the software are common trade set-ups that oil day traders implement. This is dynamic and additions are made regularly to the software code reflecting current structured trade set-ups.
  5. Order Flow. EPIC IDENT™ is data-driven order flow intelligence in real-time to achieve best outcomes.The software includes and executes to a proprietary order flow identification system that tracks behavior (specifically isolating other market machine liquidity) and weighs identified entities and historical trade patterns to its trade decisions (instructions). EPIC IDENT™ increases its intelligence as it gathers data intra-day specific to liquidity flow, historical patterns, time of day, volatility, various preferences, latency, rejects and more. The method is similar to back-testing charting, however, the process is real-time. In short the software is looking for “fingerprints” within market liquidity. We cannot back-test 60 months as with charting but back-testing from date of software inception is possible.
  6. Time Cycles. Time cycles are within all algorithmic and conventional trading model structures, order flow also has identified time cycles and other time cycle events such as weekly reporting in oil markets such as API, EIA and rig counts. Additionally there are time-of day market time cycles around the world. Time-cycles are included in the software architecture.
  7. ROI Trajectory “Game”. The software has a “game” element in that it is designed to continue its most recent ROI trajectory (or return to its trajectory of ROI should it have a draw-down period). In other words, if the trajectory of ROI is for example 100% and it draws-down to 80% it then will “weigh” trade decisions more to the most probable trade set-ups until the ROI trajectory is returned. It also will push its decision “weight” to exceed the current ROI trajectory to establish a better ROI to which it is then “obligated” to maintain and correct to, hence the expectation that the ROI will continue to improve over time. This is the “machine learning” component of development. We are finding that the software is discovering increasingly more creative ways to “game” the ROI return trajectory. This Sept 4, 2019 document details an insider look at this topic within development. Edited Sept 5, Draw-Down Oil Daytrading Session: Question and Answer Review | EPIC V3 Crude Oil Machine Trading Software.

Combined, these advantages enable the EPIC v3 Crude Oil Trading software to outperform conventional trading methods.

Introduction.

The world of public market trade is rapidly changing. It is estimated (depending on source) that over 80% of crude oil futures are not traded by humans and are now traded by machine.

Machine trade may be simple bot style software, high-frequency software or more sophisticated architecture as with the EPIC v3 class of algorithm. 

Our team commenced the oil trading software development journey four years ago with algorithmic chart model development. From day one we employed computer scientists to work with us on a daily basis to build software emulating our trading methods.

Over time the software started to win more trades than our traders and today we rely almost solely on the software to execute trades. We simply “tweak” the software at each trade sequence to improve performance.

EPIC v3 software is our 3rd generation oil trading software. EPIC v1 tested returns at about 20% per annum, EPIC v2 at 40% per annum and EPIC v4 architecture was too aggressive for our risk threshold. We settled on EPIC v3 about ten weeks ago and have been refining its code trade by trade since.

The current EPIC v3 win-rate consistently comes in at +-90% per trade sequence (variable by +-7%).

The current EPIC return is projected at 85% per year (and has been as high as 140%) – based on real world performance (audited trades available) and is expected to increase over time. The current period of time spans approximately six months and includes hundreds of trade executions (nearing thousands). 

For December 27, 2019 Profit & Loss Daily =$331. YTD +$40,275. Projected $84,973 or 85% Per Annum. EPIC v3 Oil Machine Trade 100k Sample Account (live video, time stamped alerts, v3 audited P&L available) #OOTT $CL_F $USOIL $WTI $USO #oiltradingroom #oiltradealerts

EPIC, oil, algorithm, returns
For December 27, 2019 Profit & Loss Daily =$331. YTD +$40,275. Projected $84,973 or 85% Per Annum. EPIC v3 Oil Machine Trade 100k Sample Account #OOTT $CL_F $USOIL $WTI $USO #oiltradingroom #oiltradealerts

https://twitter.com/EPICtheAlgo/status/1211013973329485824

For October 4, 2019 Profit & Loss Daily +$1,838. YTD +$34,218. Projected $140,331 or 140% Per Annum. EPIC v3 Oil Machine Trade 100k Sample Account (live video, time stamped alerts, v3 audited P&L available) #OOTT $CL_F $USOIL $WTI $USO #oiltradingroom #oiltradealerts

Oil, trading, returns
Oct 4, 2019 Profit & Loss Daily +$1,838. YTD +$34,218. Projected $140,331 140% Per Annum. EPIC v3 Oil Machine Trade #OOTT $CL_F $USOIL $WTI $USO #oiltradingroom #oiltradealerts

Account Size – ROI and Draw-Down Volatility.

The smaller the account size traded the more difficult it is for the software to limit risk to down-side and provide optimum returns, however, most recently considerable advancements in the software should limit the draw-down with smaller accounts considerably.

The software is designed to trade within a sequence of trade within structures or set-ups. As the oil market price changes, the software trading logic uses all the different data to update the decision tree utilizing the instruction rule-set.

You can imagine this as a dot plot process similar to the game “go” – not exactly, but the concept helps to visualize how the software plots a sequence plan for trade.

The “ebb and flow” of regular oil market trade allows opportunity for the software to plot a plan of trade within a sequence, the larger the account the more dots can be plotted (trades can be “bite sized” entries within an “ebb and flow”).

The sample account size for the purpose of this document is at the smallest range, being 100,000.00. A 1,000,000.00 account would expect approximately half the volatility / draw-down exposure and up to 50% more return. A 10,000,000.00 account would be considerably more stable to draw-down risk and potential returns and so on.

Draw-down Protocol.

During any particular 24 hour trading period the EPIC v3 software protocol (as of October 6, 2019 updates) expects on average draw-down no more than as follows;

  • Account size and average 24 hour drawdown 10,000,000.00 = 1.5 %, 1,000,000.00 = 3%, 100,000.00 = 6%, 50,000.00 = 12%, 25,000.00 = 24%.

Hard stop architecture is also available, however, the annual expectation of returns would be significantly less than represented in the current real-world trade example above. 

Real-World Trader / Investor Use.

In real-world examples the EPIC v3 oil trading software is being used daily by oil traders as an additional indicator and / or as an auto  trading mechanism.

Examples include the Compound Trading Group live oil trading room (live broadcast of trades via voice and charts), live alert service via Twitter and Discord private server feeds and regular Oil Trading Reports that include algorithmic and conventional chart structures and guidance.

Additionally, SOVORON™ uses our data flow to integrate to their platform. SOVORON™ ‘Algorithmic machine trading of your personal Crude Oil Futures exchange account’. See www.sovoron.com for information. 

Architecture of API Trade.

EPIC v3 software is designed to be deployed remotely – accessing an account and executing trades. This provides the account holder with ultimate control. The account holder grants the software access and the software executes machine trades to the account. The account holder can turn on or off access at any time. Architecture provides opportunity for decentralized platform integration.

Documentation.

Video. Our team traders and engineers have live video recording of the trading sessions with EPIC v3 software within a trading room environment.

Trader and Developer Repository. We provide guidance to our subscriber (paywall) clients in a Discord private server (charts and trade set-up explanations) in a real-time environment. The private server acts as a repository for our developers and our trading service (paywall) clients.

Live Trade Alerts. All trades have been broadcast over mic in a live trading room (recorded as mentioned above) and most have been alerted by way of text instruction to the Discord private server and/or private Twitter feed for time-stamped evidence.

Broker Accounts. The EPIC v3 trades are real-world trades and as such broker profit and loss statements can be made available.

Client Reporting. We provide regular reporting to our trading service clients (paywall) that explains the process of execution by the software. Examples of the guidance provided, trade alerts issued, Discord private server discussions and live trading room video can be found in this document (which is one of many published) Daytrading Crude Oil in Oil Trading Room: 6 Trades, 6 Wins. How We Did It | Alerts, Strategies, Video, Charts. This document provides a standard update document provided to our clients Protected: Crude Oil Trading Report Strategies | Alerts, Signals, Charts, Algorithms, Trading Room, P&L | Premium | Sept 2, 2019 use password CLTRADER.

Conclusion.

This paper outlines the opportunity that change in machine trade within global finance markets presents.

Competitors within the machine trade industry are becoming more and more refined / successful – the best in class are assumed to be winning a larger portion of proceeds.

The most significant immediate challenge developers face in machine trade within financial markets is building a product that can win within a prescribed threshold of stability limiting down-side and yet over-perform conventional trading methods. 

Soon thereafter the challenge becomes competing against “like-kind” machine trade peers and being best in class.

It is our expectation that fewer and fewer competitors will achieve more of the proceeds (as a whole of trade in public markets) at an exponential rate, which does provide urgency to development and deployment.

The EPIC v3 trading software achieves consistent, predictable and very adaptable architecture that provides exceptional ROI potential.

Business Inquiries.

For information about oil trade alerts, oil trading room and oil trade reporting contact Compound Trading Group at compoundtradingofficial@gmail.com.

For information about automated machine trading platforms contact our agent representative Richard Regan as follows:

CONTACT US
Email richr@sovoron.com
Phone 1-849-861-0697

Follow

Tweets by EPICtheAlgo

document revised September 24, 2019 9:22 PM EST

document revised October 6, 2019 2:00 PM EST

document revised December 29, 2019 2:35 PM EST

Others in this document series can be found here:

  • December 10, 2023: EPIC Update: v6.1.1 Machine Learning Trade Software – Final Protocol Real World Results
  • June 3, 2023: EPIC v4.1.1 Crude Oil Machine Trade Software White Paper | June 3, 2023
  • March 28, 2022: EPIC v3.3 Crude Oil Machine Trade Software White Paper | March 28, 2022 Update
  • January 7, 2021: EPIC v3.1.5 Crude Oil Machine Trade Software White Paper | Updated January 11, 2022 w/ Trade Execution Data
  • June 4, 2020: EPIC V3.1.1 Crude Oil Machine Trade Software Update | June 4, 2020 White Paper #OOTT $CL_F $USO $USOIL
  • April 19, 2020: EPIC V3.1 Crude Oil Machine Trade Software Update Details | White Paper #OOTT $CL_F $USO $USOIL
  • December 29, 2019: How EPIC v3 Crude Oil Machine Trading Outperforms Conventional Trading

Article Topics; Crude, Oil, Trading, Algorithm, Machine Learning, DayTrading, Futures, EPIC, Trade Alerts, Oil Trading Room, $CL_F $USO

Read More

Protected: S&P 500 Trading Strategies. Charting, Time Cycles, Price Targets, Algorithmic Model (SPY) | Premium, Aug 19 $SPY $ES_F $SPXL, $SPXS

August 19, 2019 FREEDOM SPYSP500 SPY Trading Strategies$ES_F, $SPXL, $SPXS, Algorithm, Chart, Model, price targets, SP500, SPY, strategies, time cycles, Trading

This content is password protected. To view it please enter your password below:

Read More

How to Trade US Dollar Index (DXY) Large Time Cycle in to Week of August 5 #USD $DXY $UUP #tradealerts #swingtrading

August 1, 2019December 15, 2019 Curt Melonopoly$DXY US Dollar Algo, Swing Newsletters, Swing Trading$UUP, Alerts, Algorithm, Charts, Currencies, DXY, Strategy, Swing Trade, time cycles, Trading, US Dollar, USD

Trading Strategy for US Dollar Trade Alert Issued This Morning in Premarket for the Swing Trade Positioning in to Week of August 5, 2019 Time Cycle.

This a very important trading opportunity not just for the US Dollar, but many other instruments of trade on the equity, commodity and currency markets are affected by the price of the US Dollar. Below is your complete trading strategy for the time cycle peak coming in the Dollar.

On public facing Twitter feeds the alert reads;

“Member Alert: Large US Dollar Index (DXY) time cycle week of Aug 5, 2019 (extends 7 trading days either side). Trade Set Up detail to your email in today’s premarket. #timecycles $DXY $UUP #USD #SwingTrading”

Member Alert: Large US Dollar Index (DXY) time cycle week of Aug 5, 2019 (extends 7 trading days either side). Trade Set Up detail to your email in today's premarket. #timecycles $DXY $UUP #USD #SwingTrading

— Melonopoly (@curtmelonopoly) August 1, 2019

On the private member alert feed the alert reads;

“US Dollar Index (DXY) Long trade likely to turn short other side of Aug 5 week, watch for report with all signals $DXY $UUP #swingtrade #USD”

https://twitter.com/SwingAlerts_CT/status/1156872463273402369

Below is the chart and link for the US Dollar (DXY) time cycle alert;

US Dollar Index (DXY) Long trade likely to turn short other side of Aug 5 week, watch for report with all signals $DXY $UUP #swingtrade #USD

https://www.tradingview.com/chart/DXY/2qXxfABT-US-Dollar-Index-DXY-Long-trade-likely-to-turn-short-other-side/

US Dollar Index (DXY) Long trade likely to turn short other side of Aug 5 week, watch for report with all signals $DXY $UUP #swingtrade #USD

How to Trade the US Dollar (DXY) Time Cycle Peak.

The trading strategy for the US Dollar Index is simple if you use the model chart provided above.

In early 2018 we had alerted that the US Dollar was divergent to the downside and that a run in the dollar was imminent. The US Dollar traded up since that time from sub 90.00 to currently trading at 99.91.

When the US Dollar traded higher (after our alerts) it then reached the area of the main pivot (shown on chart above with horizontal red dotted line). The Dollar then traded around that pivot for some time. The trading pivot is important in your trading plan.

Simple Chart Symmetry and Price Targeting (price extensions) for this time cycle says to measure from the recent lows (trading just under 90.00) to the pivot area of 96.64 (about 7.00) and add the 7.00 approximately to 96.64 and you get about 103.50 ish. There are different ways to measure this – you can take the hard and fast support and resistance lines on the chart and measure from there or use exactly what price action said. In other words, the chart says support was 90.00, but the Dollar traded under 90.00 before it turned back up and got bullish. Depending on how you use those numbers this then determines your extension to the top. Lets call it 103.50 and use that for this example for your trading strategy.

The charting says the time cycle peak is the weak of Aug 5, 2019. This is a large time cycle so you have to allow for a week or so either side of the weak of the peak. Coming out of the other side of that peak the trade action (trading trajectory) will be key. You will either see a continuation of the current bullish trend or a turn to the bearish trade side. Probability says the price of the US Dollar will turn down. However, this is not always the case.

The chart says that 102.92 is your peak resistance price, but this can be extended up some for two reasons. One reason is the price extension you may measure from the previous lows, in this instance you would see the Dollar trade in to the 103s or 104s before turning. The other reason for a price higher than 102.92 is a simple over trade extension that happens at large time cycle tops and bottoms in trade – an over exaggerated move.

If the trade trajectory continues bullish then you simply extend the price up one structure above the current area of trade (see chart below). This is an unlikely scenario but it may occur. This bullish run would then peak in to the week of March 30, 2020 (this can change as we come near to the date, watch for charting updates). The price target in this scenario is 109.30 for March 30, 2020.

US Dollar Index (DXY) Bullish trading strategy for 109s in to Mar 30 2020 $DXY $UUP #swingtrade #USD

https://www.tradingview.com/chart/DXY/FVwXgu9P-US-Dollar-Index-DXY-Bullish-trading-strategy-for-109s-in-to-Ma/

US Dollar, Swing trade, Strategy
US Dollar Index (DXY) Bullish trading strategy for 109s in to Mar 30 2020 $DXY $UUP #swingtrade #USD

The Bear scenario to short the US Dollar is more likely, below is your trading strategy.

As noted above, simply wait for the week of August 5, 2019 and watch trade the week on the other side. Watch the key resistance areas on the chart. Early on in to the time cycle start to size your trade and continue sizing the trade (in my case it will be short $UUP likely) and then start to take profit at each support on the way back down as the US Dollar trades lower in to March 30 of 2020.

It is important to get your full size in early enough but not too early so you get caught on the wrong side.

If you need help with the trade let me know.

Watch the chart resistance close as we trade the markets over the coming few weeks, watch the apex of the quad the US Dollar is trading in currently on the chart. Watch for the inflection points. You can also bring your time down to a daily or 4 hour chart to get a better feel for what trade is doing.

Also, be sure to watch our trade alerts on our alert feeds and in live trading room. If you need some coaching go to our website and register for a minimum 3 hours.

Email me as needed compoundtradingofficial@gmail.com.

Thanks,

Curt

Other Reading:

US Dollar Index on Market Watch https://www.marketwatch.com/investing/index/dxy

Dollar hits two-year high after Federal Reserve cuts interest rates by a quarter point as expected https://cnb.cx/2MsfQn1

Recent Swing Trade and Day Trading Reports (charts can be brought down to Day Trading time frame):

Protected: Swing Trading Strategies (Earnings) Part 4 : Premium | $NOV, $TREX, $CHEGG, $TSLA, $AMD, $USO …

Protected: Swing Trading Strategies (Earnings) Part 3 : Premium | $AMZN, $GOOGL, $TWTR, $FB, $JBLU, $OAK, $INTC, $TSLA, $AMD, $SQ …

Protected: Swing Trading Strategies (Earnings) Part 2 : Premium July 17 | FACEBOOK (FB) VS AMAZON (AMZN) …

Protected: S&P 500 Trading Strategies. Charting, Time Cycles, Price Targets, Algorithmic Model (SPY) | Premium, July 15 $SPY $ES_F $SPXL, $SPXS

Protected: Volatility (VIX) Trading Strategies Report. Premium July 15 $VIX $TVIX $UVXY $VXX #TimeCycles #PriceTargets

Protected: Swing Trading Strategies (Earnings) Part 1 : Premium July 14 | $PXD $TLRY $TSLA $EEM $AGN $AMD $INTC $XOP $MGI $BOX …

Protected: Swing Trading Strategies | SP500 $SPY Volatility $VIX Gold $GLD Silver $SLV Bitcoin $BTC Oil $USO US Dollar $DXY | July 7 Premium #timecycles

Protected: Daytrading Bitcoin (BTC) and Intra-Week Short Term Swing Trades July 7 | Premium $BTC $BTC.X $XBTUSD $XBT_F

Protected: Swing Trading Strategies, Charts, Alerts w/ Video | Premium $PXD $TLRY $TSLA $EEM $AGN $AMD $INTC $XOP $MGI $BOX $FB $PLUG $BTC $LYFT $IOTS $SQ $STNE $TEUM $AU …

Master Trading Profit & Loss Statement (Most Recent – Updated Regularly – Check Blog for Updates):

Trading Profit & Loss Report | Trade Alerts Nov 2016 – June 26, 2019 Day Trades, Swing Trades, Oil, BTC Etc.

Recent Daily Trading Profit & Loss Reports:

Trading Profit & Loss Report (Trades, Alerts) July 10 “MY ANGRY RANT – WHY MOST TRADERS LOSE”, $AMD, $CL_F, $USO, $BTC, $BTC.X, $XBT_F #OOTT

Trading Profit & Loss Report (Trades, Alerts) for July 8 $AMD, $BTC, $XBT_F, $CL_F, $USO

Trading Profit & Loss Report (Trades, Alerts) for July 3 $AMD, $BTC, $XBT_F, $WTI, $CL_F, $USO

Daily Trading Profit & Loss (Alerts) Report: July 2, 2019 $AMD, $BTC, $XBT_F, $WTI, $CL_F, $USO

Daily Trading Profit & Loss (Alerts) Report: July 1, 2019 $AMD, $KOOL, $BTC, $XBT_F, $WTI, $CL_F, $USO

Recent Premarket Notes (published as time allows, what we’re up to with our trading):

Premarket Notes July 31, 2019: FOMC, EIA, #OOTT, $USO, $NOV, $TREX, $CHEGG, $TSLA, $AMD …

Premarket Trade Report July 12 | Notes, Alerts, Watch List, Reporting Etc $SGBX, $AMD, $USO, $GLD, $SLV, $SPY, $BTC.X, $VIX, $DXY, #OOTT

Protected: Premarket Watch List July 9 $CHEK, $OGI, $AZRX, $AMRH, $RHT, $ACIA, $SQ, $AMD, $USO, $GLD, $SLV, $SPY, $BTC.X, $VIX, $DXY

Premarket Watch List July 8 $SGMO, $AMD, $OASM, $AYTU, $CBIO, $SYMC, $ORN, $USO, $GLD, $SLV, $SPY, $BTC.X, $VIX, $DXY

Premarket Notes: Swing Updates, New BTC Platform w/Machine Trade, Oil Machine Trade Completion $USOIL $WTI $CL_F $BTC $BTC_F $XBT_F #premarket

Premarket Note: Equities, Oil Levels to Watch, Swing Trades/Alerts, P&Ls, Webinars: Oil, Swing Trading, Bitcoin | $USOIL $WTI #OOTT $BTC #premarket

Company News:

SOVORON™ Selects Compound Trading Group Machine Learning Data | Media Release

Subscribe to Learn and Profit:

Click Here for Subscription Service Price Tables.

Free Mailing List(s):

Join Email List for Free Trade Charting Trade Set-ups, Deals, Podcasts and Public Webinars.

Free Swing Trading Periodical Contact Form (Complimentary Swing Trade Set-Ups to Email)

Public Chat:

Visit our Free Public Chat Room on Discord.

Article Topics: US Dollar, USD, Trading, Strategy, Charts, Algorithm, Currencies, Alerts, $DXY, Swing Trade, $UUP, time cycles


Read More

Protected: S&P 500 Trading Strategies. Charting, Time Cycles, Price Targets, Algorithmic Model (SPY) | Premium, July 15 $SPY $ES_F $SPXL, $SPXS

July 15, 2019July 15, 2019 Curt MelonopolySP500 SPY Trading Strategies$ES_F, $SPXL, $SPXS, Algorithm, Chart, price targets, SP500, SPY, strategies, time cycles, Trading

This content is password protected. To view it please enter your password below:

Read More

Protected: Daytrading Bitcoin (BTC) and Intra-Week Short Term Swing Trades July 7 | Premium $BTC $BTC.X $XBTUSD $XBT_F

July 7, 2019July 7, 2019 Curt MelonopolyBitcoin (BTC) Algorithm (Crypto), Bitcoin Trading Strategies$BTC, $BTC.X, $BTCUSD, $XBTUSD, Algorithm, BITCOIN, BTC, Chart, Crypto, Daytrading, Trade, XBT_F

This content is password protected. To view it please enter your password below:

Read More

Posts navigation

Older posts
Proudly powered by WordPress | Theme: sharksdesign by reviewexchanger.
 

Loading Comments...