Short Selling in to Resistance Area During Crude Oil Intra-Day Rally
Late Monday We Started A Crude Oil Short Sell Trade Sequence In To Technical Resistance in Advance of API Report Release Tuesday at 4:30.
Below are the trade positions we executed in this trade sequence (API report / resistance strategy) short and long, the charts, technical reasons and live oil trading room raw video.
As of the time of writing the strategy / sequence of trade is still in play.
Before reading this article, please read the introductory article to this series here: How Oil Day Traders Can Learn to Trade Better Using Success & Failure of Our Trading Development Team – Part 1.
The articles in this series are emailed direct to our mailing list – click to register.
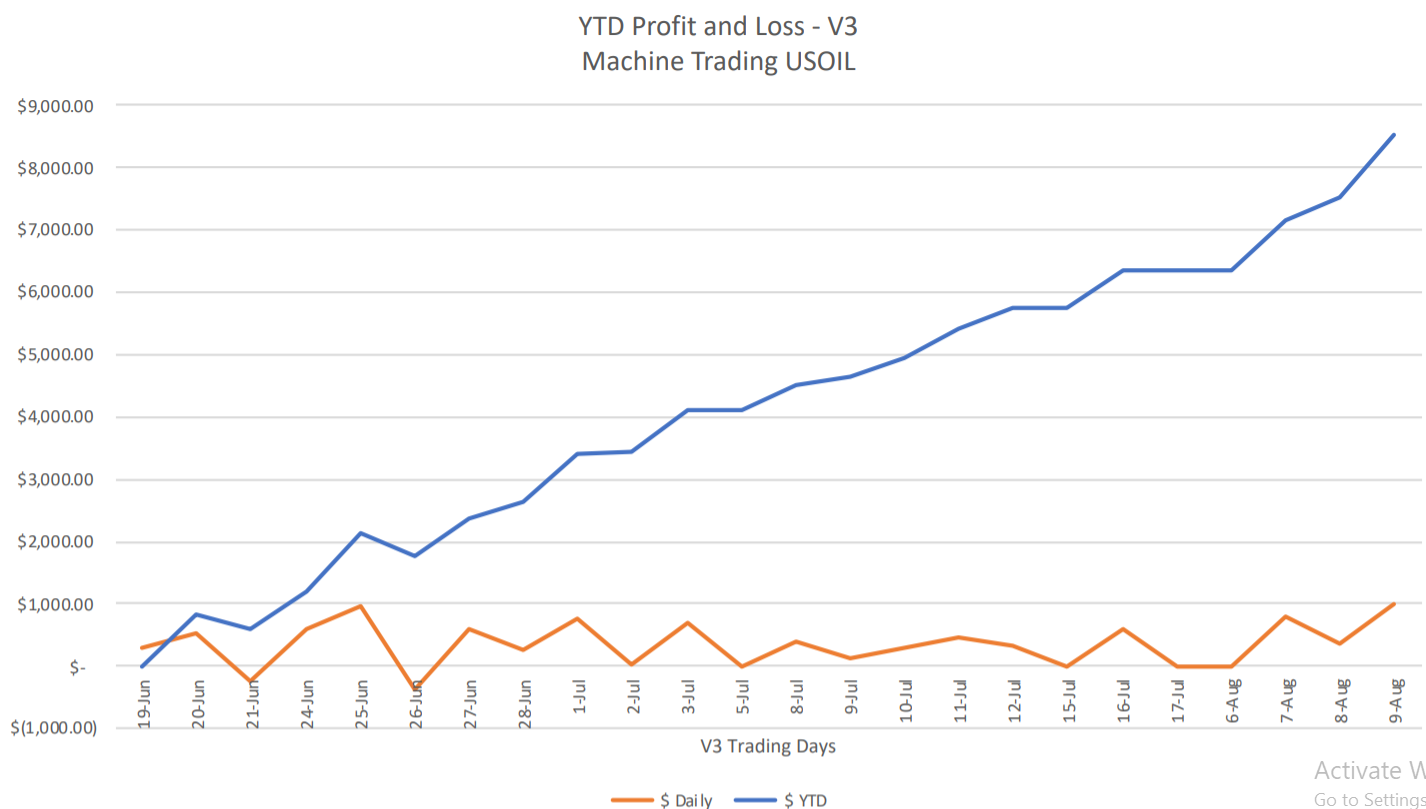
Recent Trading Profit/Loss Results v3 EPIC Oil Machine Trading Software Sample 100K Account:
For Aug 15, 2019 Profit & Loss: Daily +$355 YTD+$9,185 Projected $85,958 or 86% Per Annum. v3 Oil Machine Trade 100k Test Account (v4 period excluded) #OOTT $CL_F $WTI $USO #machinetrading #oiltradealerts
For Aug 15, 2019 Profit & Loss: Daily +$355 YTD+$9,185 Projected $85,958 or 86% Per Annum. v3 Oil Machine Trade 100k Test Account (v4 period excluded) #OOTT $CL_F $WTI $USO #machinetrading #oiltradealerts pic.twitter.com/WlVVCbOlqZ
— Melonopoly (@curtmelonopoly) August 15, 2019
Monday Oil Trading Room Session.
Please note:
- When we alert 1/10 that means (for example) on an account of 100,000.00 that would normally execute a trade size of maximum 10 contracts, 1/10 size then represents 1 contract. We use a 100k account for our sample set for simplicity.
- Trades and the strategy therein are alerted to a live trade broadcast room by voice (by a leader trader) and published as time allows to an oil trading alert feed on Twitter and in a Discord private member server.
The Trade Strategy Set-Up – Selling Crude Oil Futures in To A Rally
Oil trade to start the week was/is bullish in some respects, the MACD on the daily is turned up and Trump seems to be softening a bit on the China trade war, and there was some news about a drone attack on Saudi Production Field also – so shorting in to a rally isn’t exactly going with the momentum. So this trade strategy does not have the momentum factor on our side.
Whenever possible trade with (in the direction of) momentum.
Oil ends higher after drone attack on Saudi production field
Published: Aug 19, 2019 4:09 p.m. ET
https://www.marketwatch.com/story/oil-climbs-after-drone-attack-on-saudi-production-field-2019-08-19
Nevertheless, technically oil trade intra-day was starting to get near resistance areas on various charting time frames, nearing resistance on important trend-lines on various time frame charts and was already up significantly on the day. At the time we started shorting oil intra-day our IDENT machine trade software was beginning to identify order flow selling pressure from other machine liquidity entities in intra-day markets.
Also, it was Monday trade -getting later in the day and Tuesday at 4:30 is the API report so any rally in price is likely to sell down somewhat (a retrace at minimum).
And finally, on days where crude oil has rallied it is often sold off in overnight futures trade session or in the following regular US regular session.
The price target on this short bias strategy is 55.22 (derived from the most probable price of oil per the EPIC Algorithm model) in to 4:30 Tuesday API report. We started shorting oil at 55.98 intra-day.
A crude oil day trade strategy such as this requires knowing where the technical resistance and support is on various time frame charting and the trader being able to size short trades in to resistance and cover various contract size at various supports. It requires technical know-how and strong risk management (trade size management, understanding technical range and emotional intelligence).
It isn’t an easy trade but comes with significant risk-reward if executed with proper discipline.
As mentioned above, at time of writing this trade sequence is still in play so I will update this article tomorrow with the conclusion of the trade results profit / loss etc. In the meantime I will share some charting, alerts, trading room video etc below so you can get a feel for how we are managing our execution of this particular strategy.
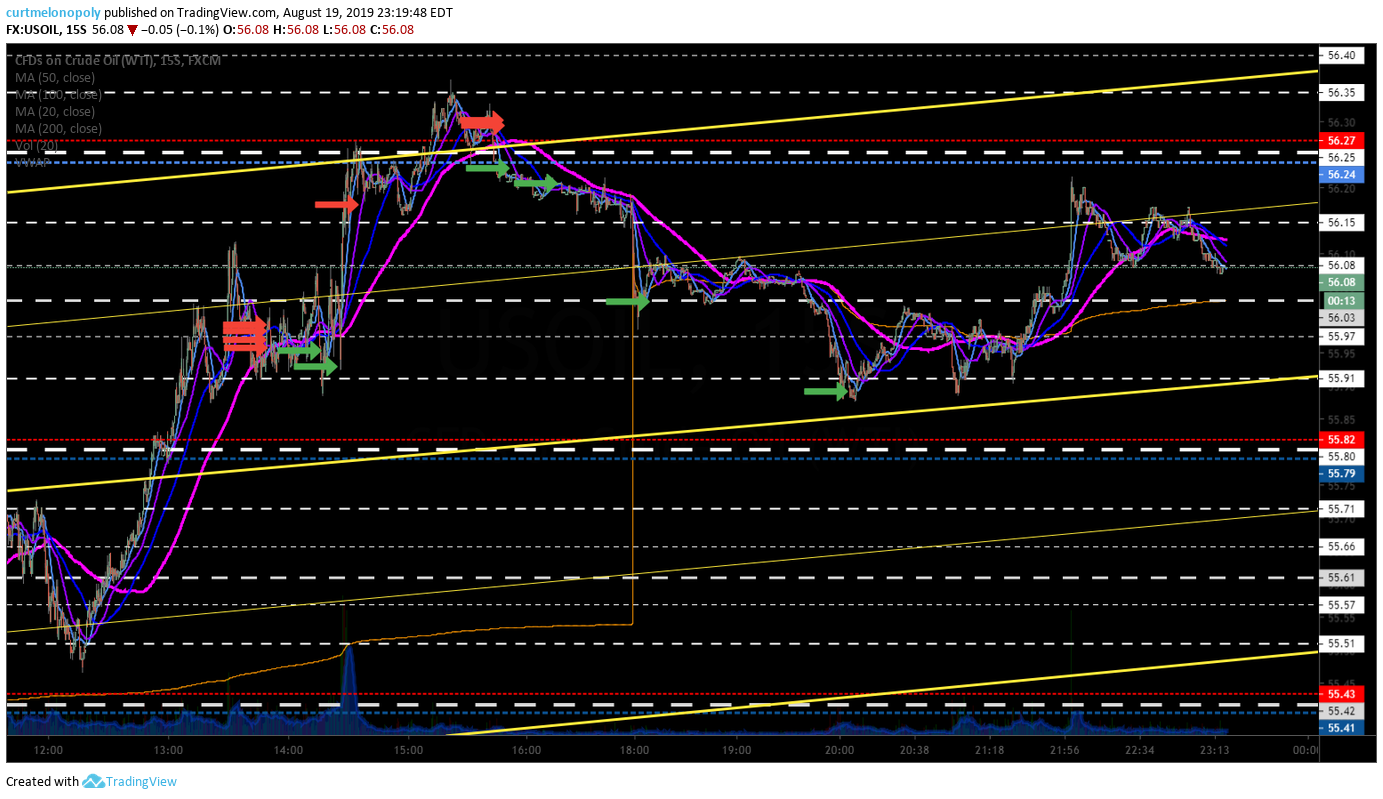
The oil chart below is a summary of all trades so far in the strategy.
Current sequence of all trades are mapped on the oil chart showing short trades (red) and buys to cover short positions (green). At this point we are 1/10 size short (at time of writing).

The first four positions in red at left of chart image is a 4/10 size short when order flow was showing significant selling pressure was starting. This was the battle ground for continued rally in price of oil intra-day or a retrace in price of some sort.
The bulls won the intra-day range battle so we covered 2/10 size for small scalps and held 2/10 size as price continued to rally in to resistance.
We added 2 more positions of size in to the next resistance area of the charting and the progression goes from there, covering wins when possible at support areas and re-shorting at resistance areas.
If price alternately continued bullish we would have covered at least one if not the two add size positions of the short. However, price did not continue to rally and this area of trade was the high of day for oil nearing the end of regular US market session.
This process (of shorting chart resistance areas and covering short positions at support areas) will continue in the strategy (trade sequence) until a strong intra-day sell-off occurs, at which time we will cover the remaining short positions for a win.
The Oil Trading Alerts (screen capture images and comments).
Curt MelonopolyToday at 2:00 PM
55.98 sold 4
bot 1 55.93 holds 3
Curt MelonopolyToday at 2:17 PM
boy .94 holds 2
Curt MelonopolyToday at 2:39 PM
Sell 1 56.18 holds 3, this sequence could run until 4:30 Tues API for a PT of 55.22
Curt MelonopolyToday at 3:47 PM
Sold 2 56.30 bot 1 56.23 holds 4 trading 56.22

Day trade alerts for oil trade strategy in chat room continue in to close of regular market session.
Curt MelonopolyToday at 4:10 PM
Cover 1 56.21 hold 3 short
Curt MelonopolyToday at 4:59 PM
See ya at 6 pm

Alerts continue in to the futures trading session and the trade sequence continues.
Curt MelonopolyToday at 6:02 PM
Buy 1 56.03 hold 2 short
Curt MelonopolyToday at 8:04 PM
Buy 1 55.89 hold 1 short

Trade strategy guidance posted to oil chat room about 15 minute chart model symmetry and sell off area intraday.
Its selling in to mid quad on 15 min model as we thought (trading plan from trading room earlier) Buy the day, sell over night
To clarify : Selling in to lower part of the 15 min quad at mid duration through the quad
Symmetry from 1 week earlier almost identical also

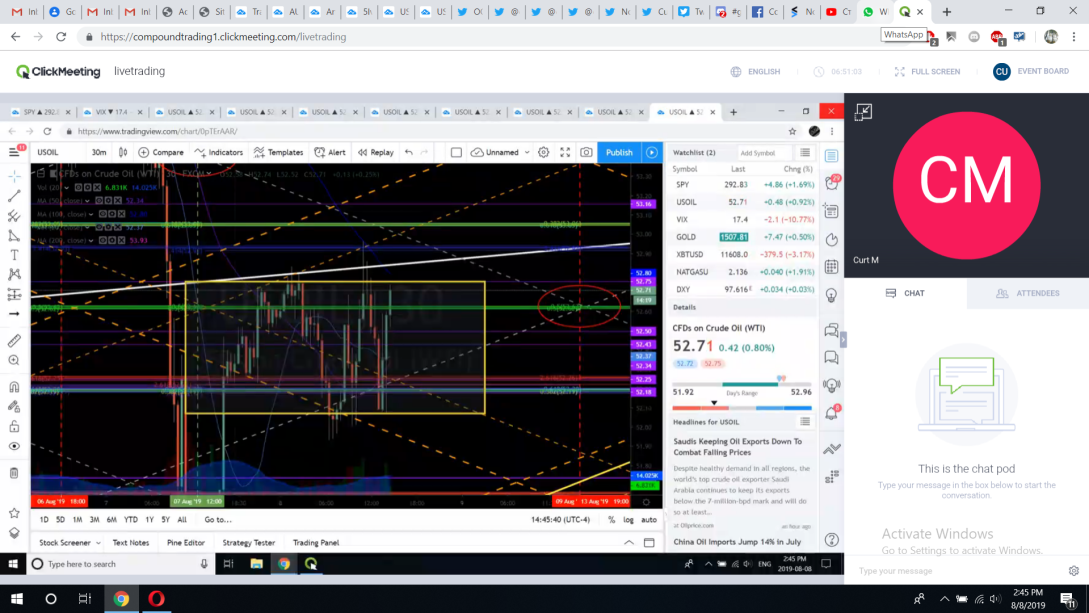
One of many examples of near resistance on oil chart models is the 30 min in picture (dark black trend line above price).

Live Oil Trading Room Video.
Please note: The video below is a raw feed only of the oil trading room for the whole day-trading session (we run the live video feed from 7am to 5pm EST). To listen to comments by the lead trader that contain specifics to his/her oil trade strategy / thinking as he/she and/or the software are trading and sending out alerts, look at the time stamp on the oil trade alert, chart, trading room screen capture image etc in this or any other report and correlate that to the video and go to that part of the video.
I did voice alert the trade executions in the live trading room on Monday (in video), however, there was not great detail as to the trade set-up / strategy, there is some guidance but not lengthy.
If you are struggling with your trading and need some trade coaching go to our website and register for a minimum 3 hours.
Email me as needed [email protected].
Remember also that I am doing an oil trading information webinar once a week for now on (covering our software status and trading techniques) so email me if you would like to attend this next one – you will need a special link and access code to attend.
https://twitter.com/EPICtheAlgo/status/1163213528867770369
Thanks,
Curt
Other Reading:
NYMEX WTI Light Sweet Crude Oil futures (ticker symbol CL), the world’s most liquid and actively traded crude oil contract, is the most efficient way to trade today’s global oil markets. https://www.cmegroup.com/trading/why-futures/welcome-to-nymex-wti-light-sweet-crude-oil-futures.html
Further Learning:
Learning to Trade Crude Oil is Like No Other. At this link you will find select articles from our oil traders real life day-to-day experience in our oil trading room. Crude Oil Trading Academy : Learn to Trade Oil
Subscribe to Oil Trading Platform:
Standalone Oil Algorithm Newsletter (member charting sent out weekly).
Real-Time Oil Trading Alerts (Private Twitter feed).
Oil Trading Room / Algorithm Newsletter / Alert Bundle (includes weekly newsletter, trading room, charting and real-time trading alerts on Twitter).
Commercial / Institutional Multi User License (for professional trading groups).
One-on-One Trade Coaching (Via Skype or in person).
Company News:
Oil Machine Trade Software Development Update – v4 vs v3.
SOVORON™ Selects Compound Trading Group Machine Learning Data | Media Release
Free Mailing List(s):
Join Email List for Free Trade Charting Trade Set-ups, Deals, Podcasts and Public Webinars.
Public Chat:
Visit our Free Public Chat Room on Discord.
Follow:
Article Topics; crude oil, trading, strategies, API Report, Short Selling, Resistance, daytrading, machine trading, $CL_F, $USOIL, $WTI, $USO, CL, alerts, trading room


